Help
Best experienced using the browsers Chrome![]() Firefox
Firefox ![]() Safari
Safari
![]() or IE version (9,10,11)
or IE version (9,10,11)
![]()
Users can also use User Manual to get more information.
- 1. Get an overview of AgingBank from the Home page.
- 2. How to use Browse page to browse experimentally verified data?
- 3. How to use the Search page to retrieve experimentally verified data?
- 4. How to read the Search results for experimentally verified data?
- 5. How to read Detail information of the experimentally verified data?
- 6. How to use the Tools to analyze aging-associated dataset?
- 7. How to use the Cancer & Aging to perform analysis function in cancer samples?
- 8. How to use the Submit & Analysis tool to submit data and perform analysis function?
- 9. How to Download the experimental validated data of AgingBank?
- 10. Click here to download the code for data analysis.(4KB)
The Home page is displayed in Figure 1-1 and Figure 1-2:
Figure 1-1
1. Main functions of the database are provided in menu bar form (boxed in red).
2. Quick browse and search experimentally verified data follow human, animal model and cell related with aging.
3. The statistics for AgingBank.
4. The brief introduction of AgingBank.
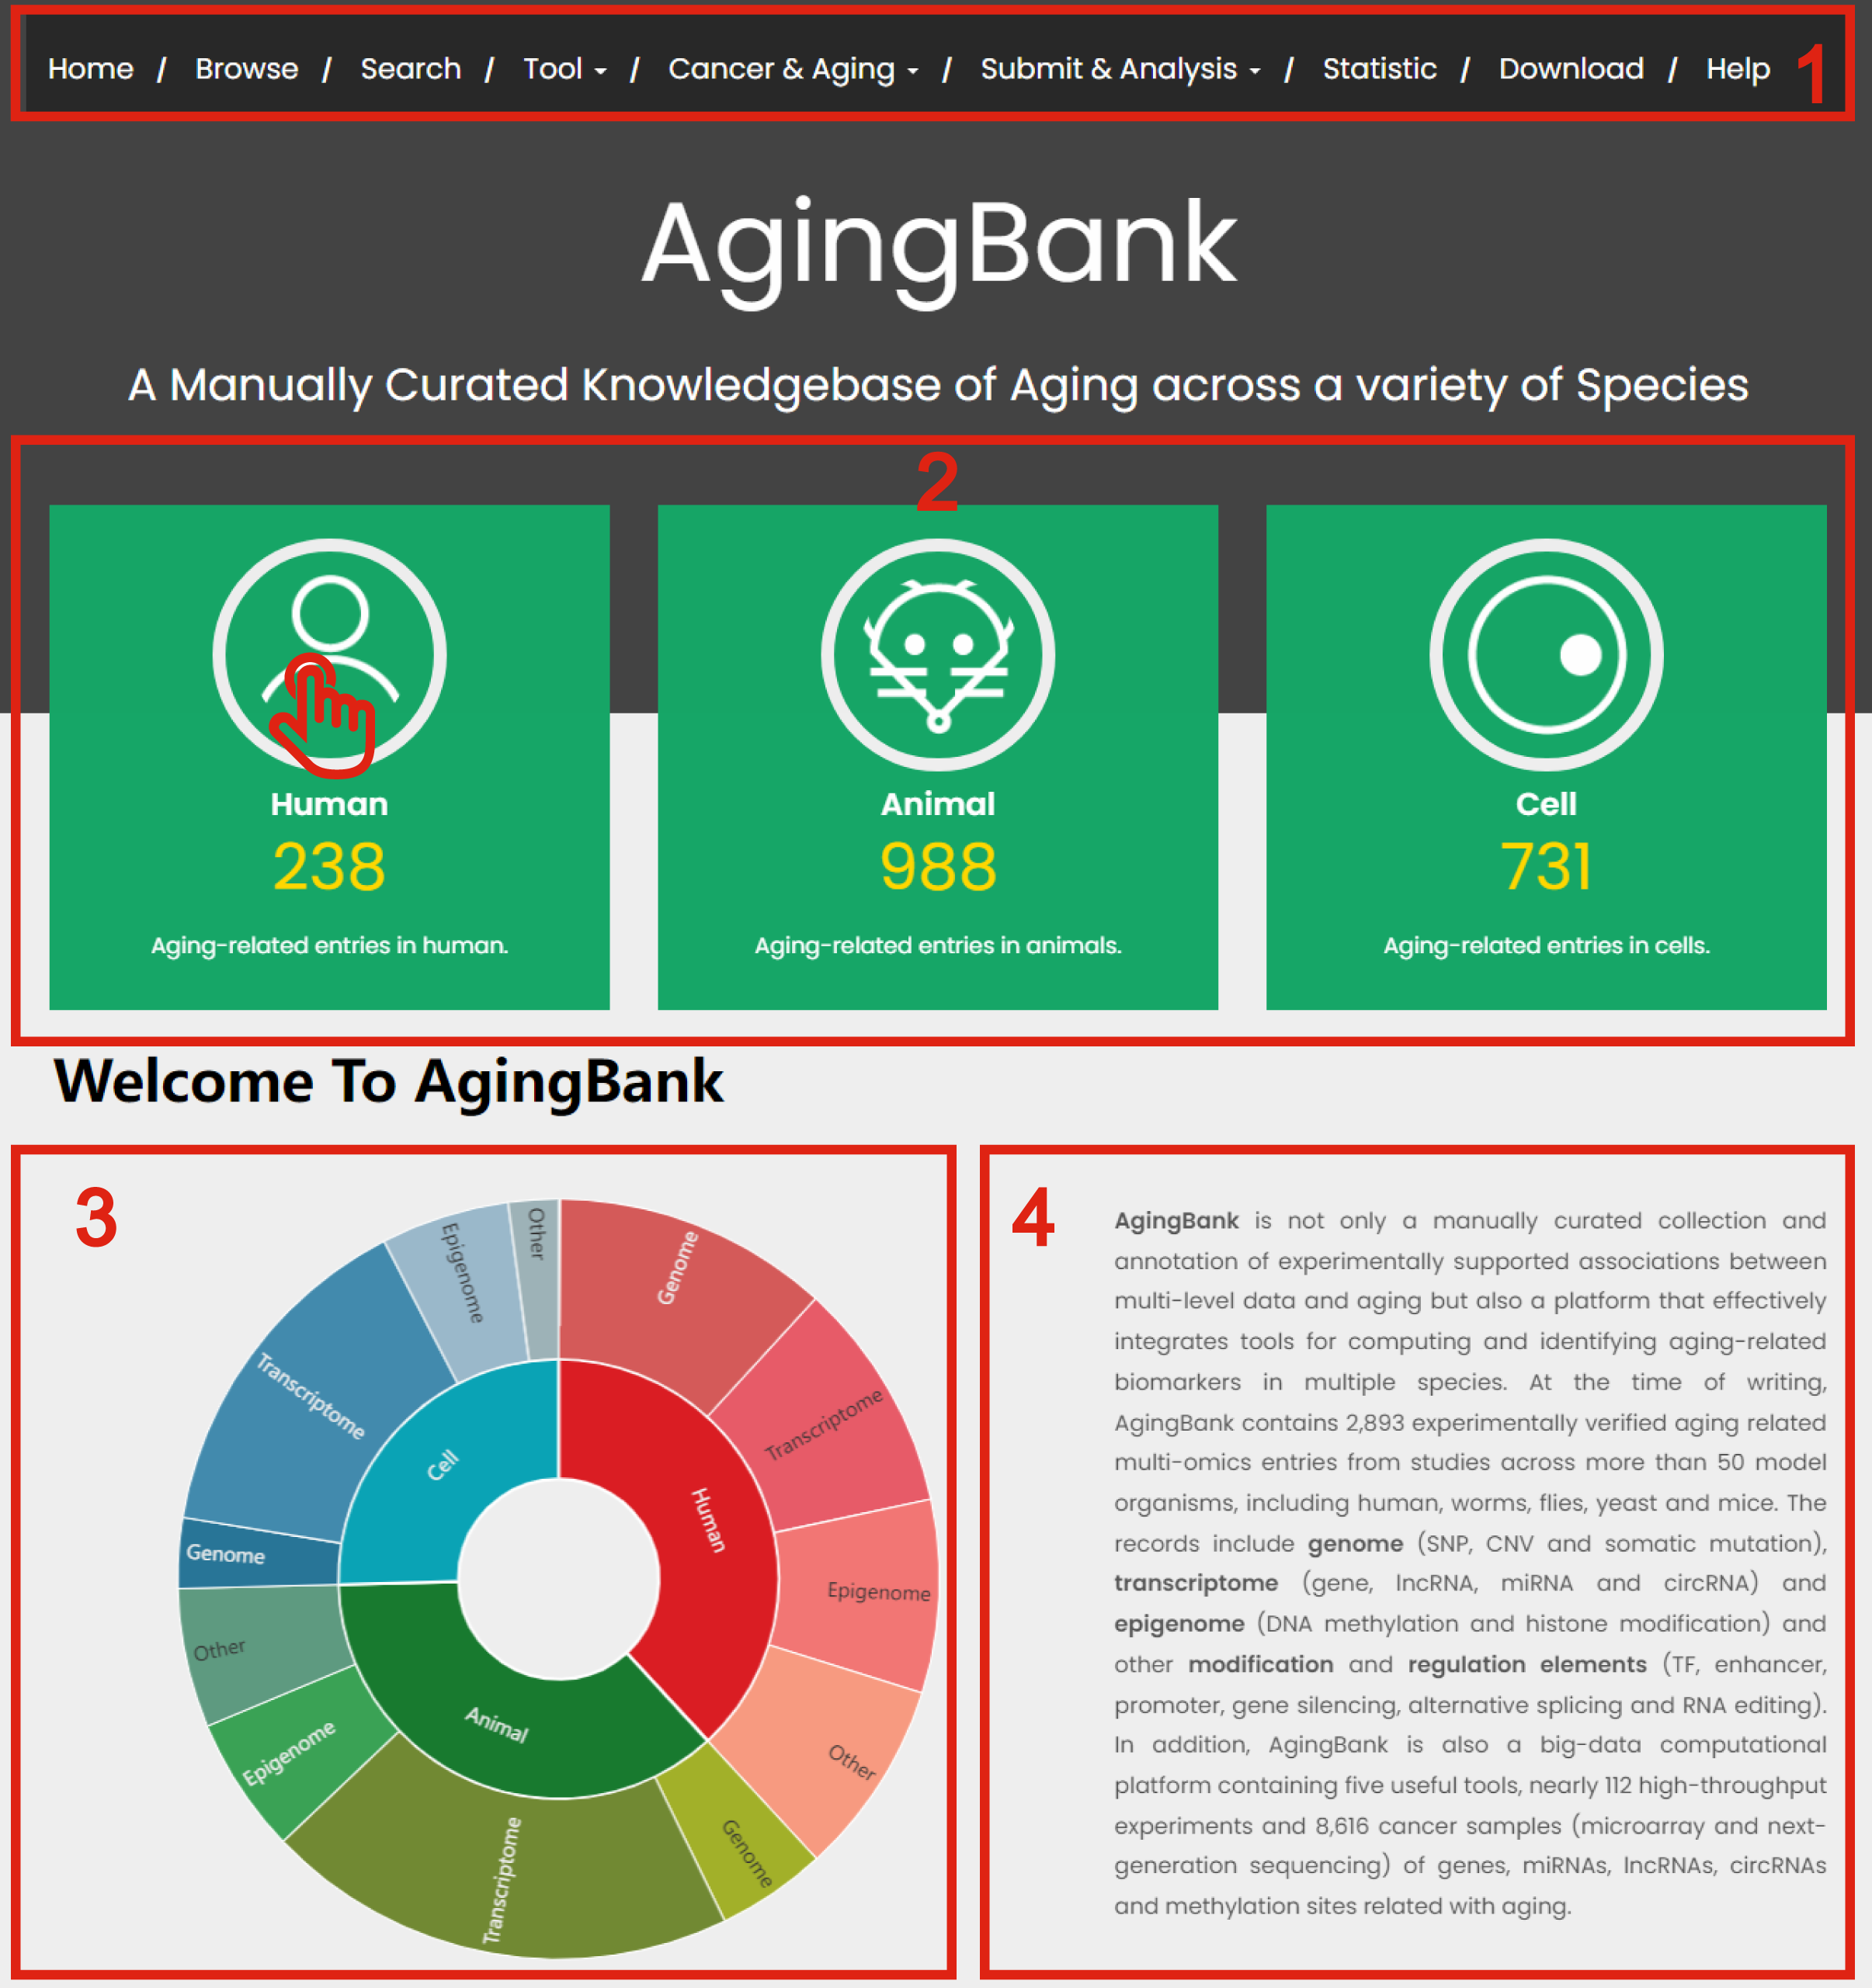
Figure 1-1
Figure 1-2
1. Quick browse and search experimentally verified data follow aging-related genome, transcriptome, epigenome and other regulatory elements.
2. Click body parts to GEO database.
3. Click body parts to TCGA database.
4. Click body parts to perform Differential Expression Analyzer module.
5. Click body parts to perform Data Heat Mapper module.
6. Click body parts to perform Co-Expression Network module.
7. Click body parts to perform Functional Annotation Analyzer module.
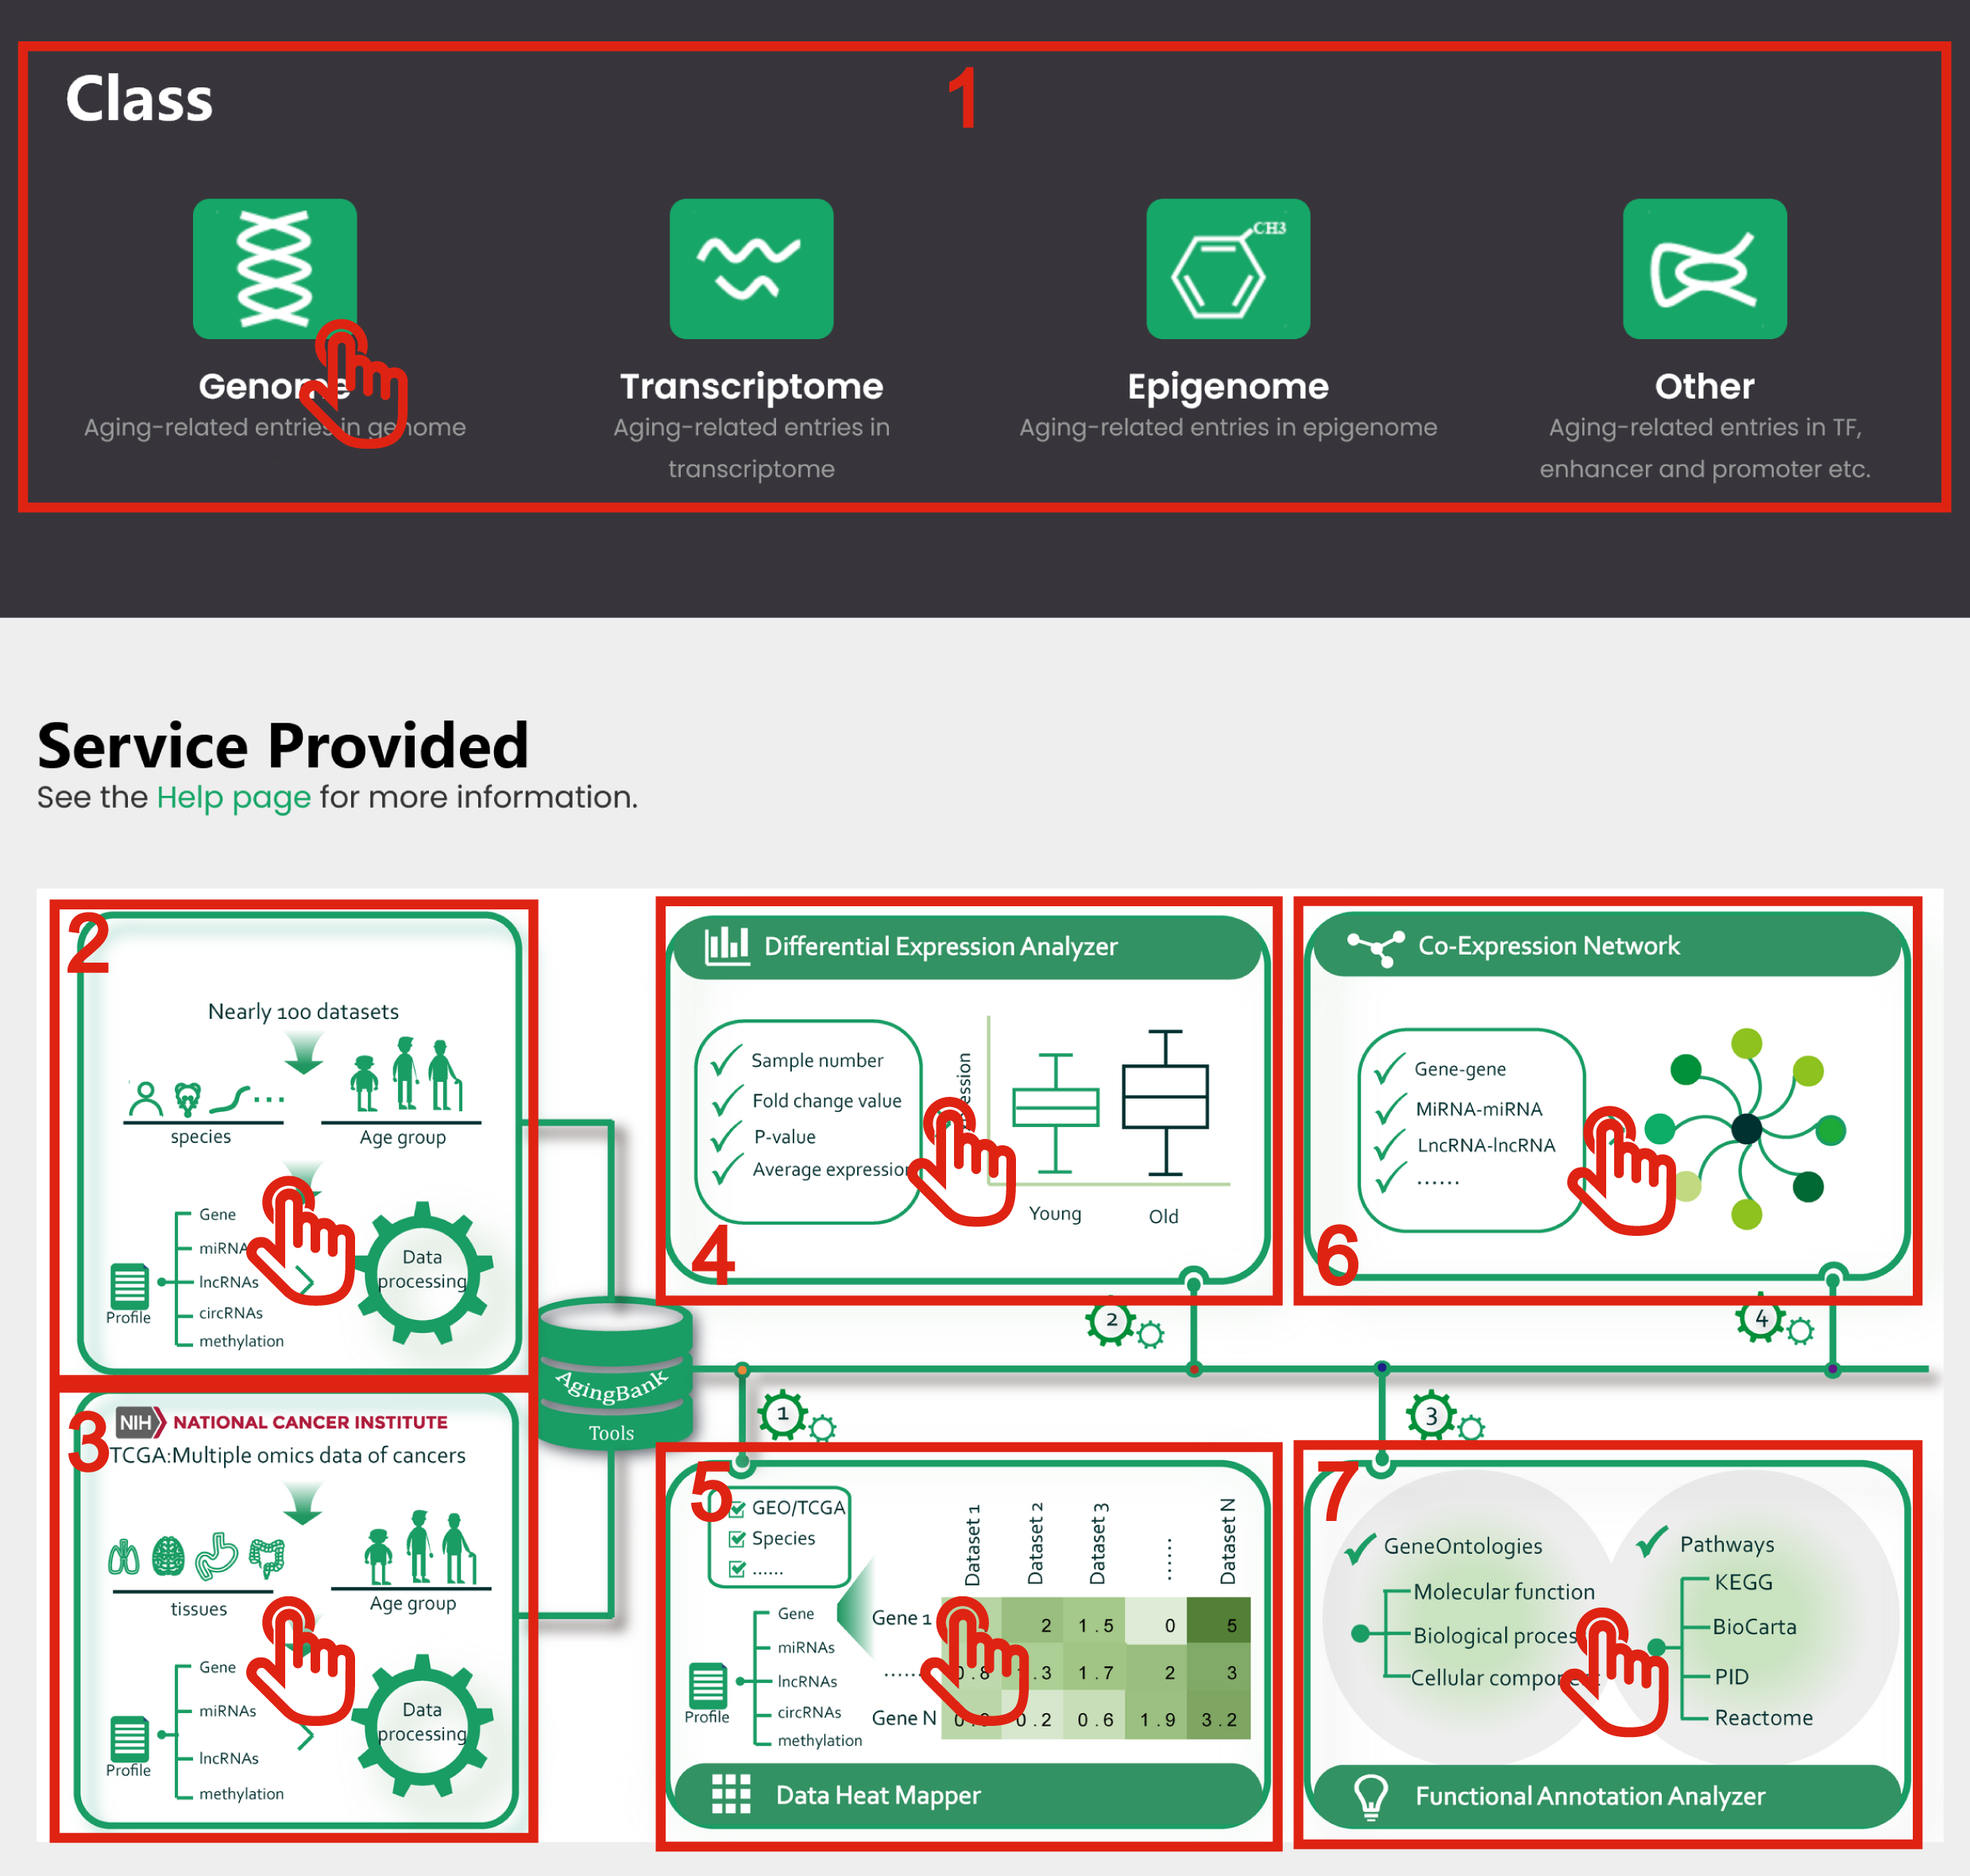
Figure 1-2
In the Browse page, there are three ways to search by aging-related experimentally verified data.
1. Input species, tissue and molecular name to search.
2. Browse and click to select the interested species or molecular type from the drop-down list on the left-hand side of the page.
3. Browse and click to select the interested species and molecular type.
4. After step 1, 2 or 3, you will get the result page with the target entries.
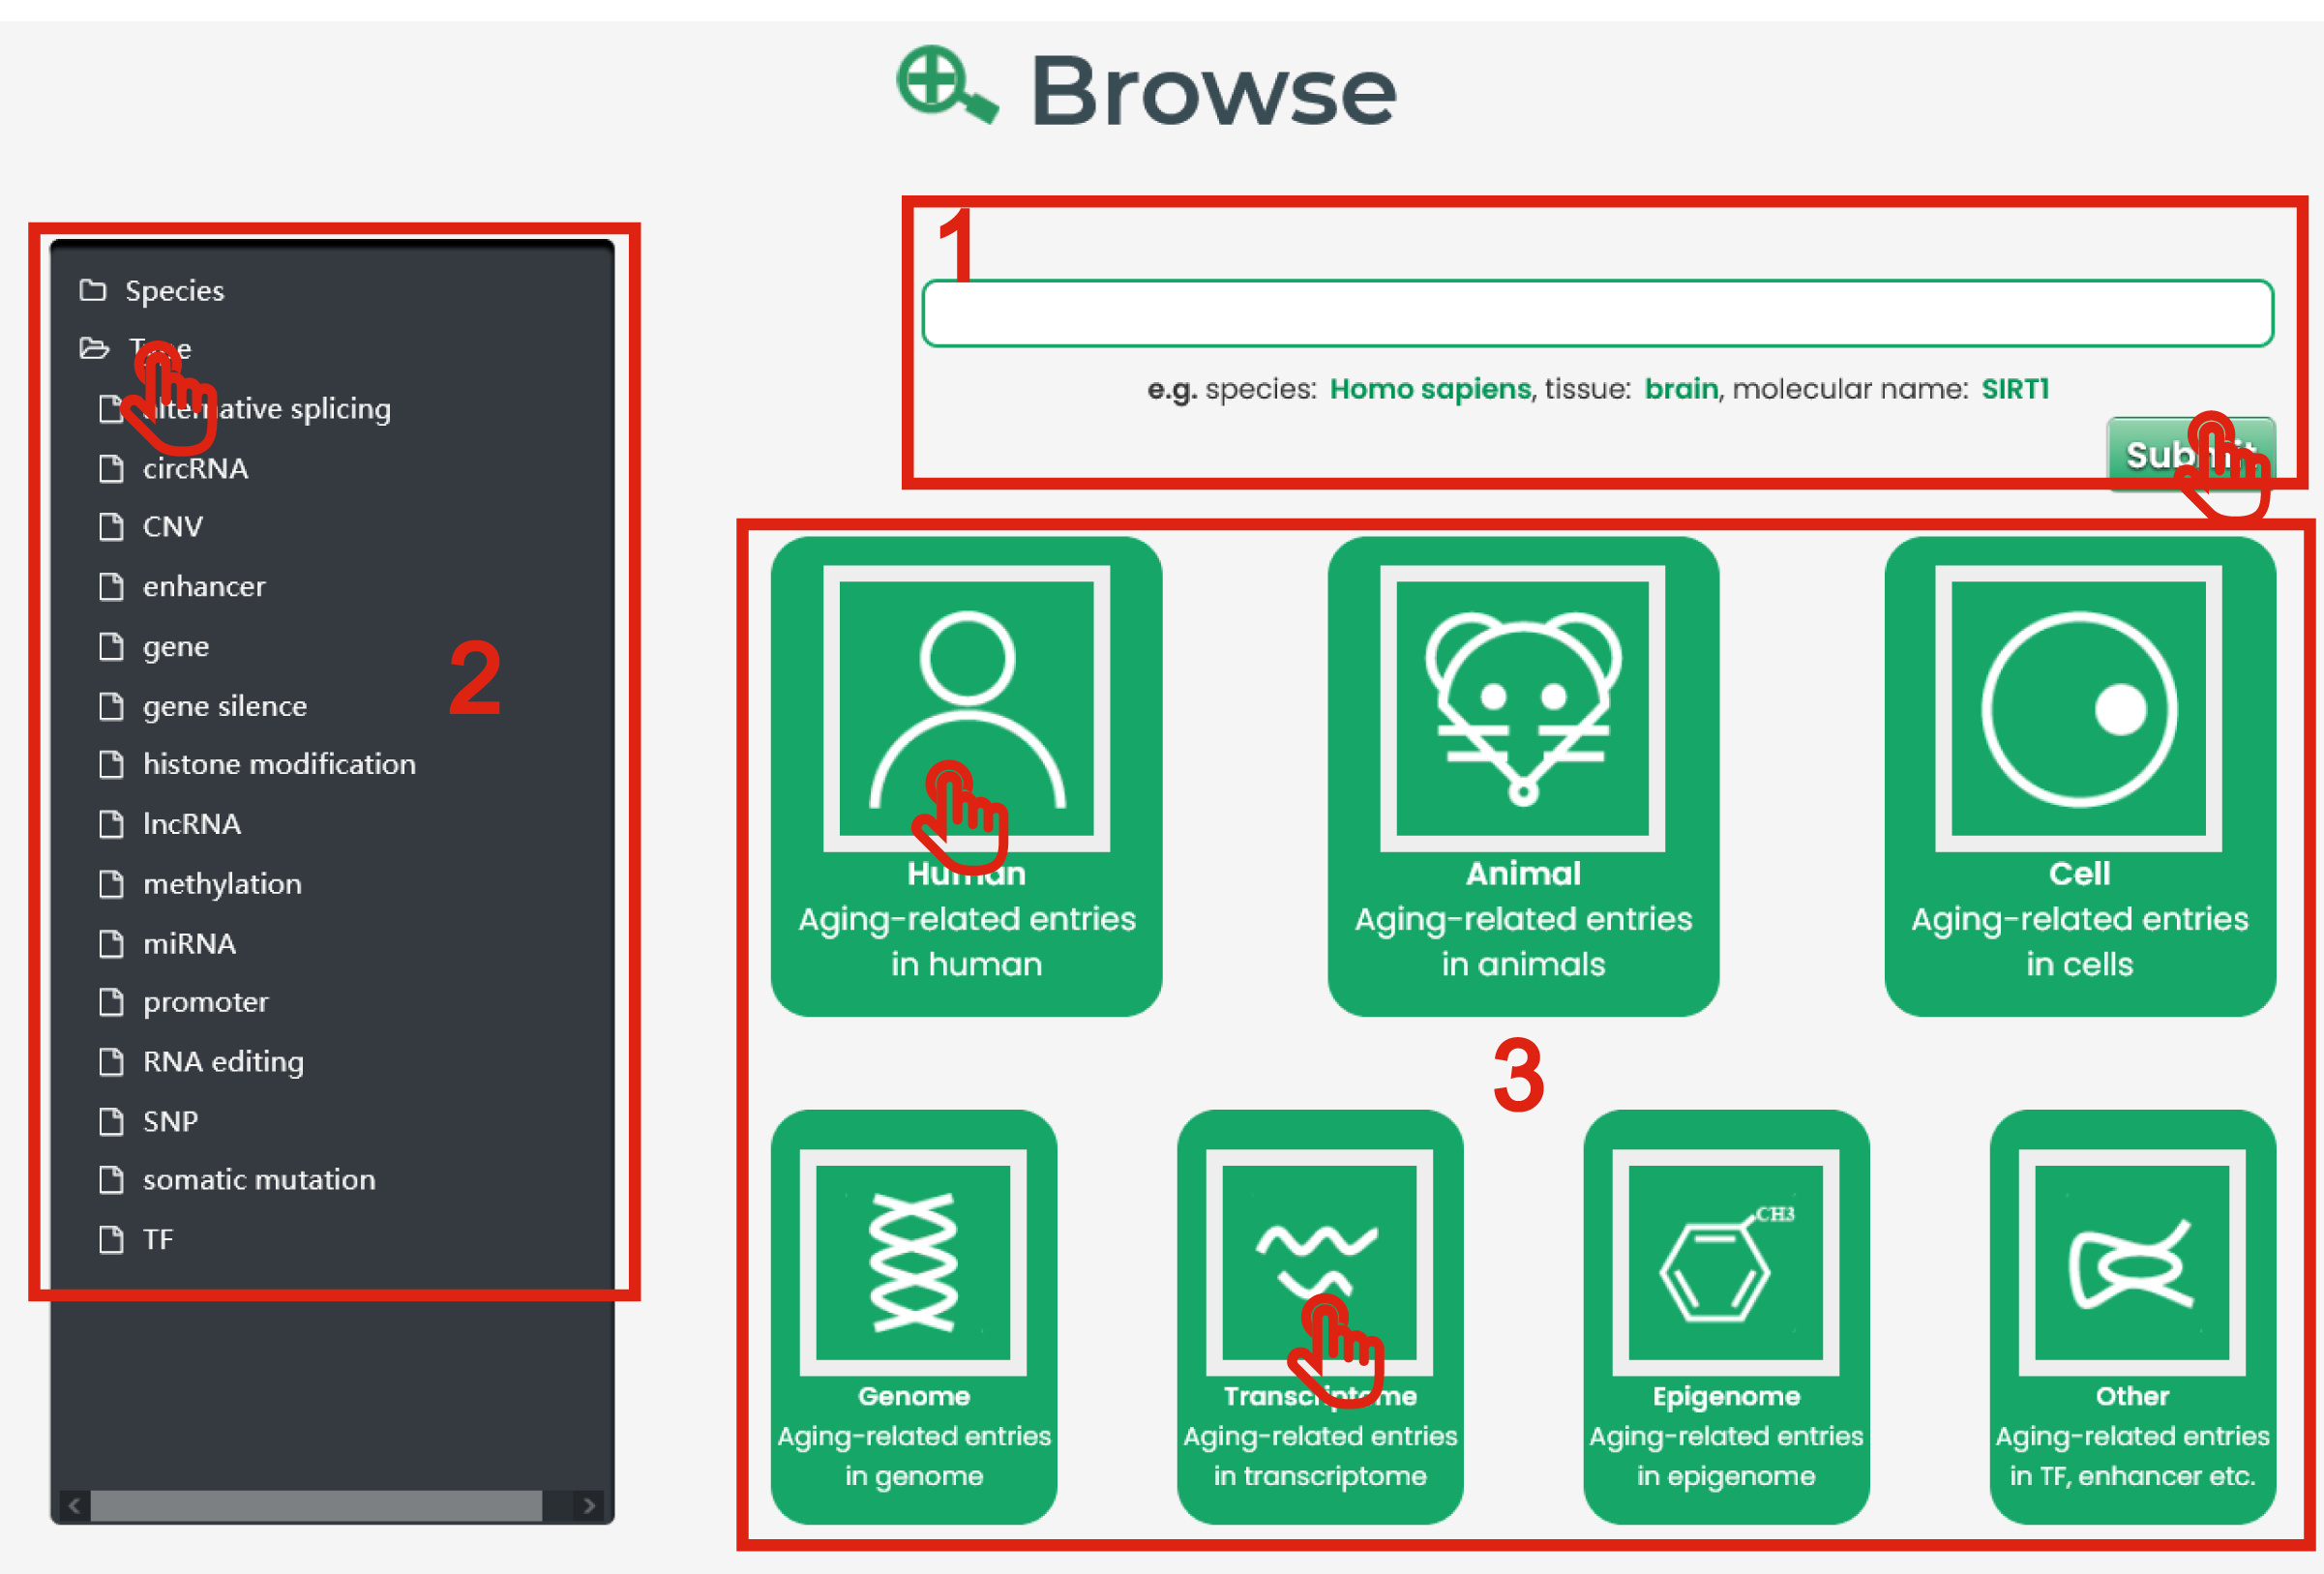
Figure 2-1
Use the Search page to enter a keyword and filter results. AgingBank provides general search and advanced search.
The general search page is displayed in Figure 3-1:
1. Users can input a molecule, species or tissue name to query.
2. AgingBank also offers fuzzy keyword searching capabilities, which enables easy searching by returning the closest possible matching records.
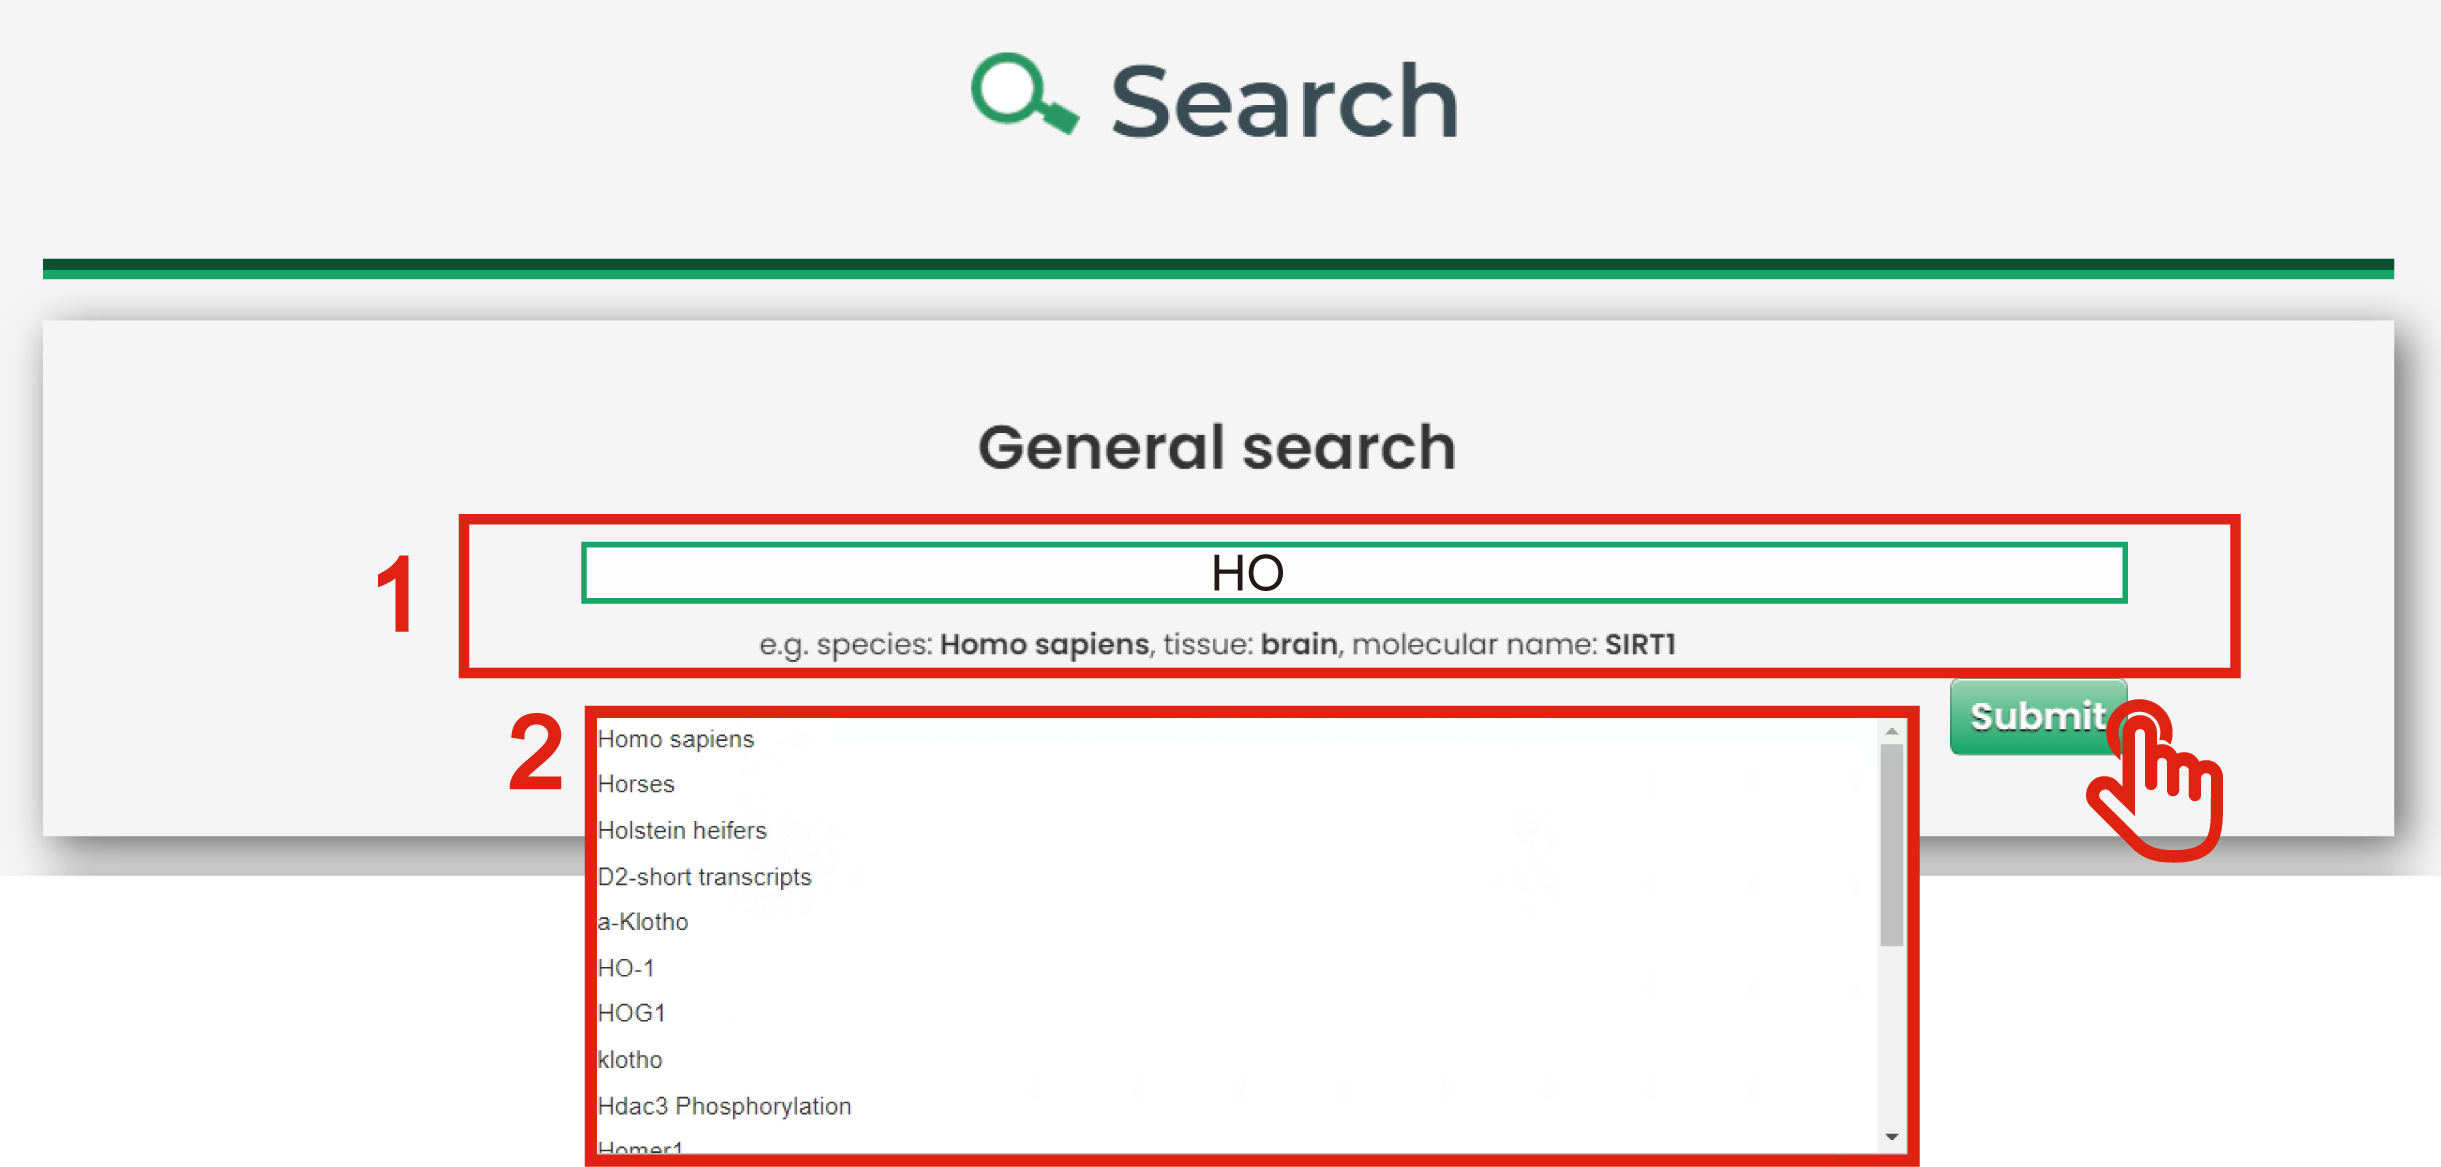
Figure 3-1
The advanced search page is displayed in Figure 3-2:
1. Input your interested species.
2. Select interested molecular types including genome (SNP, CNV and somatic mutation), transcriptome (gene, lncRNA, miRNA and circRNA) and epigenomics (DNA methylation and histone modification) and other modification and regulation elements (TF, enhancer, promoter, suppressor, gene silencing, alternative splicing and RNA editing)
3. Input interested molecular name.
4. Experiment method (RNA-seq, microarray, qPCR et al.) could filter the results.
5. Other factors including disease, environmental factor, circulating and variant could filter the results.
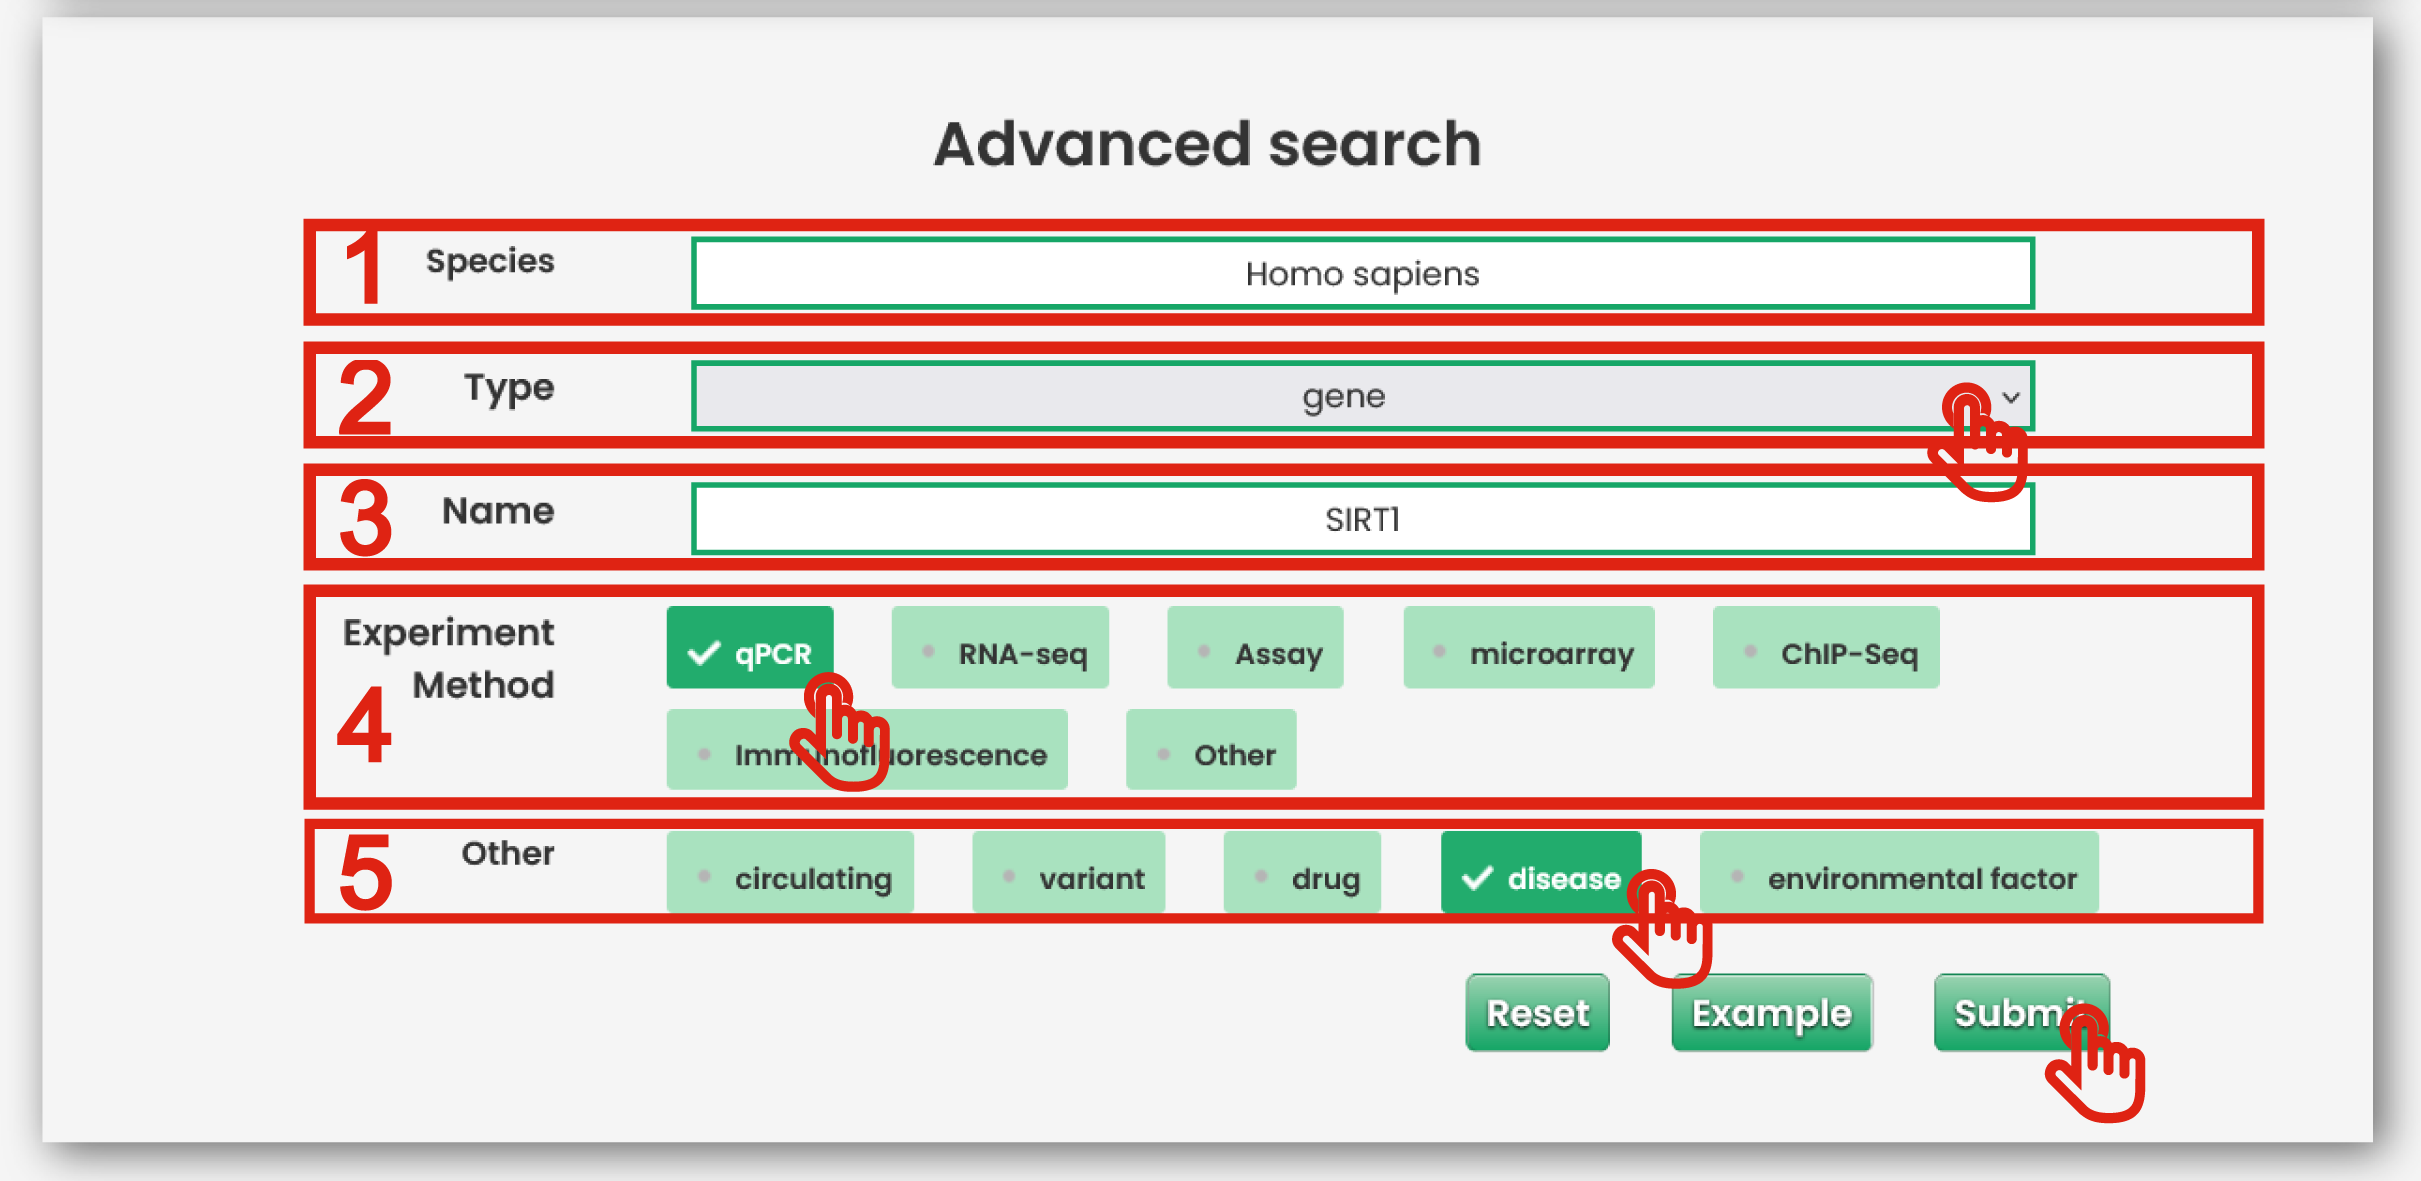
Figure 3-2
AgingBank results are organized in a data table, with a single association record on each line that contains species name, molecular type, molecular name, sample, tissue, dysregulated pattern,
the associations with aging and PubMed ID.
The result page is displayed in Figure 4
1. Click to download data.
2. Click to check the detail PubMed of the entry.
3. Click to check the detail information of the entry.
4. Users can input keywords from any column to filter the results.
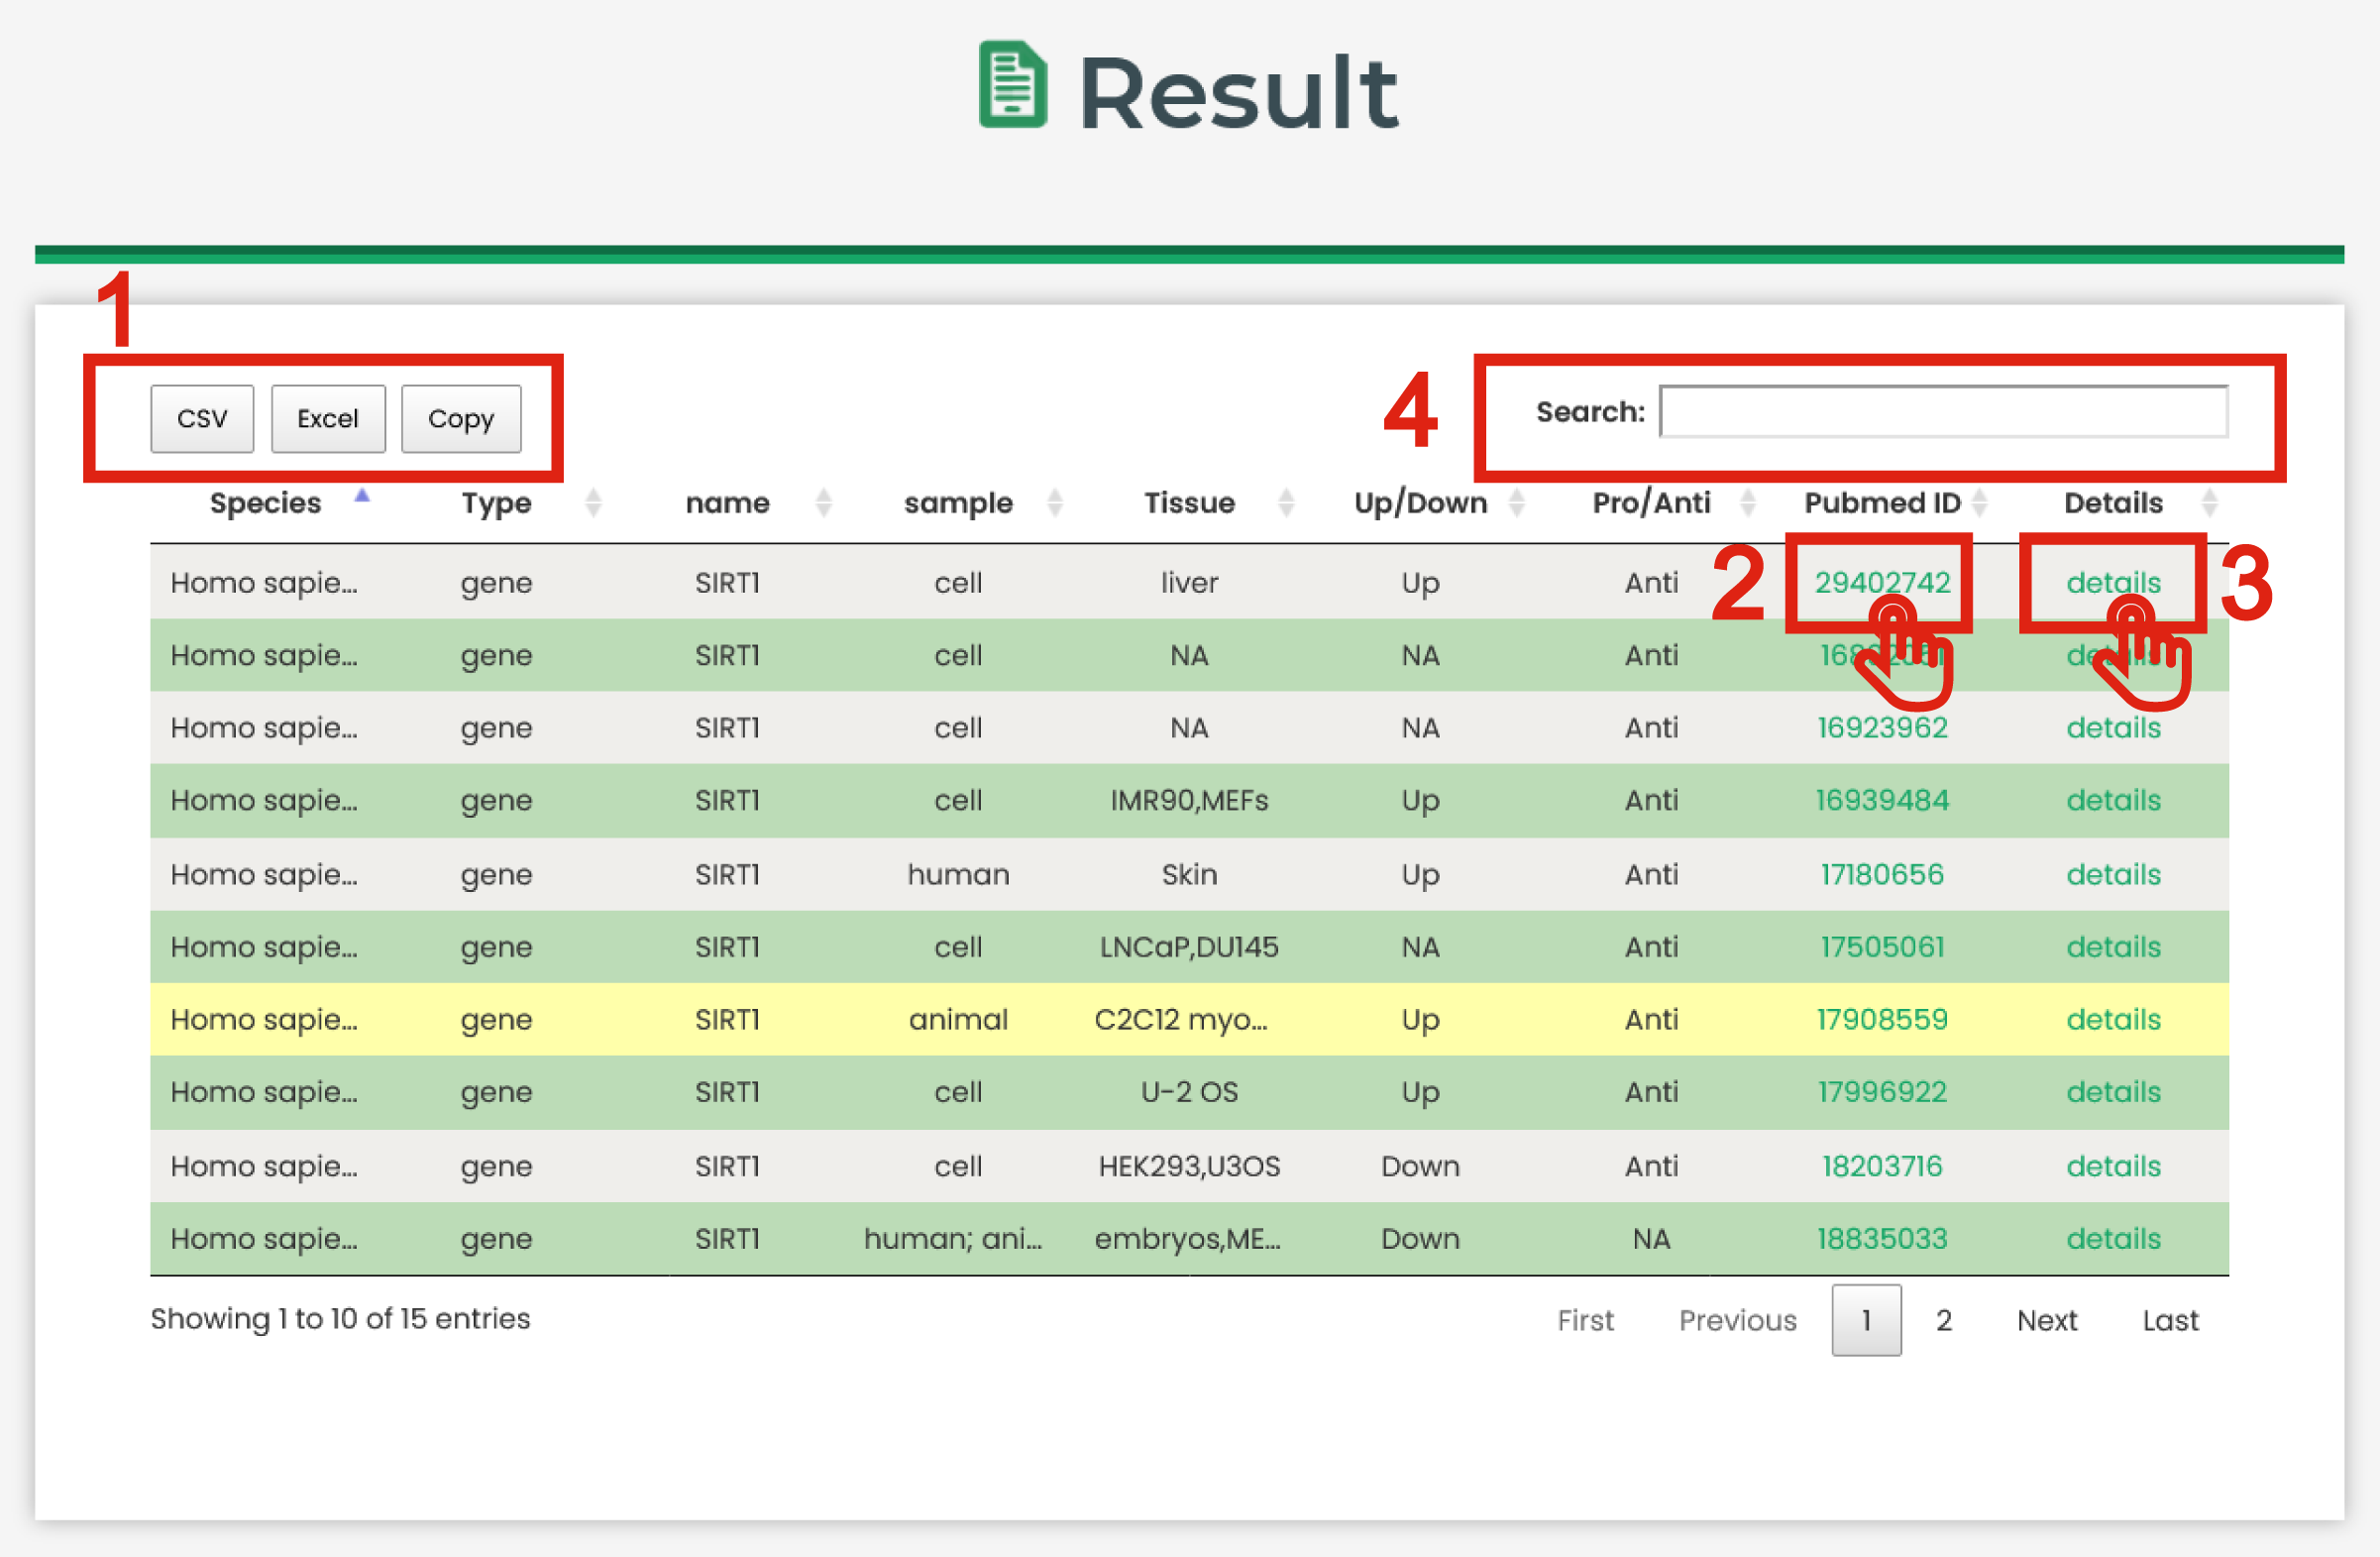
Figure 4
Detailed information of a specific molecule-aging association is displayed in Figure 5
1. The basic information for aging-related entries.
2. The Pubmed information for aging-related entries.
3. The other information for aging-related entries.
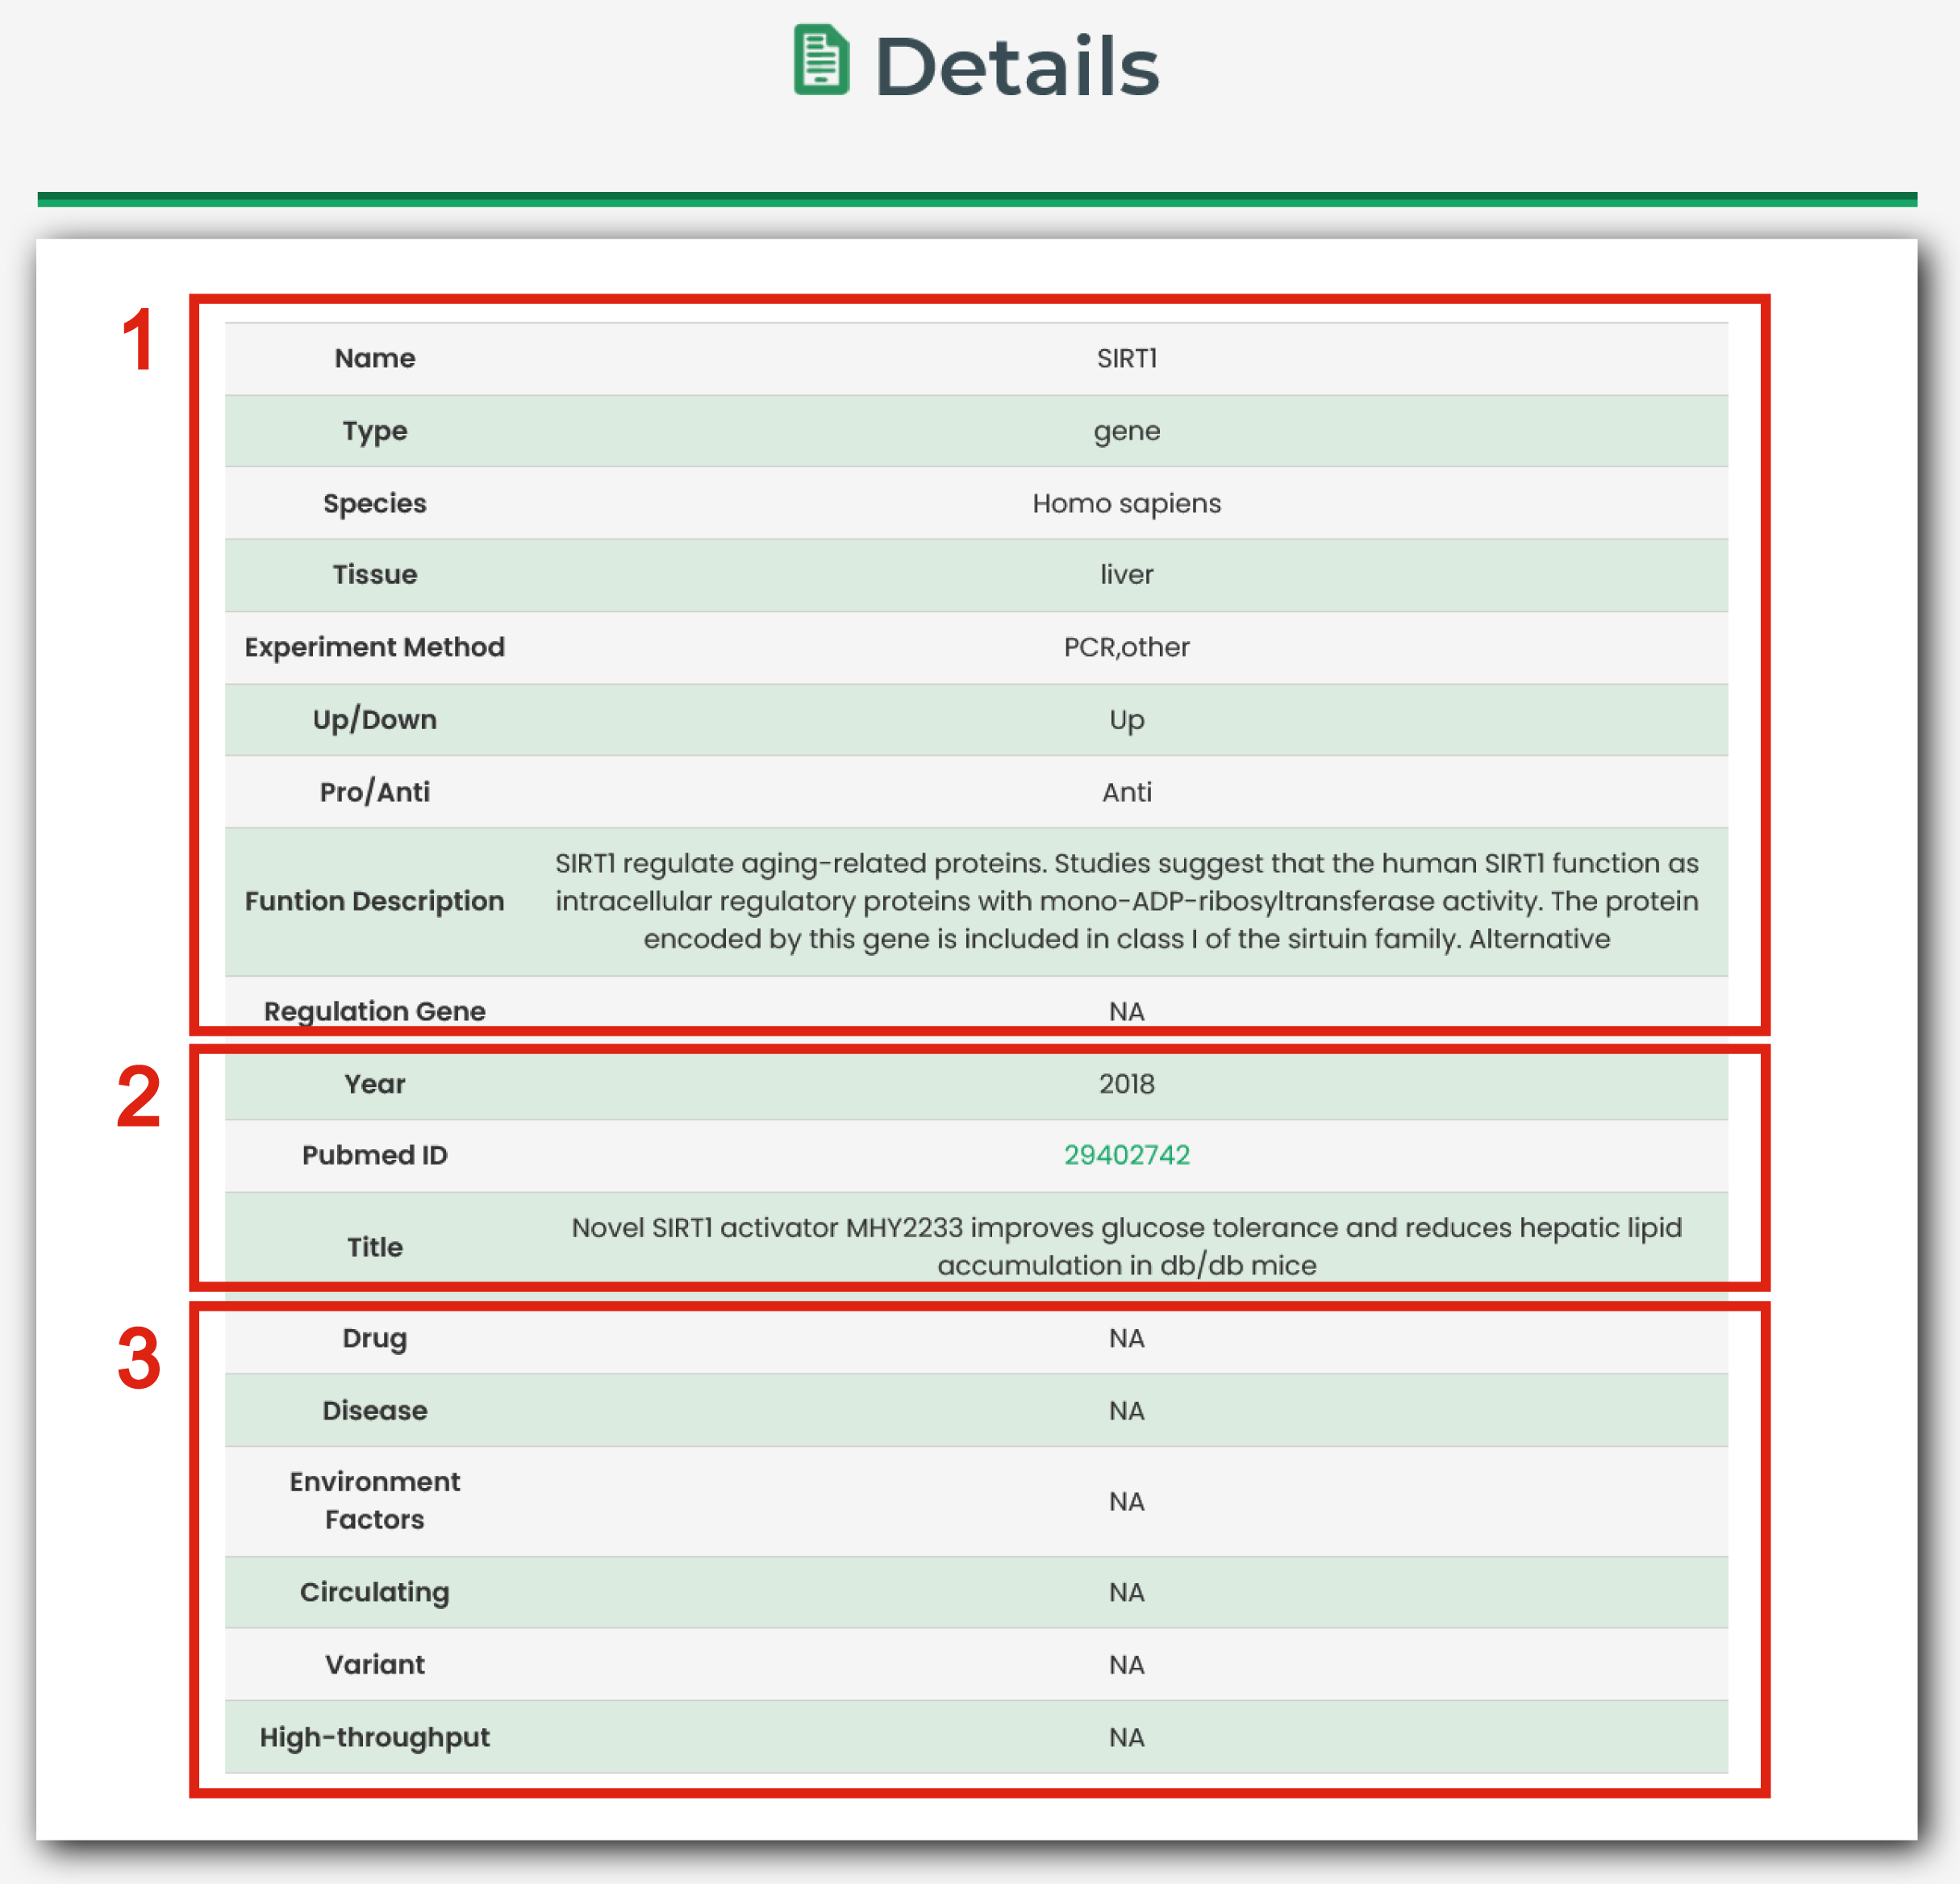
Figure 5
6.1. Aging Landscape
In this section, the high-throughput datasets (aging-related GEO datasets) were used to understand the whole landscape of a specific molecule.
The Aging Landscape page of Tool is displayed in Figure 6-1:
1. You could extract the species which interest you.
2. Put the gene, miRNA, lncRNA and methylation which interest you.
3. The aging landscape graph for a specific molecule in all datasets.
4. The plot shows the P-values of differential expression for interested molecules in each aging-associated profiles. You could understand the whole landscape of a specific molecule in all the aging-associated datasets.
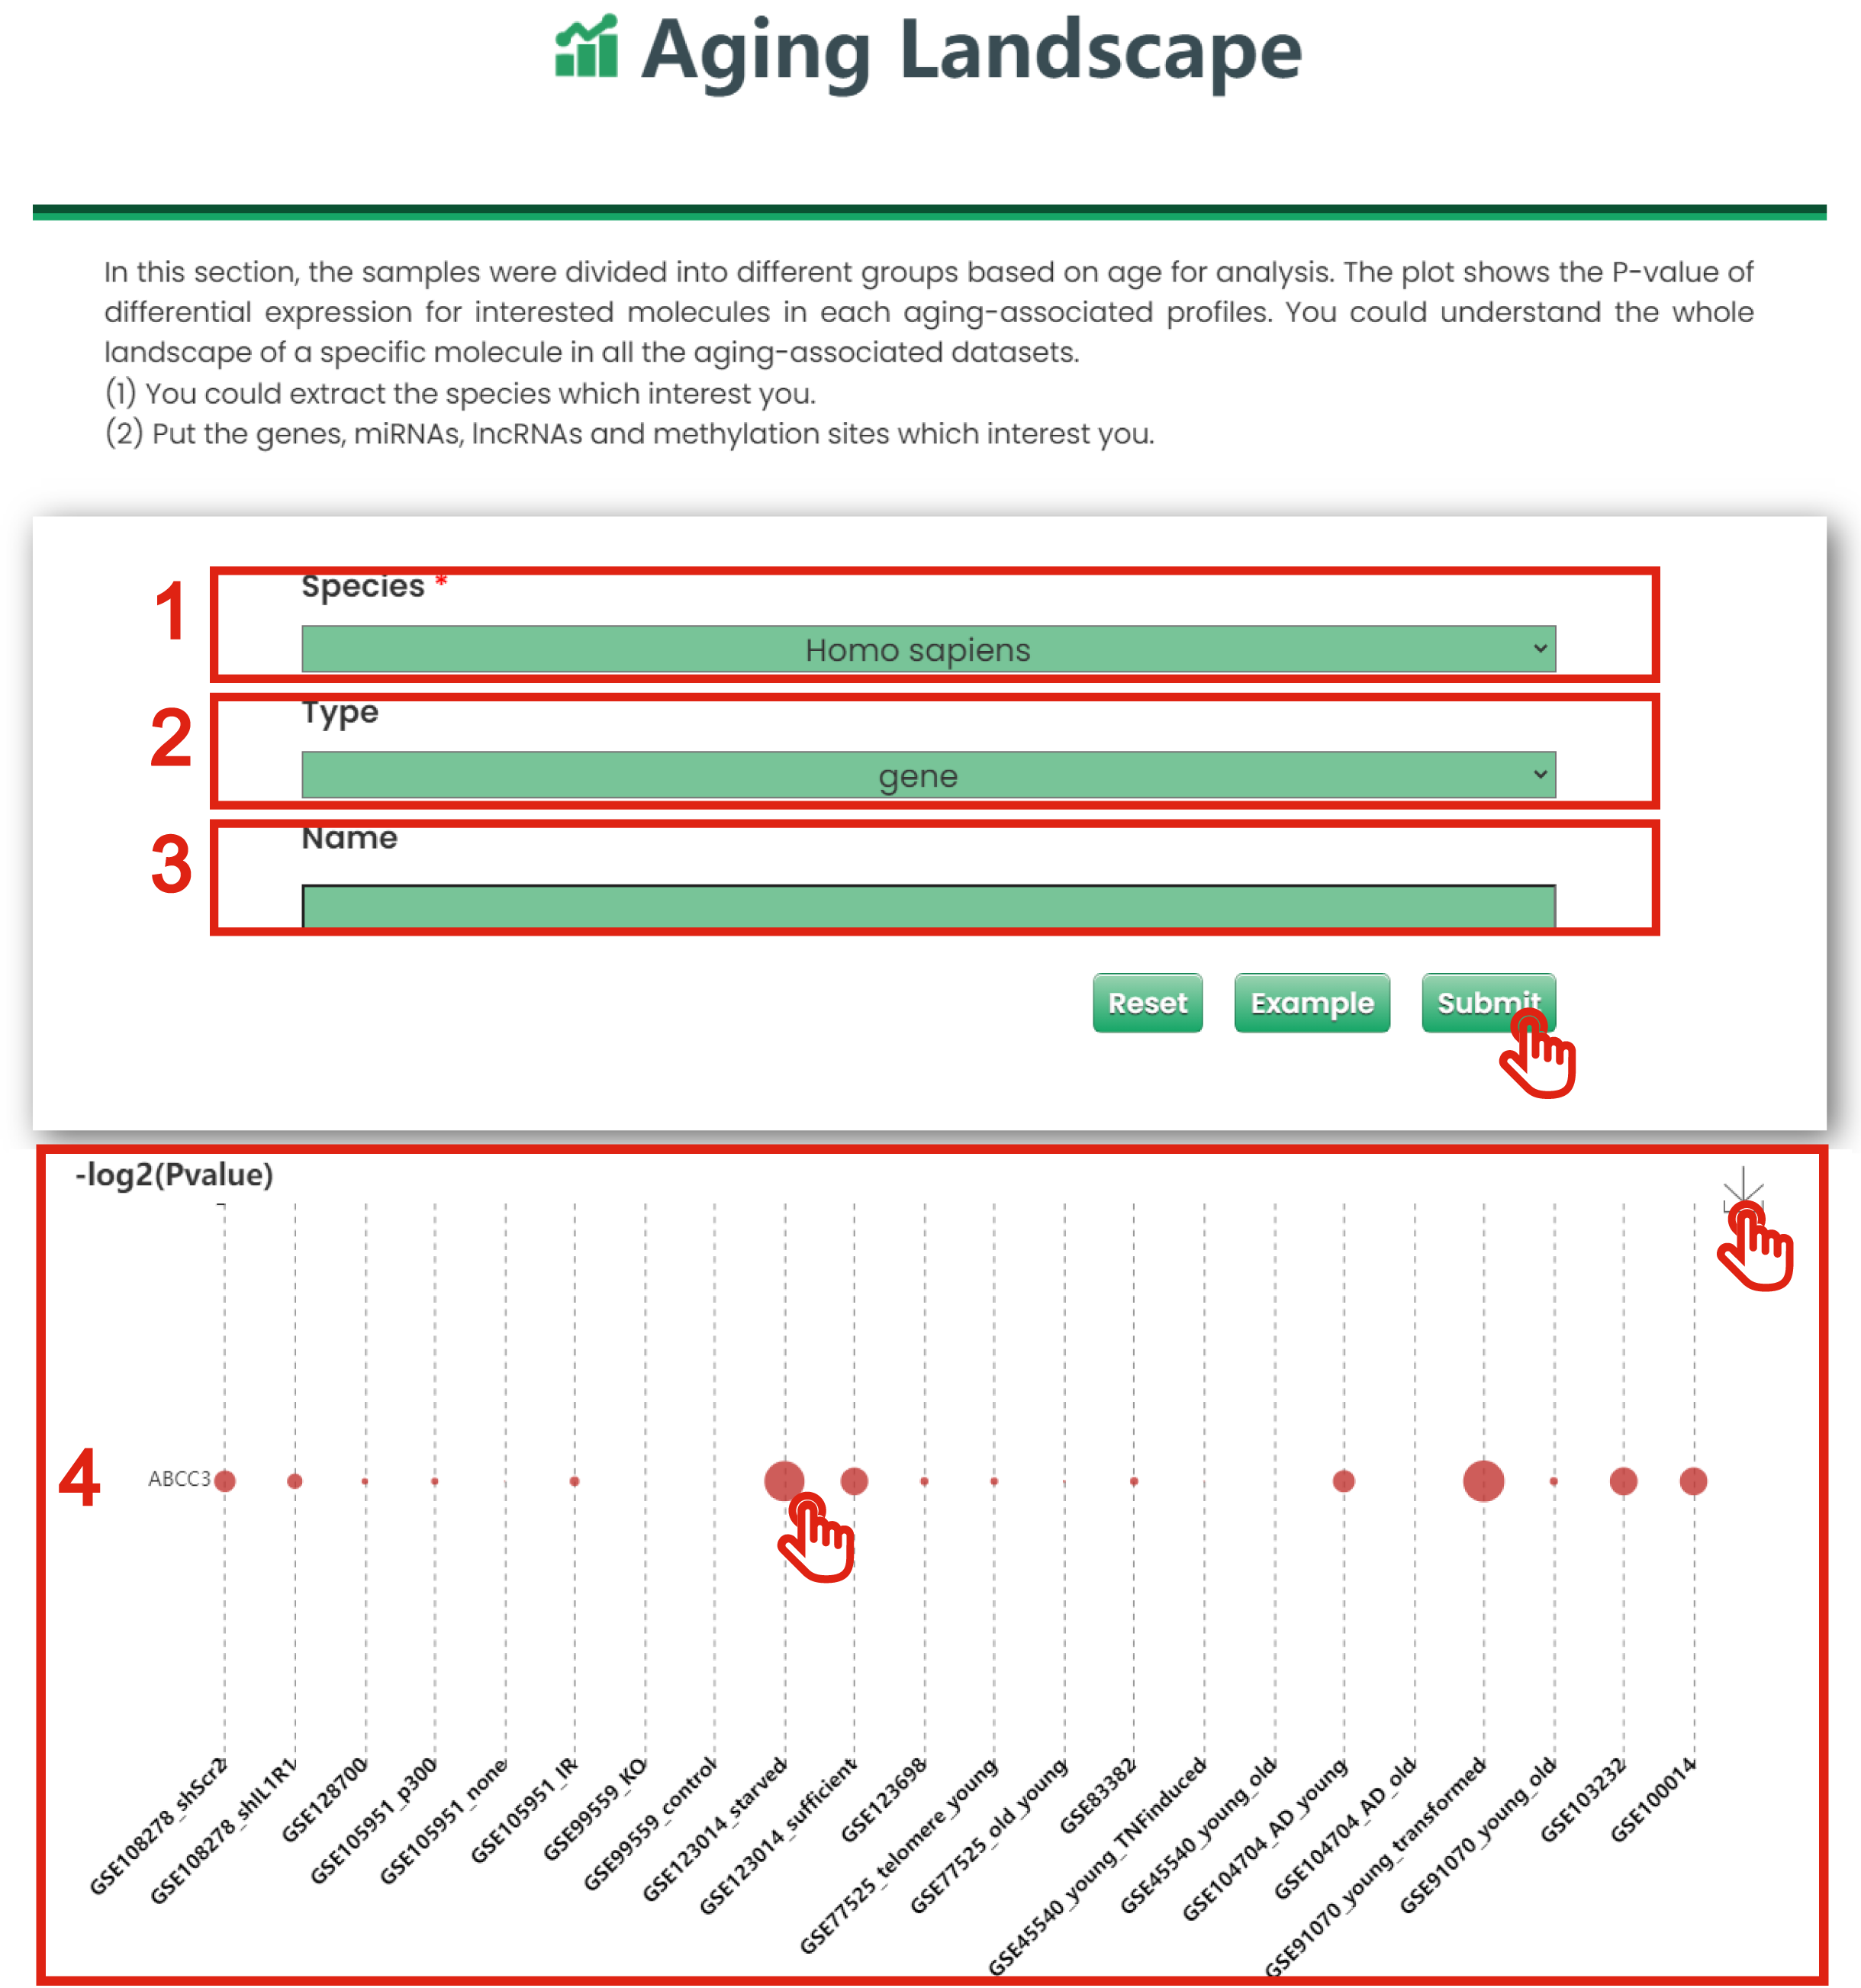
Figure 6-1
6.2. Differential Expression Analyzer
In this section, you could identify the differential expression pattern for your interested genes, miRNAs, lncRNAs and methylation sites in aging-related GEO datasets.
The Differential Expression Analyzer page of Tool is displayed in Figure 6-2:
1. You could extract the species which interest you.
2. You could extract what you are interested in from existing tissue and type.
3. You could extract what you are interested in from existing samples.
4. You could limit interested |log2 (fold change)| or methylation difference of differential expression analysis.
5. You could limit interested P-values of differential expression analysis.
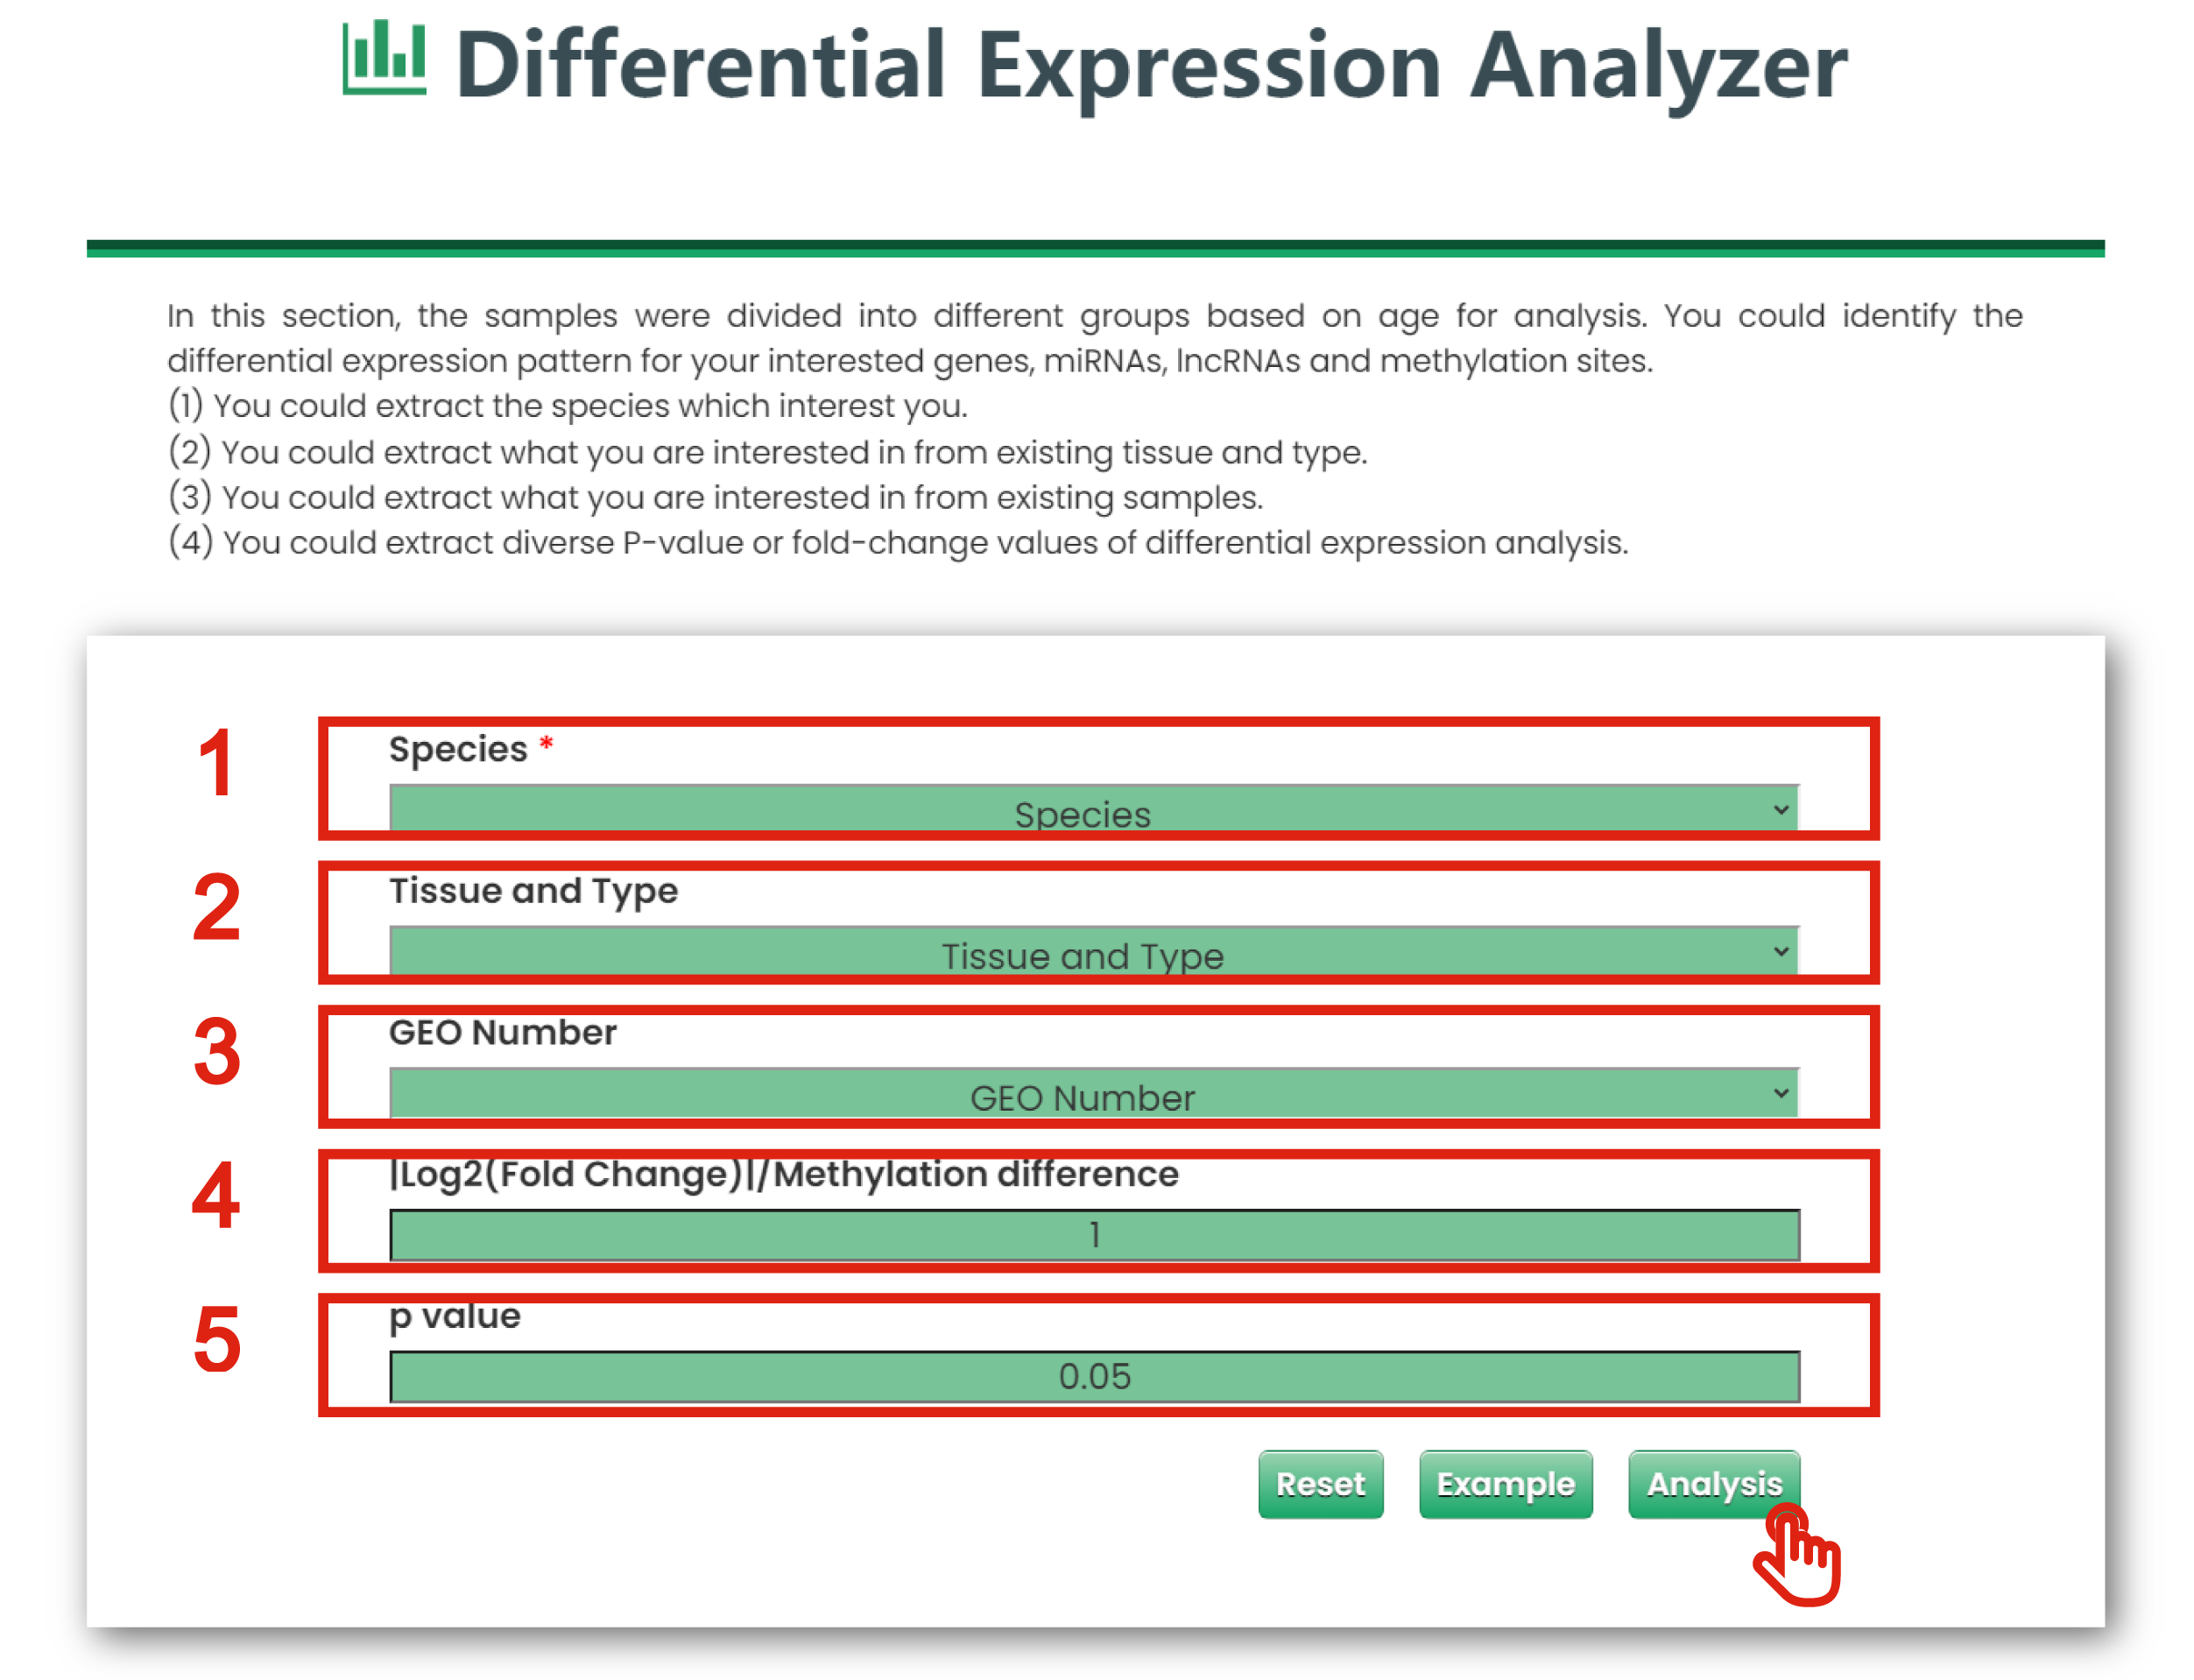
Figure 6-2
The result page is displayed in Figure 6-3:
1. Click to download data.
2. Users can input keywords from any column to filter the results.
3. Click to get a box plot graph for differential results.
4. The boxplot shows the differential expression levels of interested molecules.
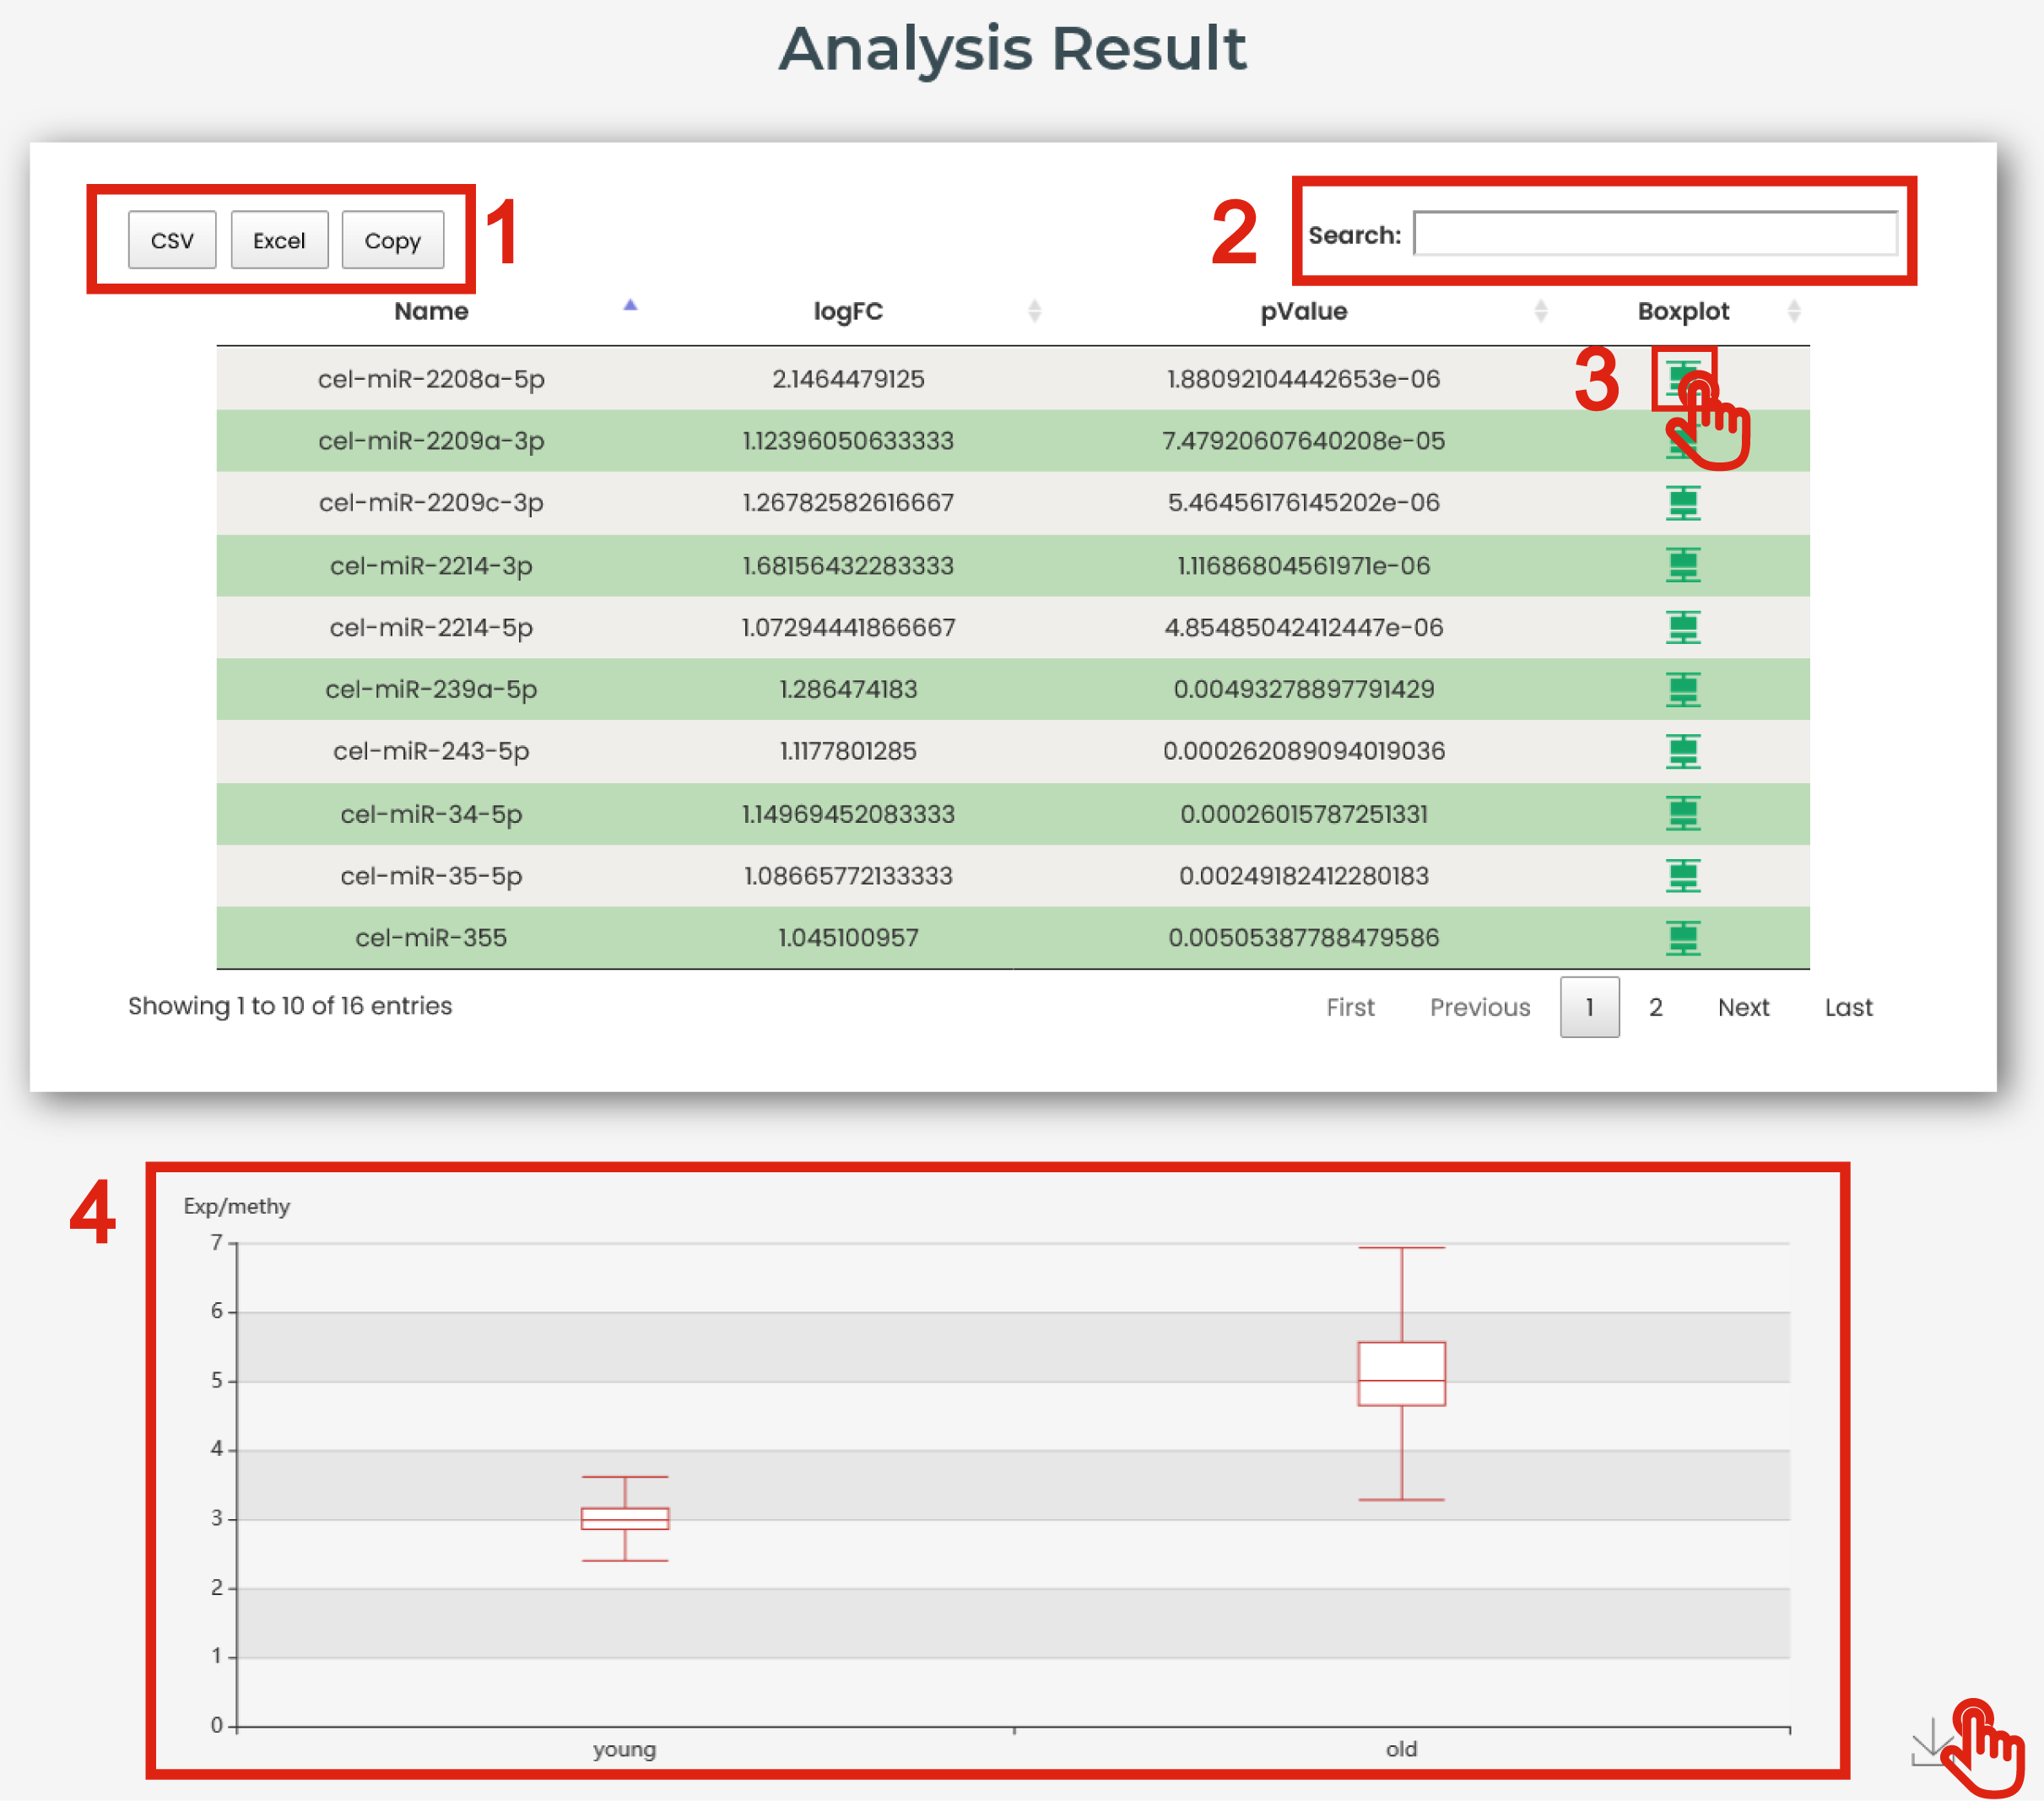
Figure 6-3
6.3. Data Heat Mapper
In this section, you will get a heatmap of the genes, miRNAs, lncRNAs and methylation sites which is related with your input based on aging-related GEO datasets.
The Data Heat Mapper page of Tool is displayed in Figure 6-4:
1. You could extract what you are interested in from existing species.
2. You could extract what you are interested in from existing tissue and type.
3. You could extract what you are interested in from existing samples.
4. You could limit interested |log2 (fold change)| or methylation difference.
5. You could limit interested P-values.
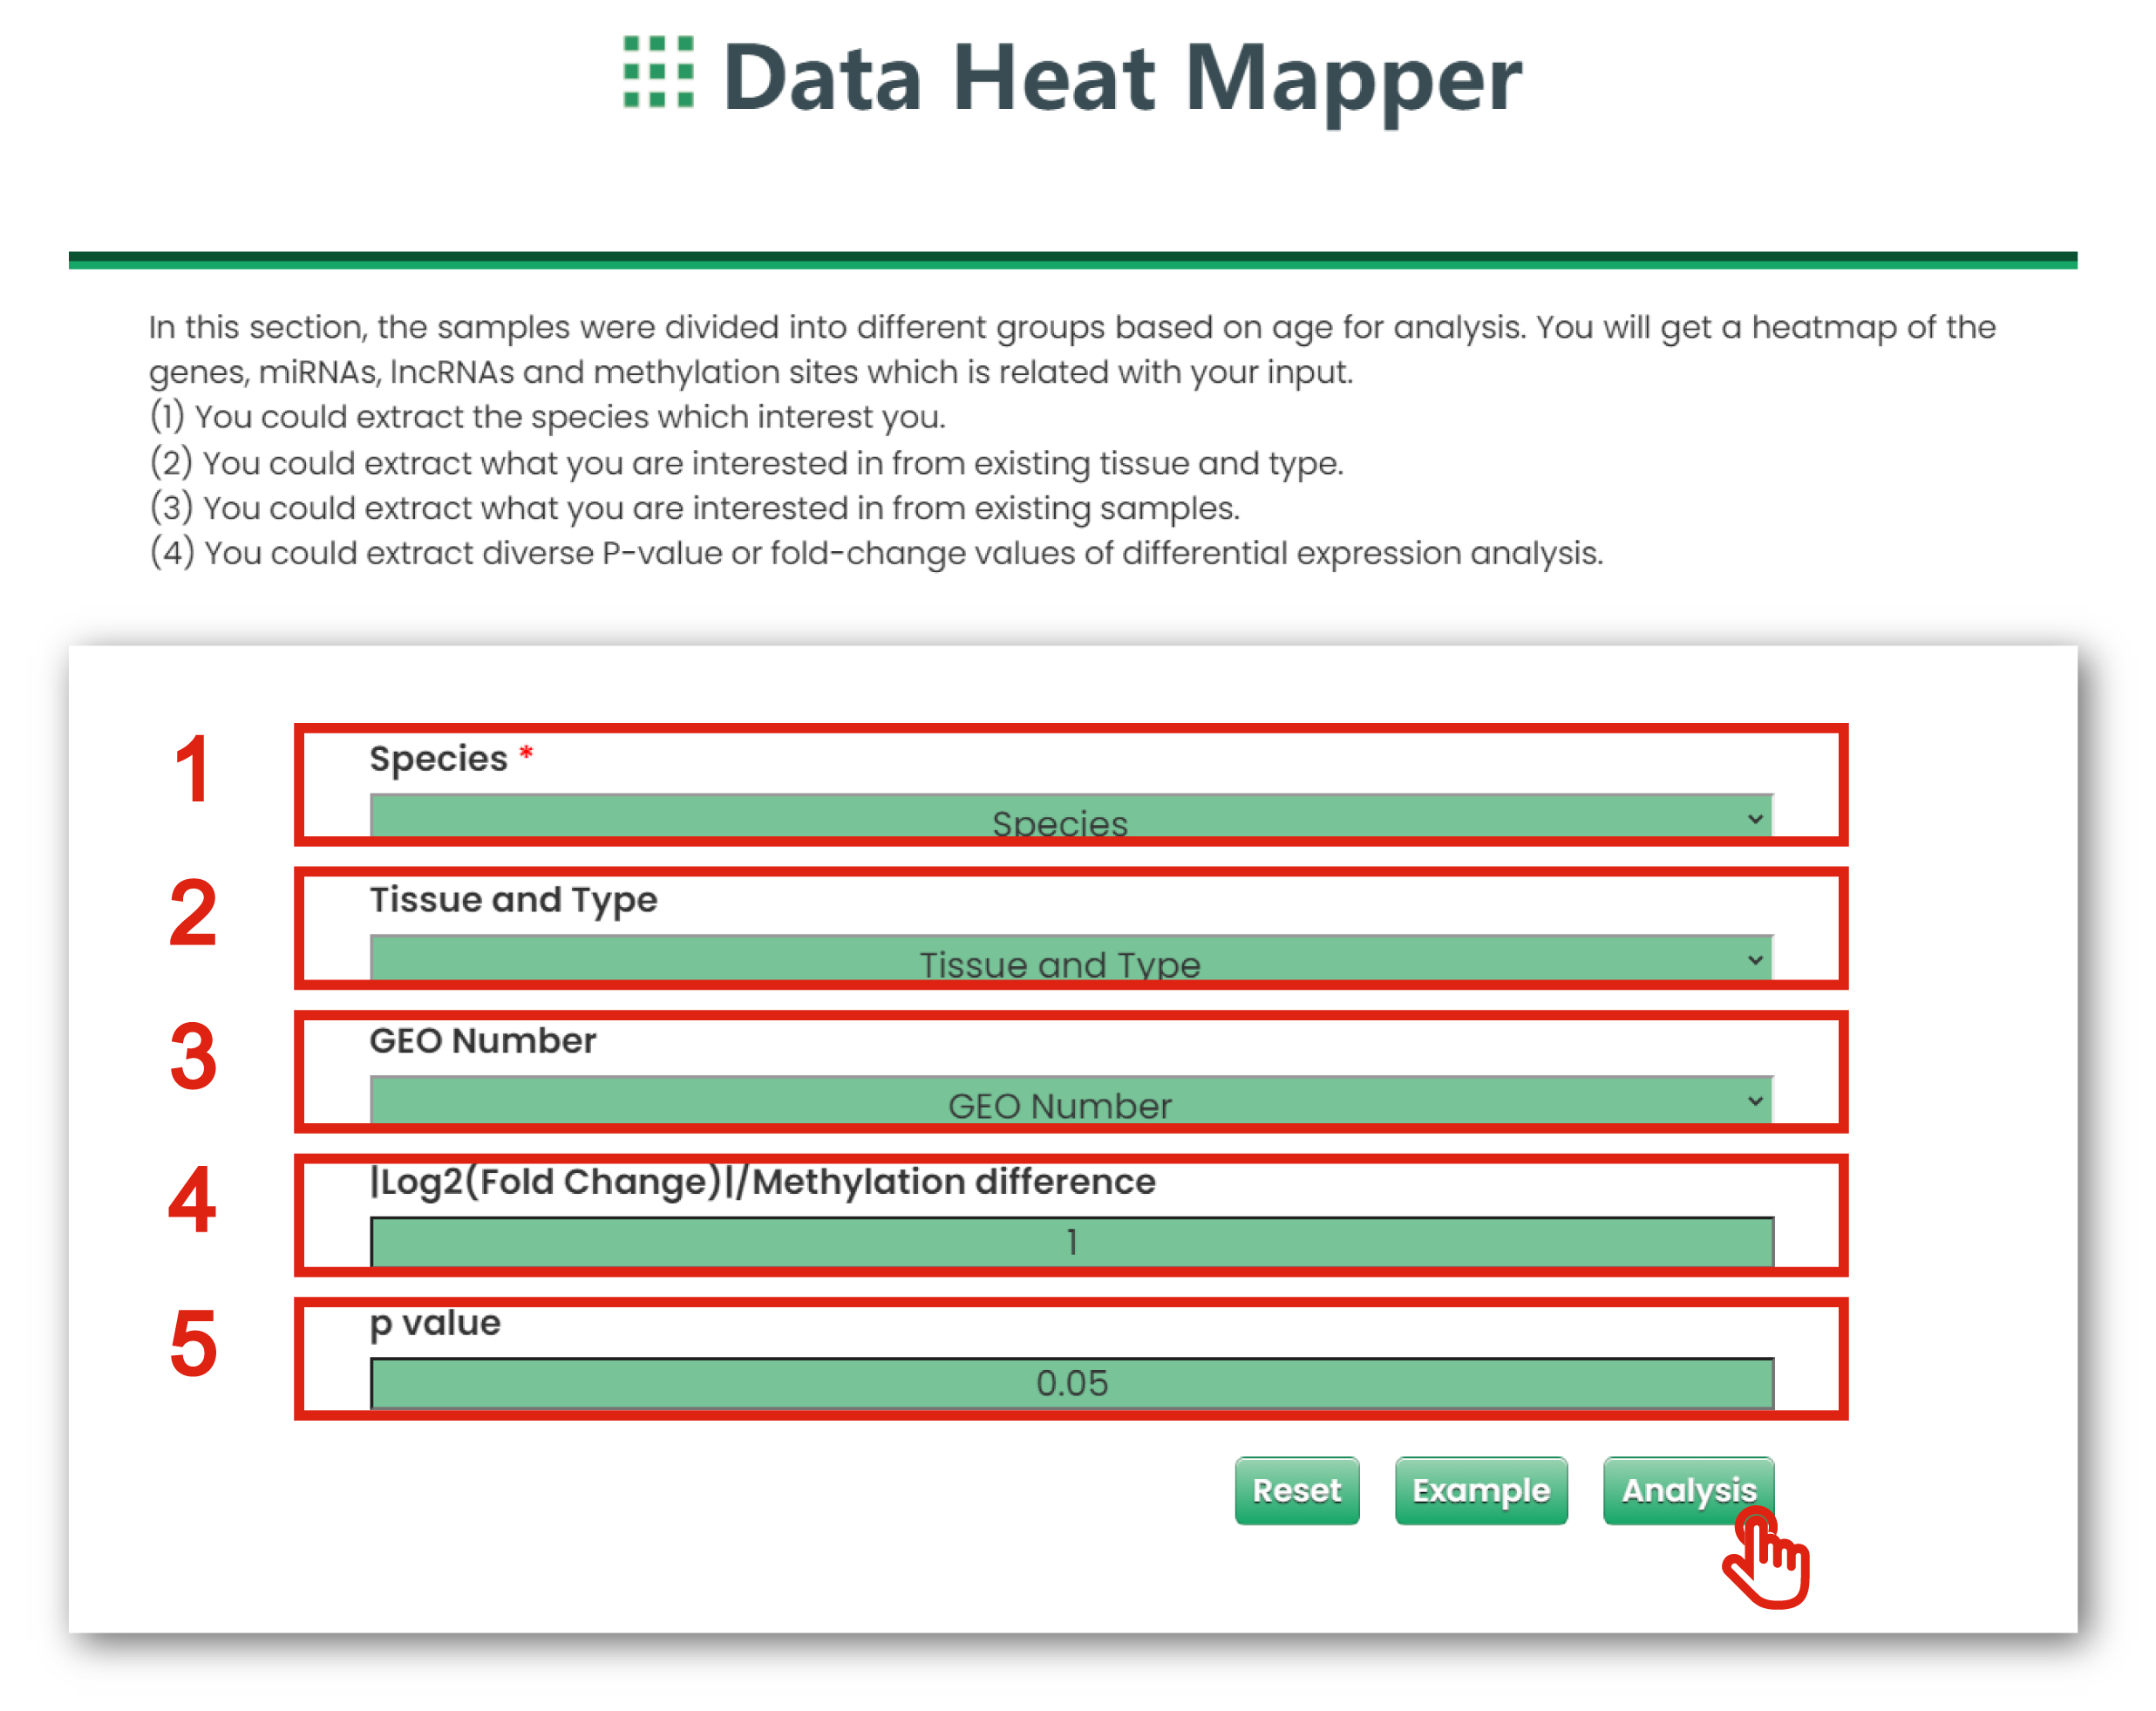
Figure 6-4
6.4. Co-Expression Network
In this section, you will get a graphic illustration of the co-expression network which is related with your input based on aging-related GEO datasets.
The Co-Expression Network page of Tool is displayed in Figure 6-5:
1. You could extract what you are interested in from existing species.
2. You could extract what you are interested in from existing tissue and type.
3. You could extract what you are interested in from existing samples.
4. You could get a table for all interested molecule.
5. You could extract diverse correlation coefficient of correlation analysis.
6. You could extract diverse P-values of correlation analysis.
7. The plot shows the co-expression network of interested molecule.
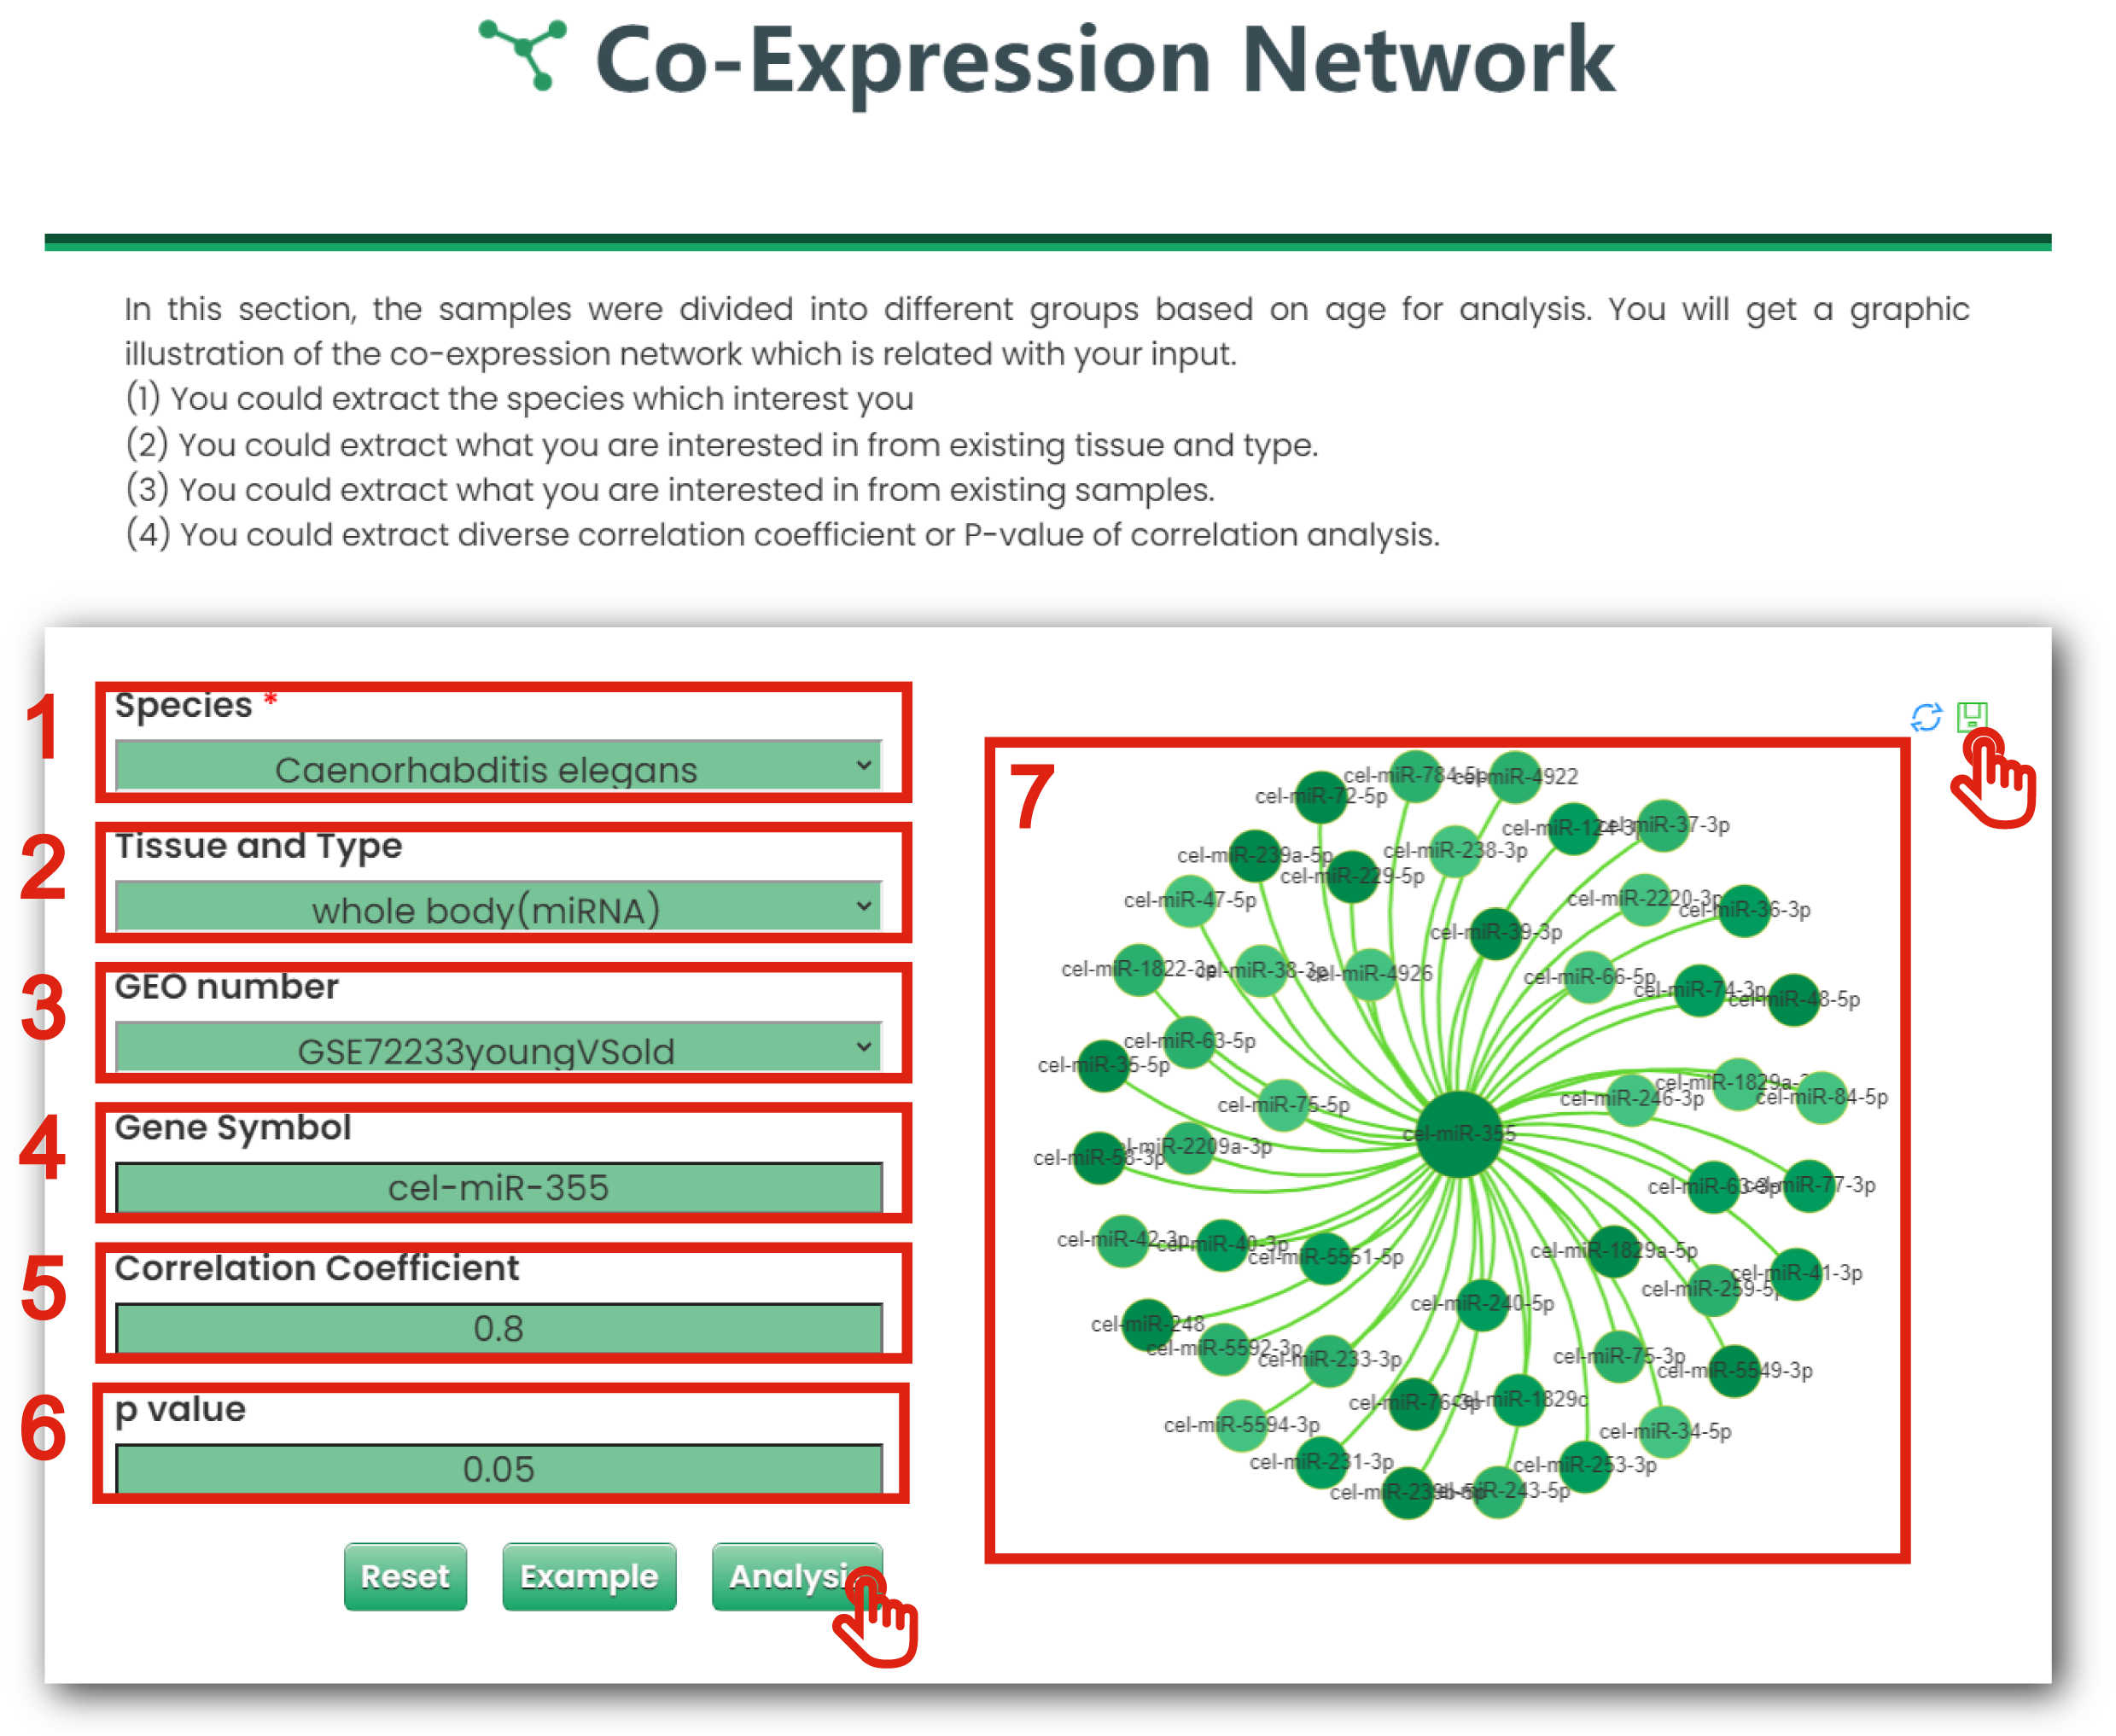
Figure 6-5
6.5. Functional Annotation Analyzer
In this section, you could extract interested genes, miRNAs and lncRNAs, and get function lists which are related with your input.
The Functional Annotation Analyzer page of Tool is displayed in Figure 6-6:
1. You could extract what you are interested in from existing species.
2. You could extract what you are interested in from existing tissue and type.
3. You could extract what you are interested in from existing samples.
4. You could extract diverse |log2 (fold change)| of differential expression analysis.
5. You could extract diverse P-values of differential expression analysis.
6. Click to download data.
7. Users can input keywords from any column to filter the results.
8. Click to get function annotation.
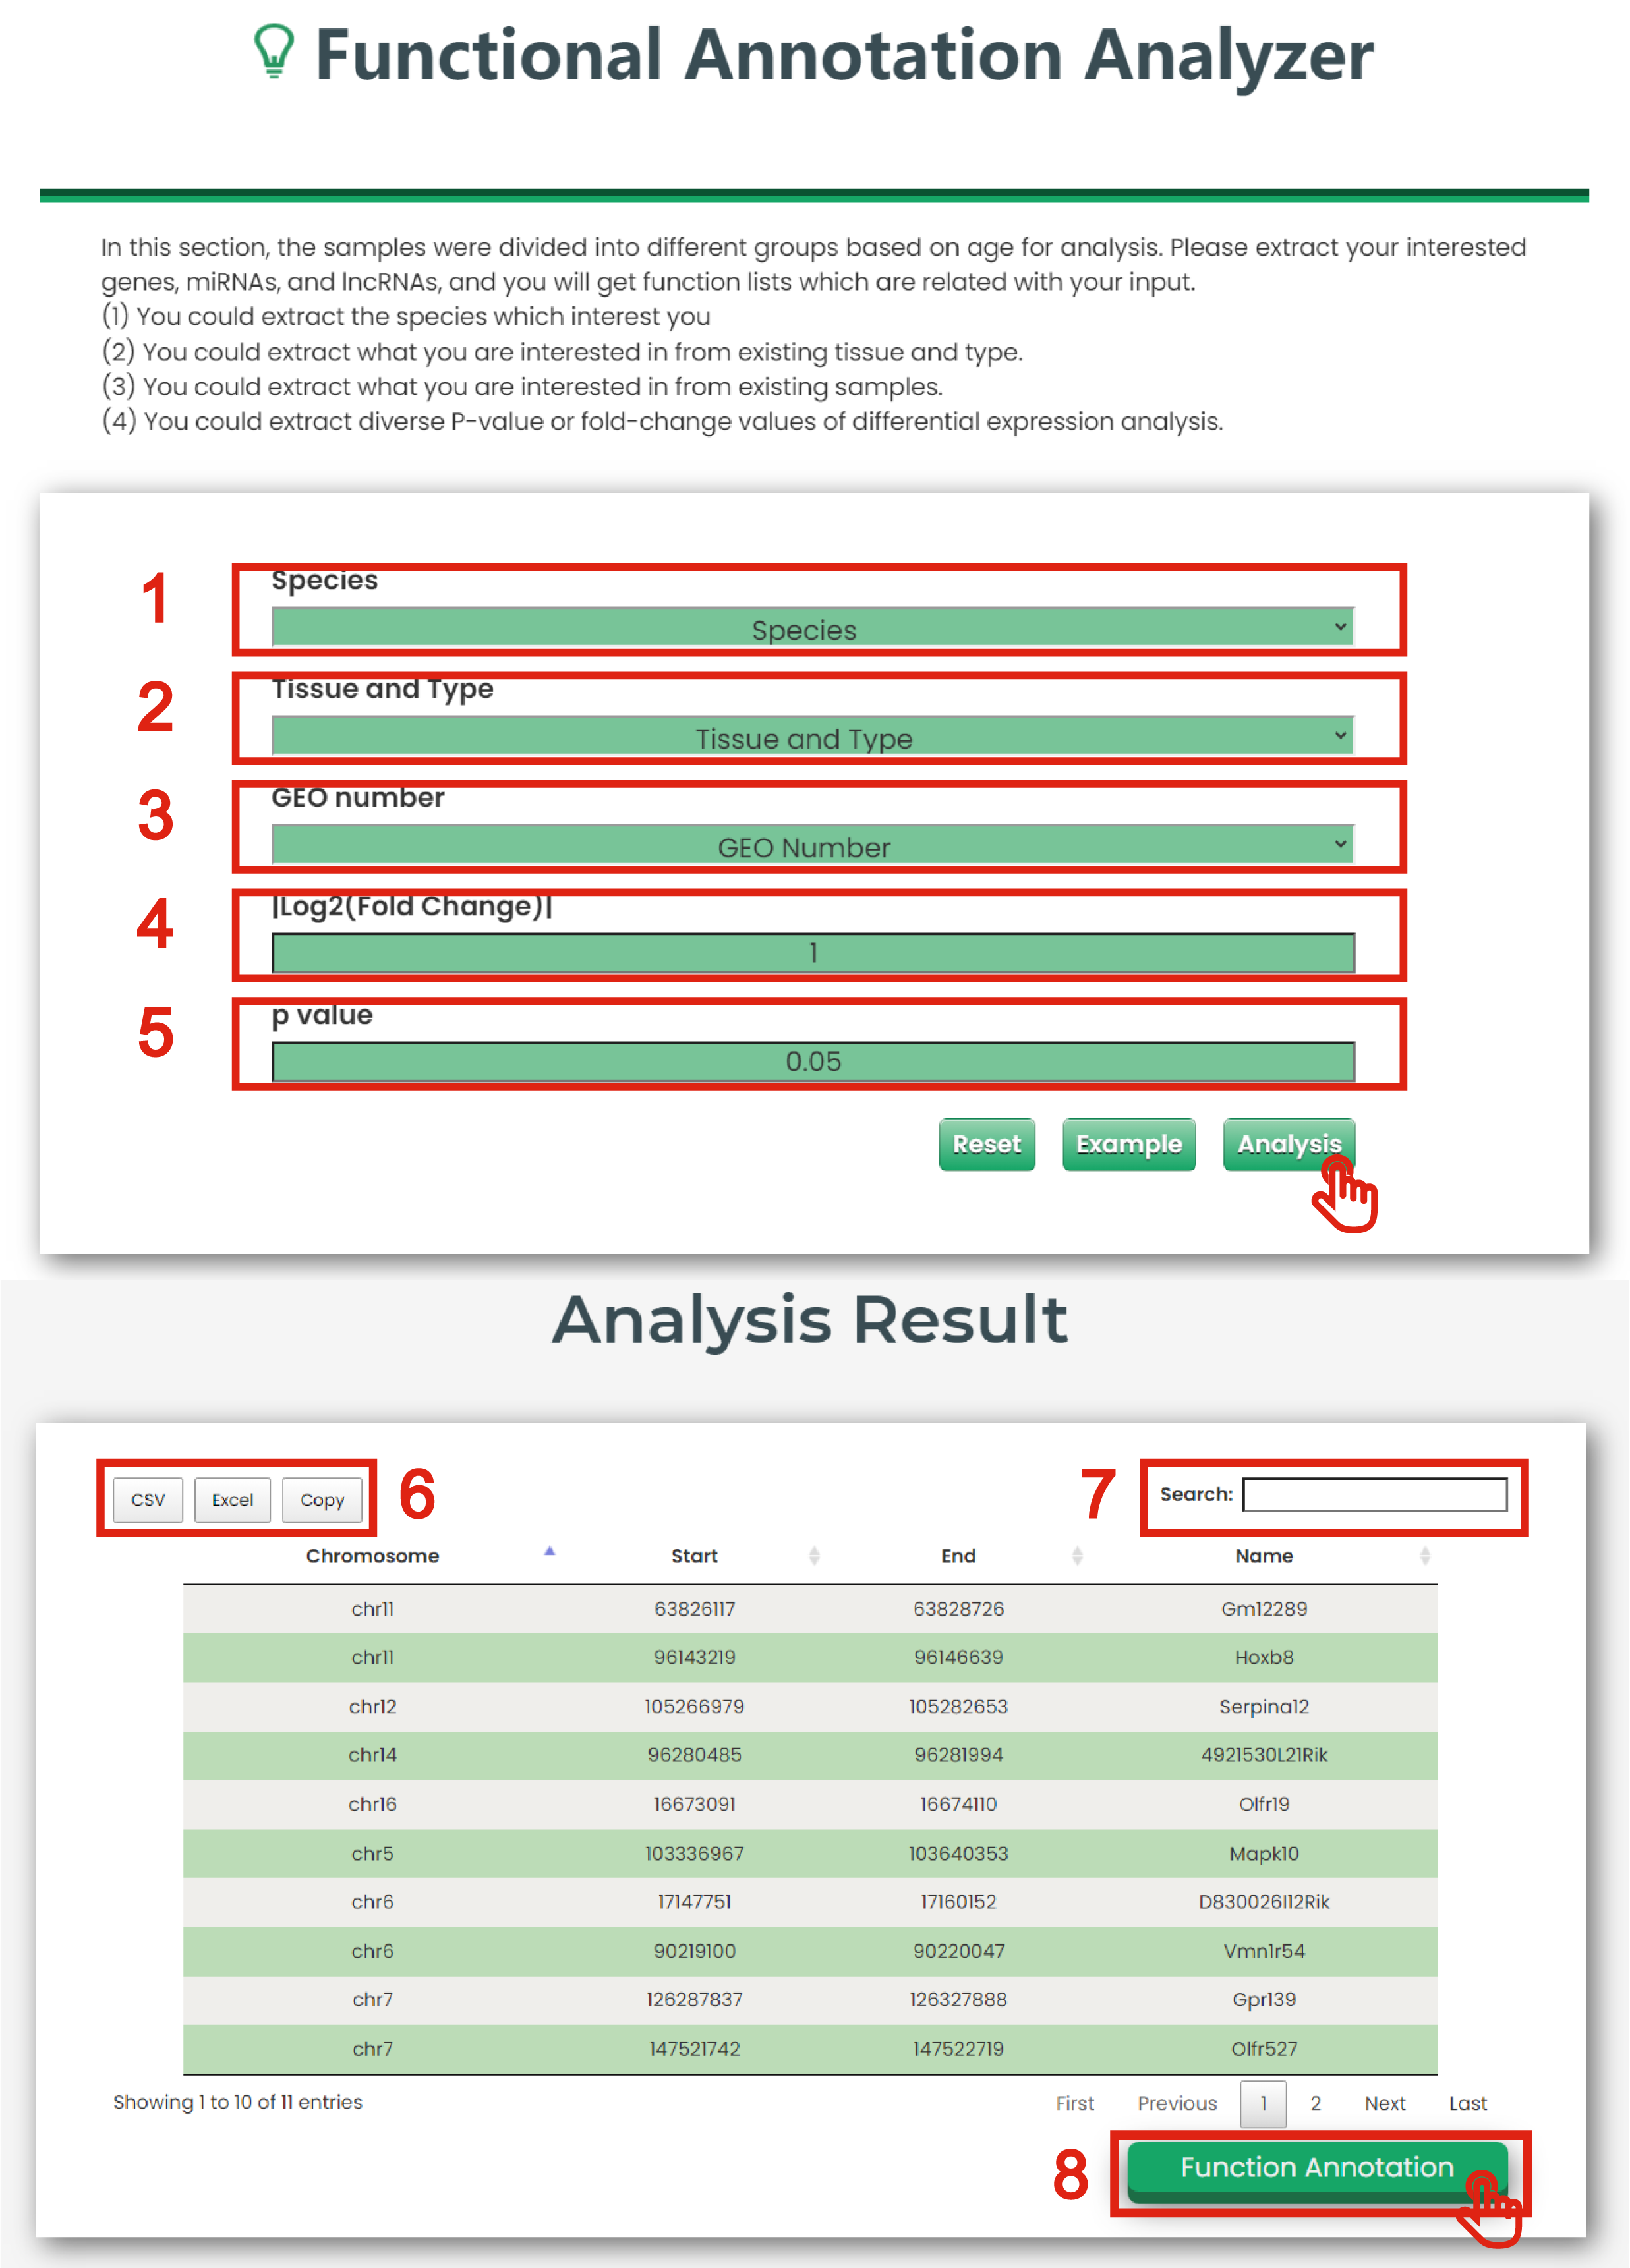
Figure 6-6
7.1. Aging Landscape
In this section, the high-throughput datasets (age-grouped cancer datasets of TCGA) were used to
understand the whole landscape of a specific molecule in all aging-related datasets.
The Aging Landscape page of Cancer & Aging is displayed in Figure 7-1:
1. Put the gene, miRNA and lncRNA which interest you.
2. The aging landscape graph for a specific molecule in all datasets.
3. The plot shows the P-values of differential expression for interested molecules in each aging-associated profiles. You could understand the whole landscape of a specific molecule in all the aging-associated datasets.
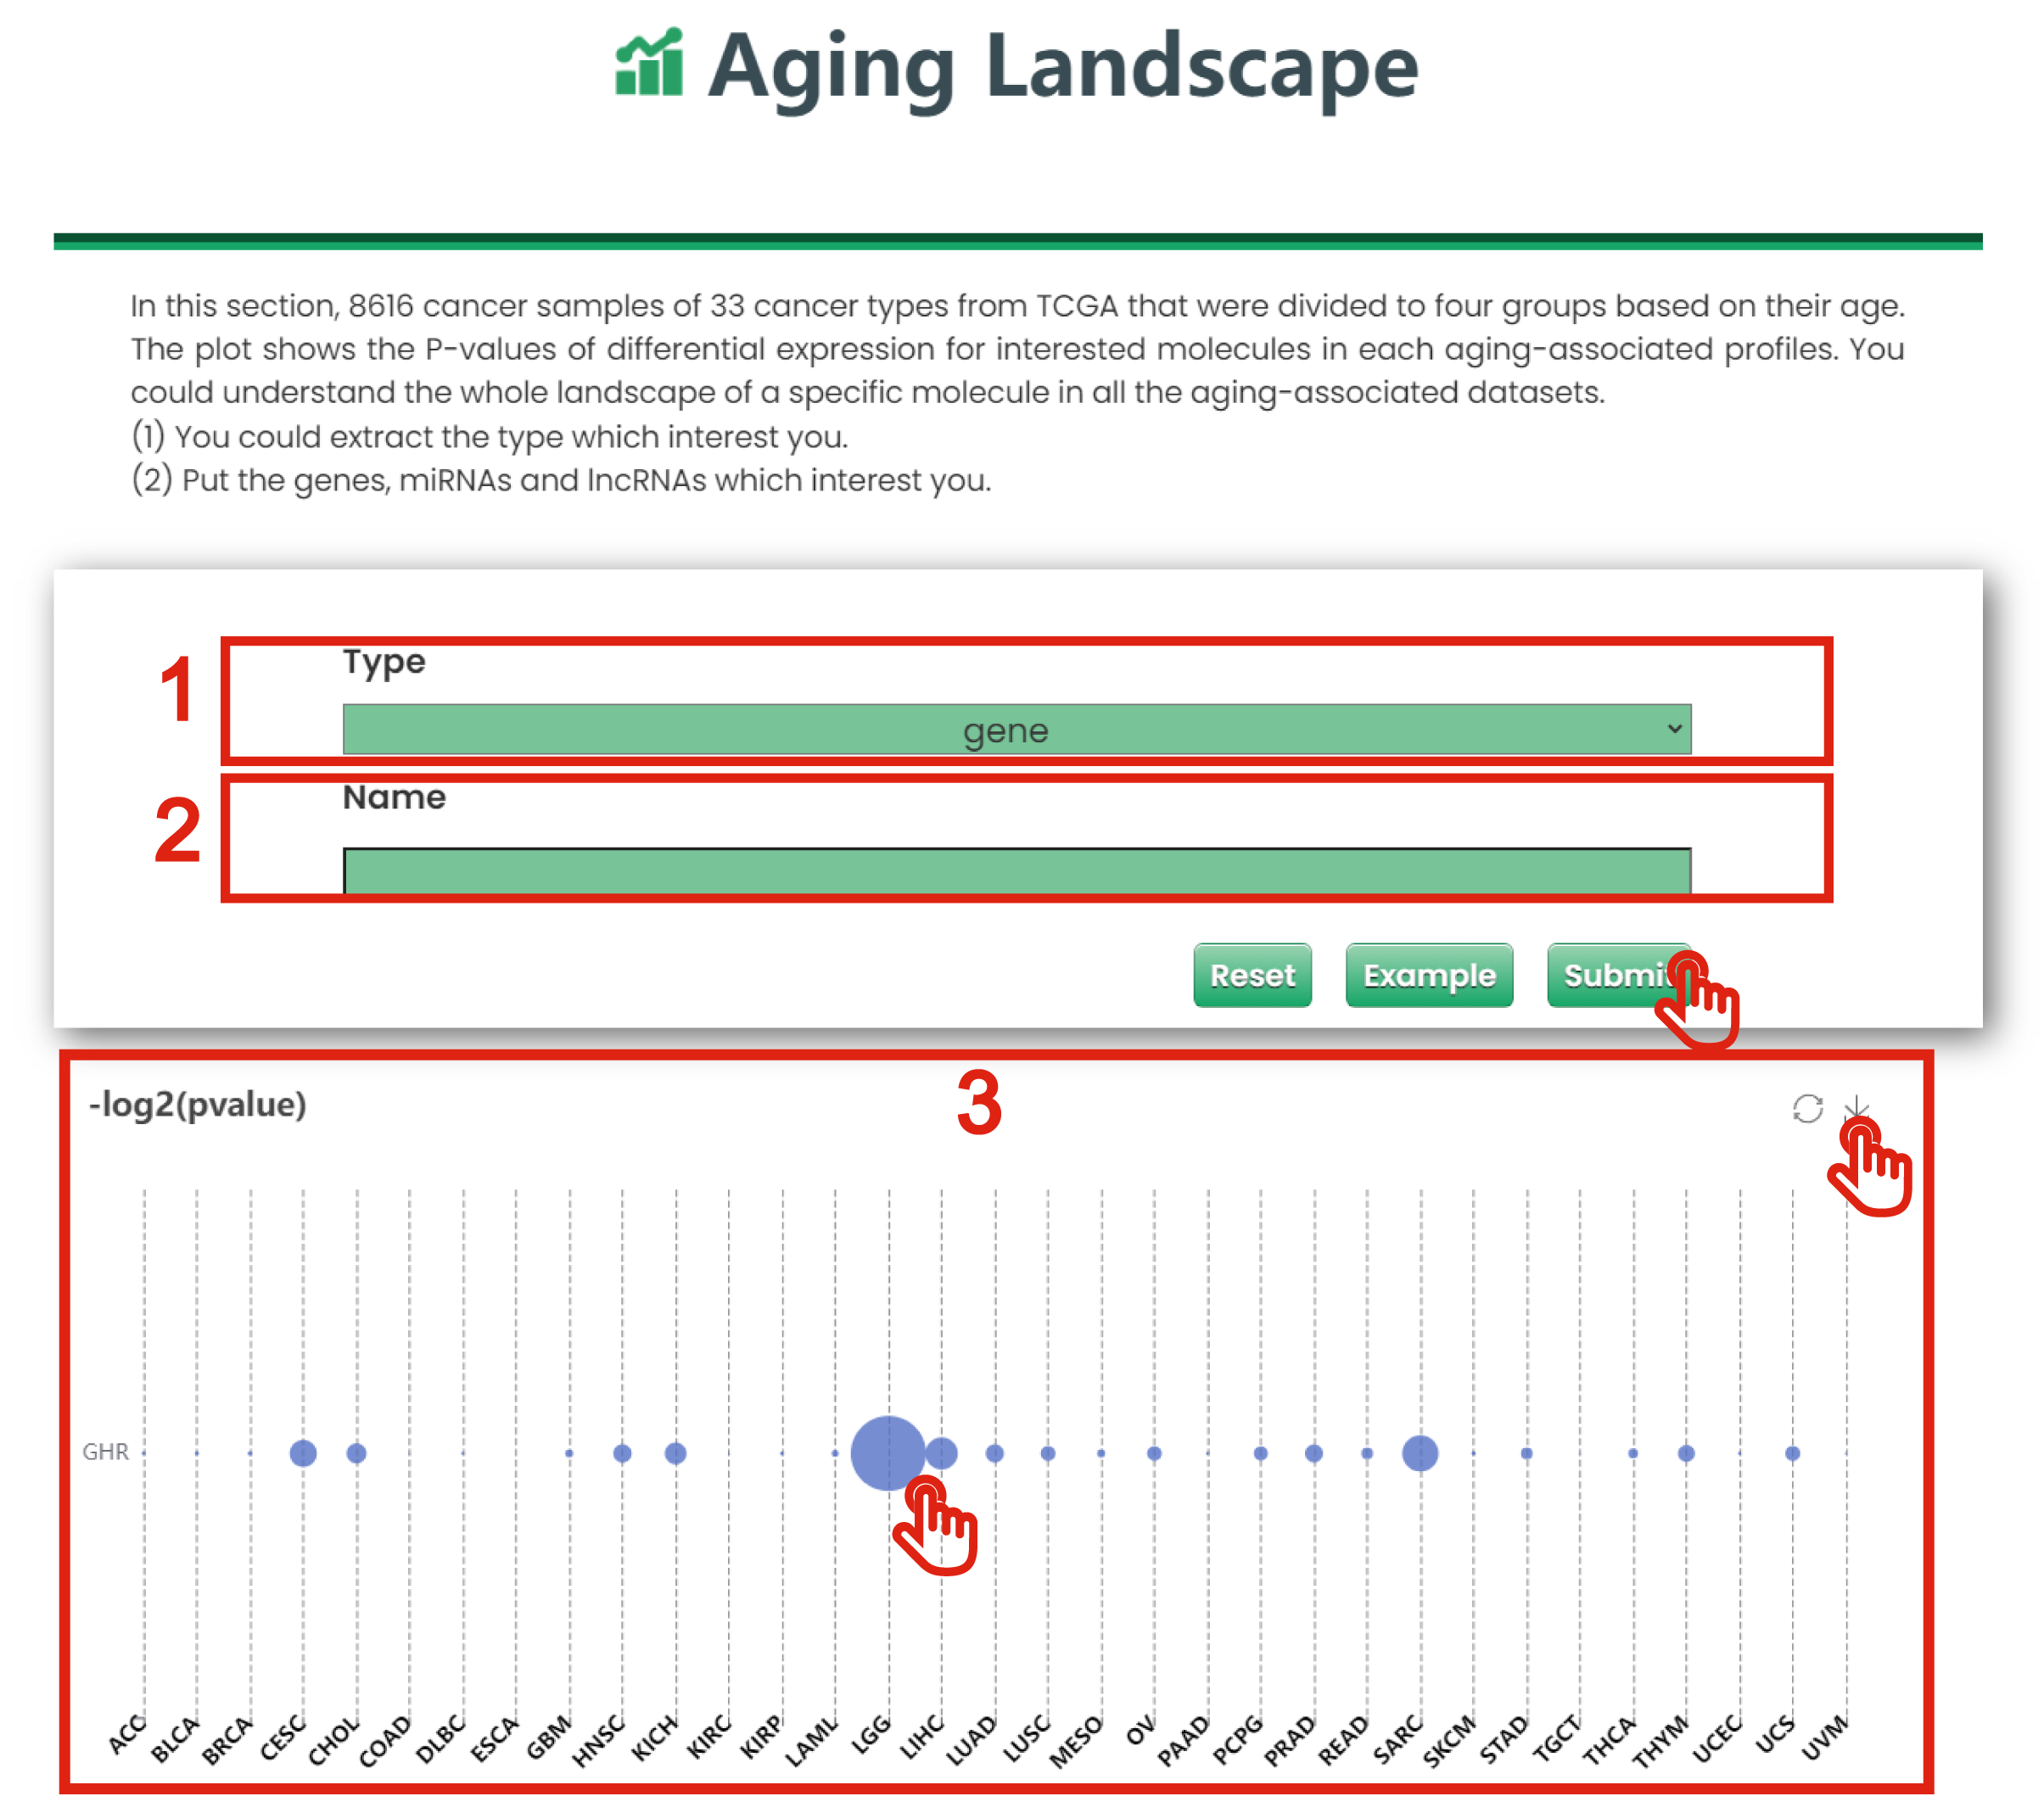
Figure 7-1
7.2. Differential Expression Analyzer
In this section, you could identify the differential expression pattern for your interested genes, miRNAs and lncRNAs in age-grouped cancer datasets of TCGA.
The Differential Expression Analyzer page of Cancer & Aging is displayed in Figure 7-2:
1. You could extract what you are interested in from existing tissue (TCGA Cancers).
2. You could put the gene, miRNA and lncRNA which interest you.
3. You could limit interested P-values of differential expression analysis.
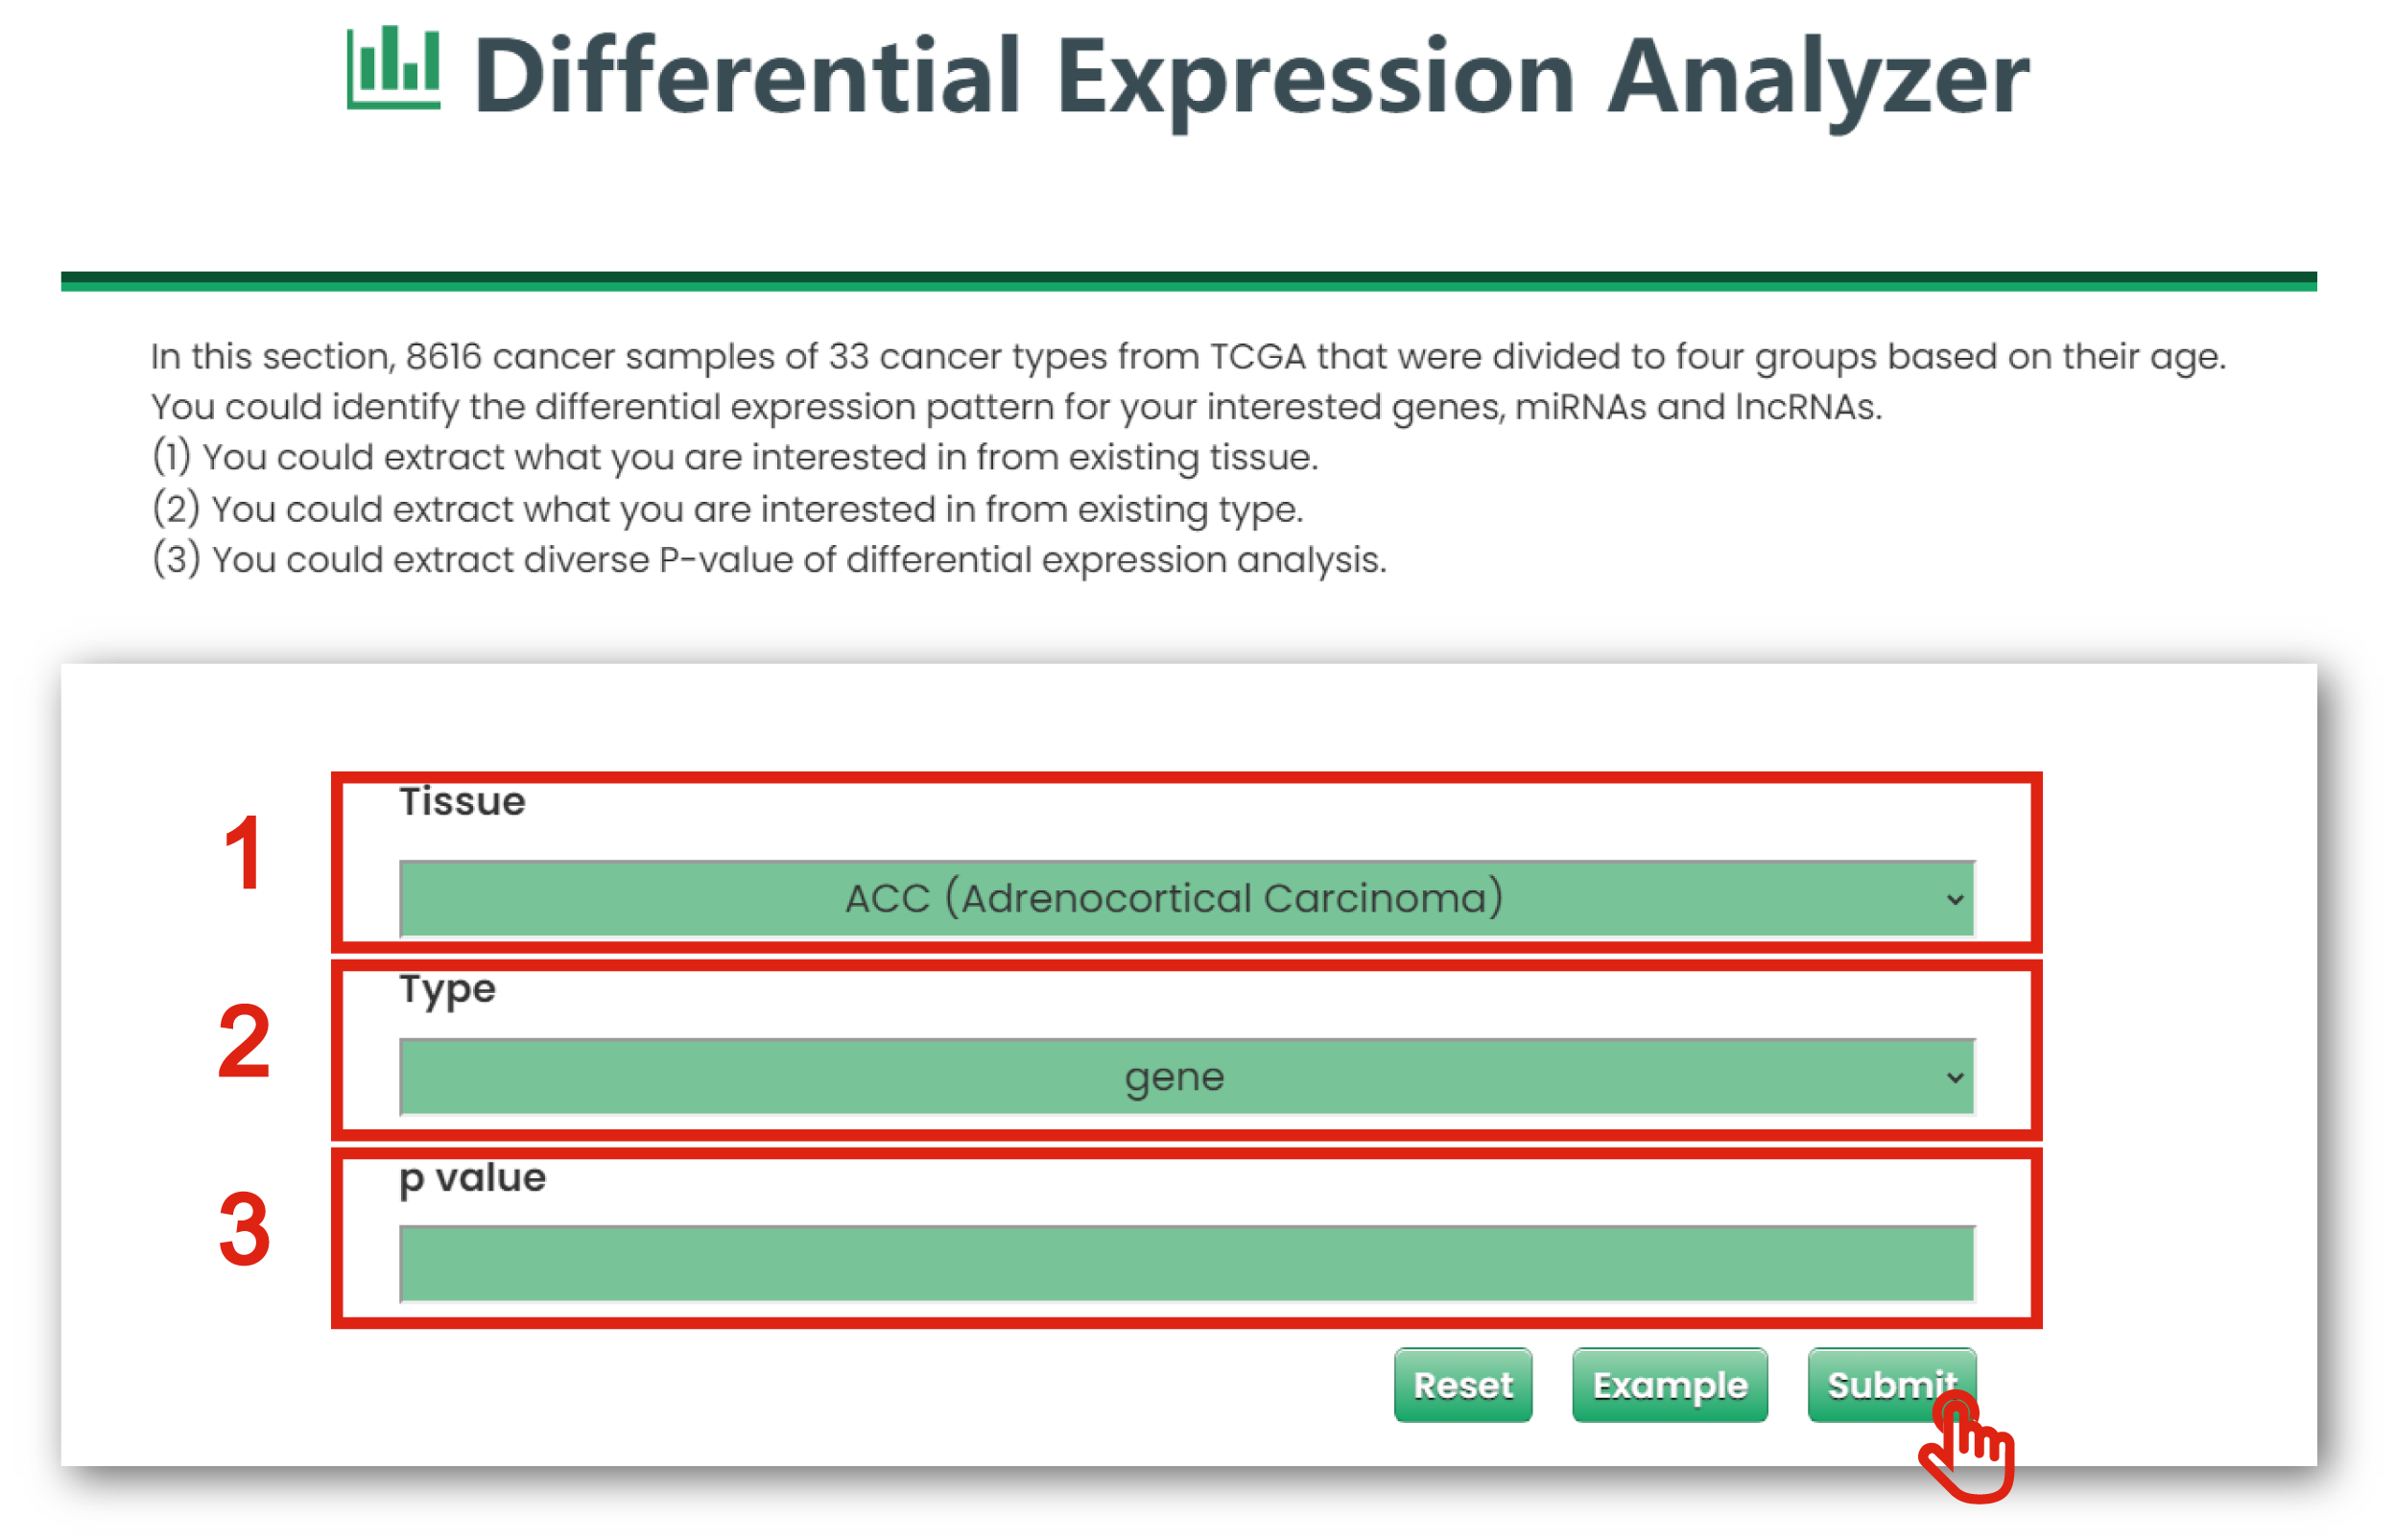
Figure 7-2
The result page is displayed in Figure 7-3:
1. Click to download data.
2. Users can input keywords from any column to filter the results.
3. Click to get a box plot graph for differential results.
4. The boxplot shows the differential expression levels of interested molecules.
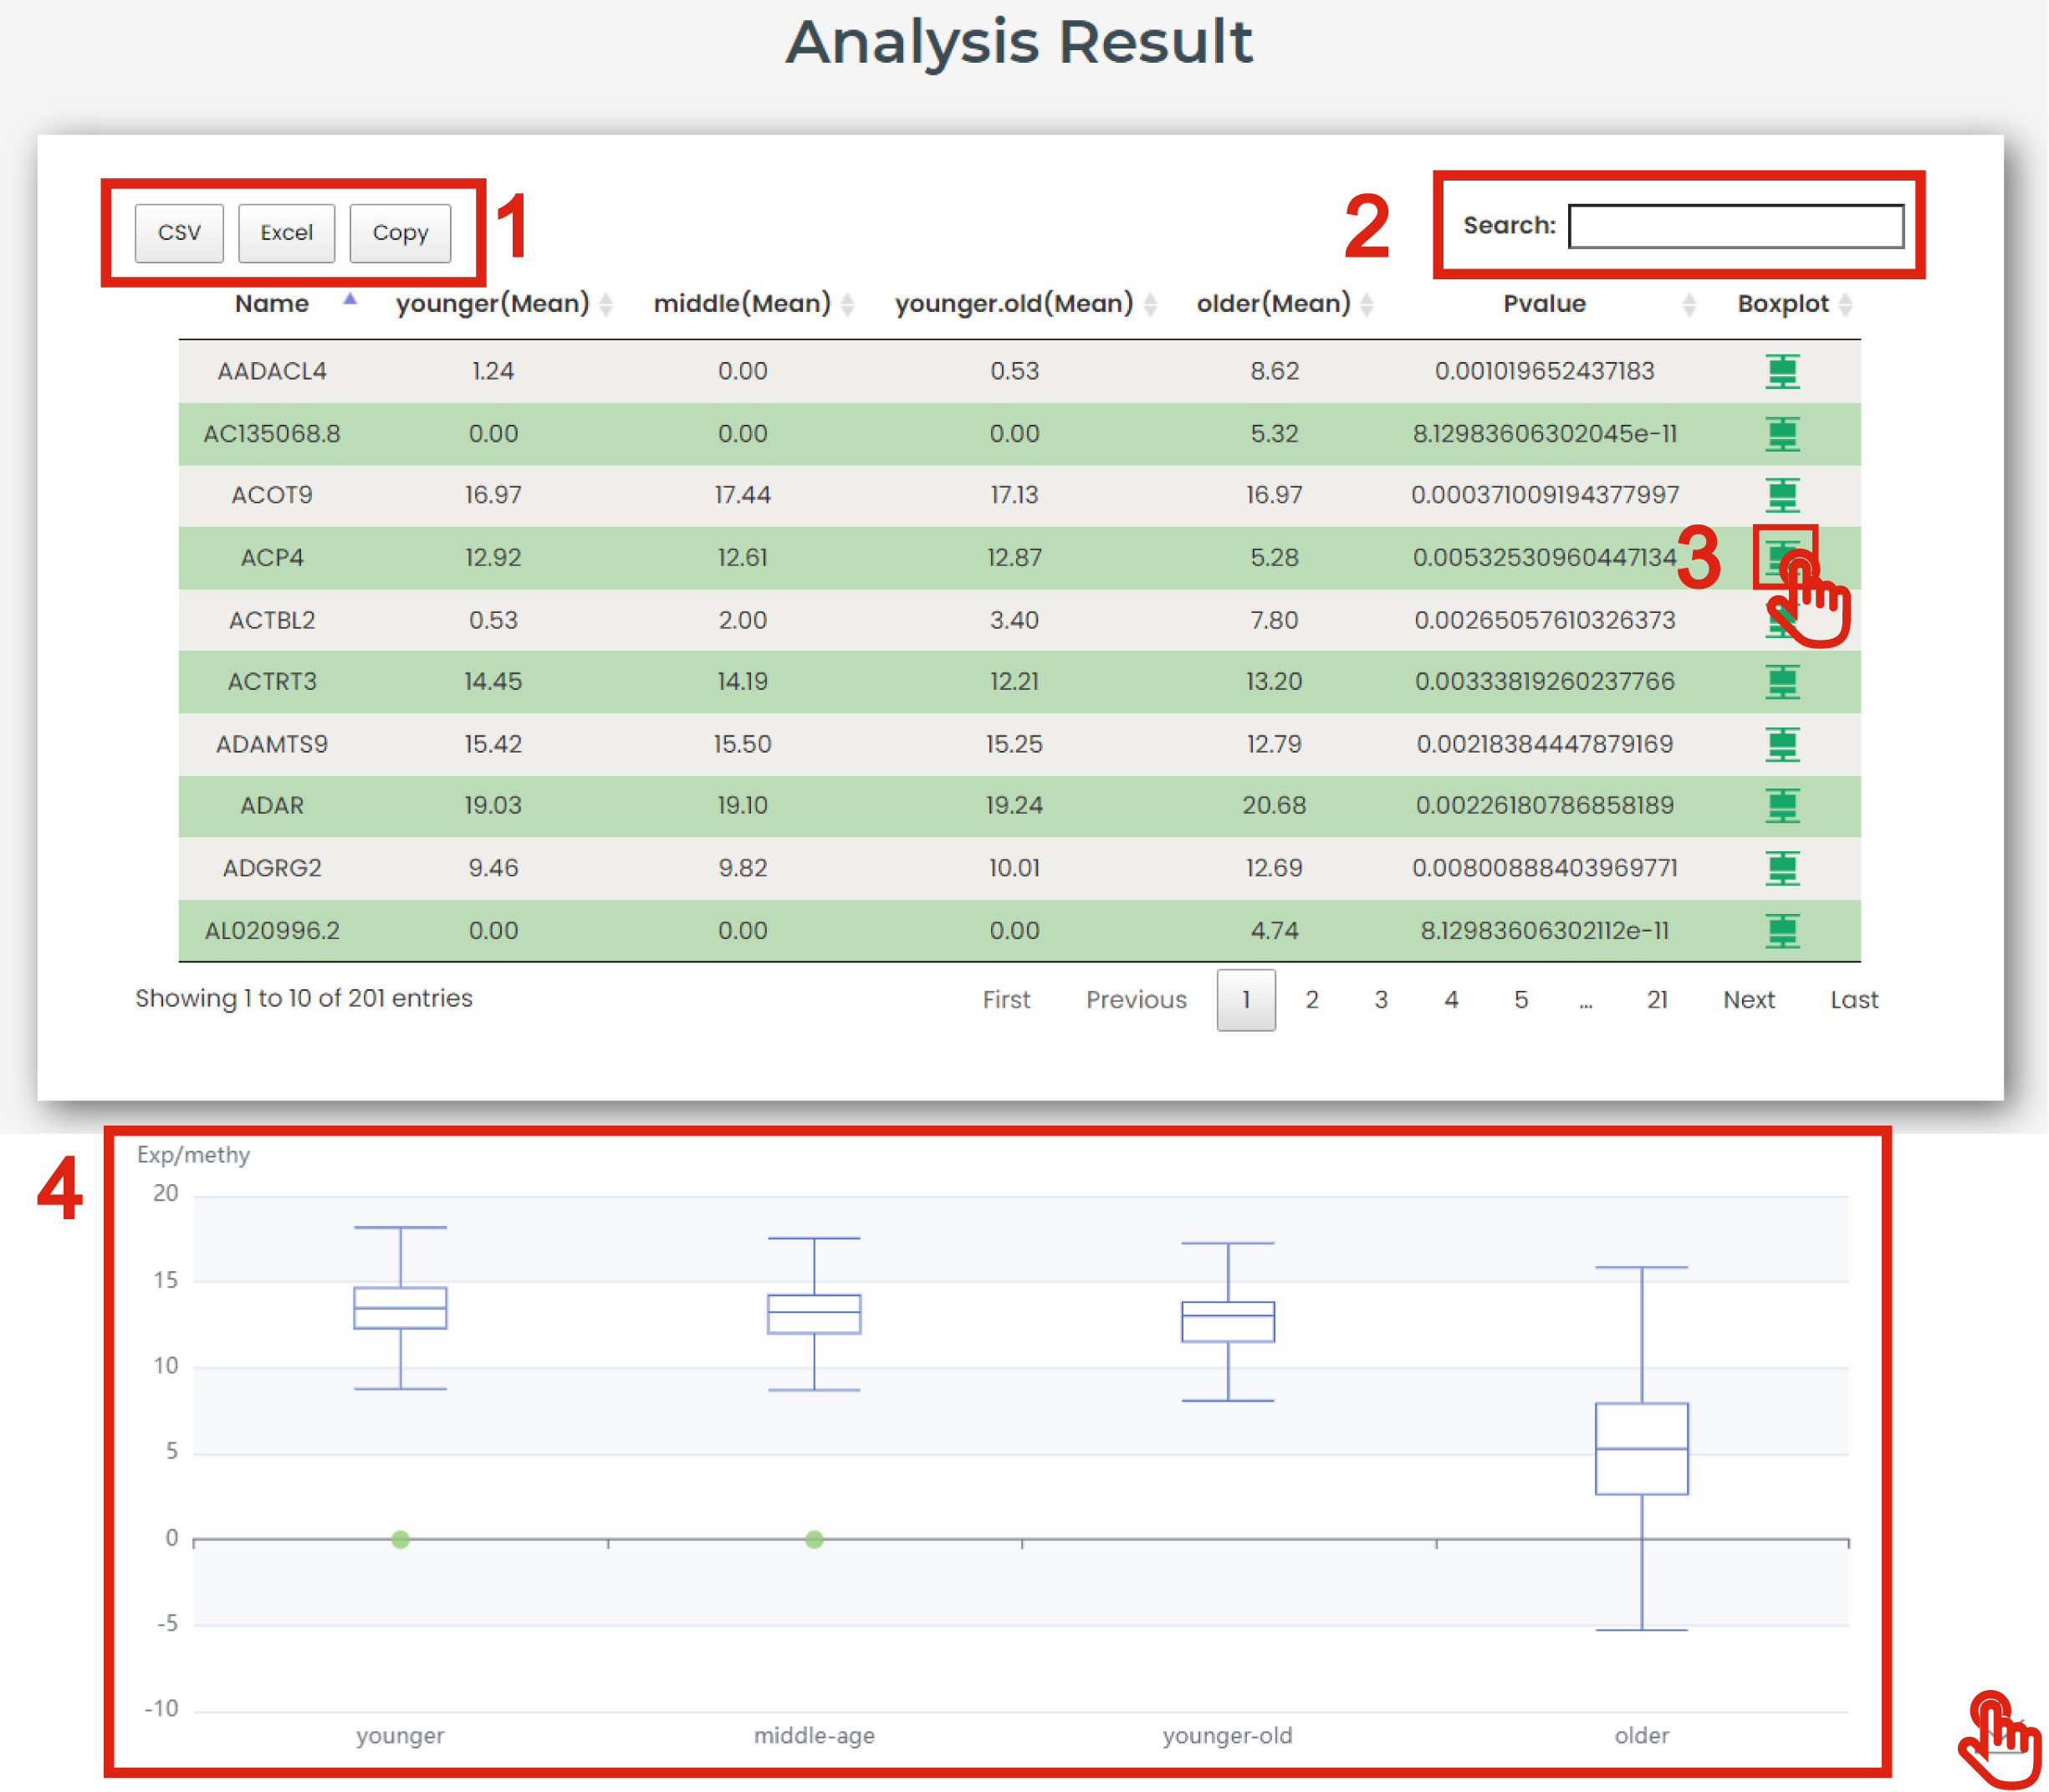
Figure 7-3
7.3. Data Heat Mapper
In this section, you will get a heatmap of the genes, miRNAs and lncRNAs which is related with your input based on age-grouped cancer datasets of TCGA.
The Data Heat Mapper page of Cancer & Aging is displayed in Figure 7-4:
1. You could extract what you are interested in from existing tissue (TCGA Cancers).
2. You could put the gene, miRNA and lncRNA which interest you.
3. You could limit interested P-values of differential expression analysis.
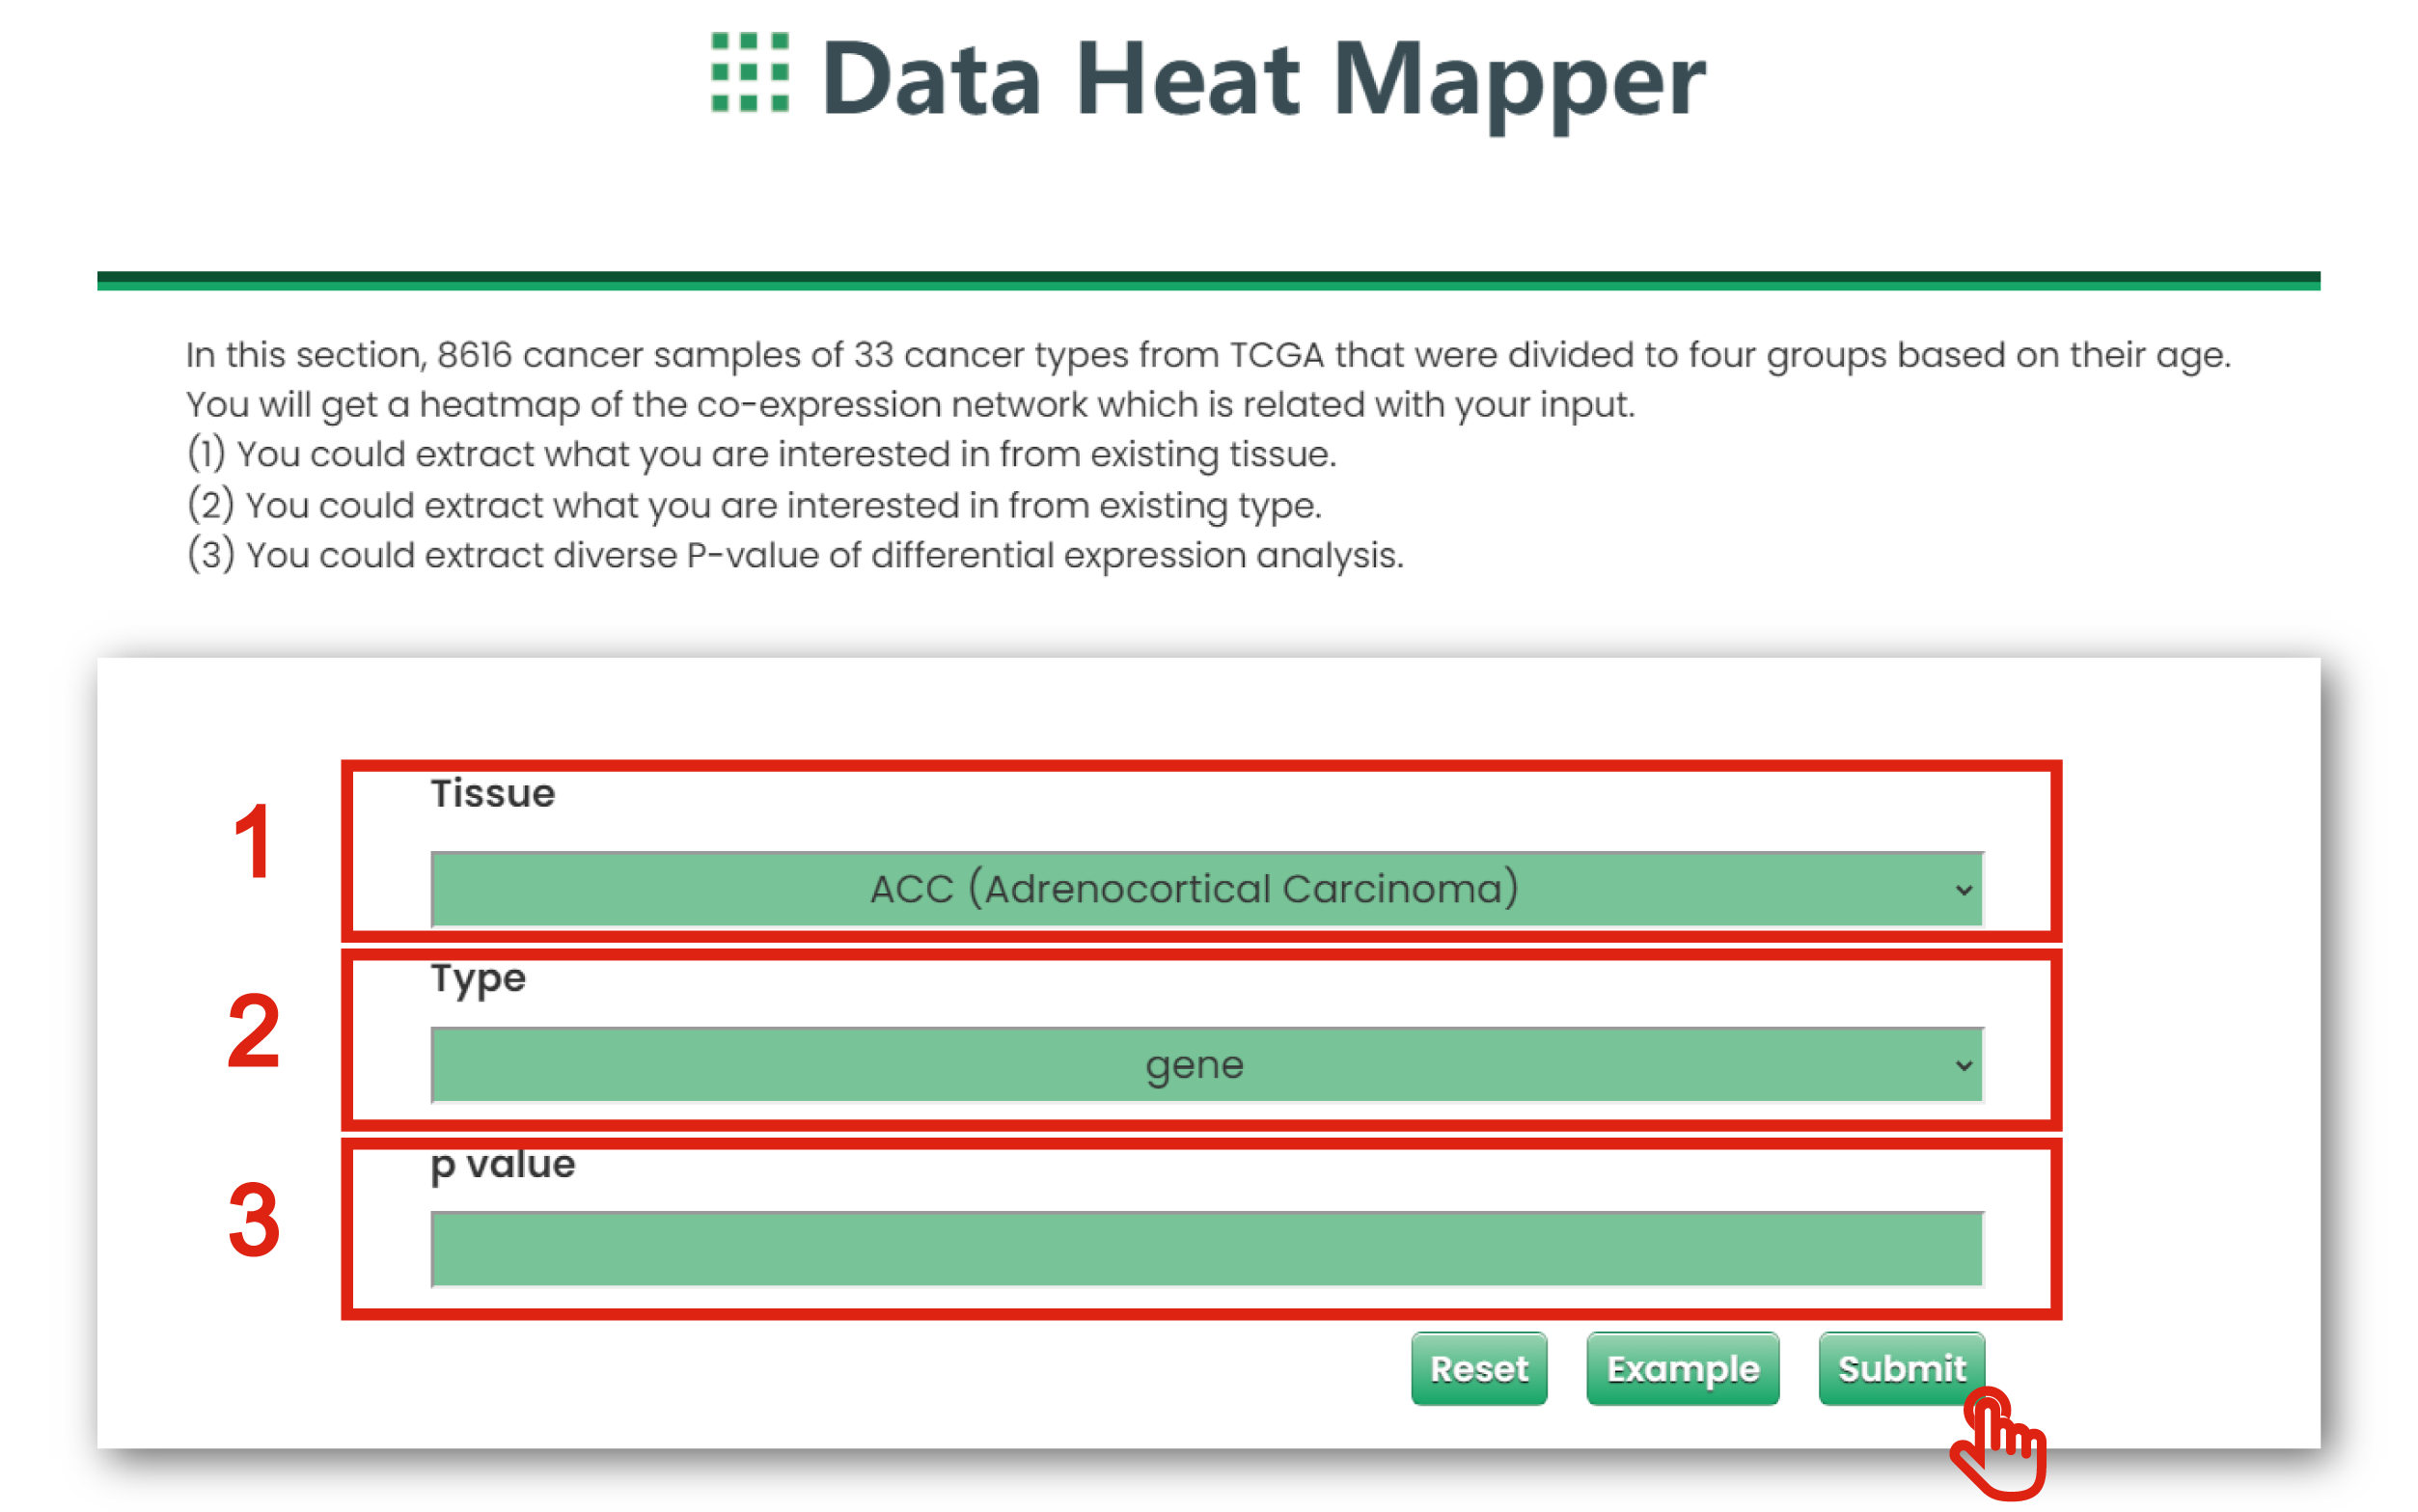
Figure 7-4
7.4. Co-Expression Network
In this section, you will get a graphic illustration of the co-expression network which is related with your input based on age-grouped cancer datasets of TCGA.
The Co-Expression Network page of Cancer & Aging is displayed in Figure 7-5:
1. You could extract what you are interested in from existing tissue (TCGA Cancers).
2. You could extract what you are interested in from type (gene, miRNA and lncRNA).
3. You could get a table for all interested molecule.
4. You could extract diverse correlation coefficient of correlation analysis.
5. You could extract diverse P-values of correlation analysis.
6. The plot shows the co-expression network of interested molecule.

Figure 7-5
7.5. Functional Annotation Analyzer
In this section, you could extract interested genes, miRNAs and lncRNAs, and get function lists which are related with your input.
The Functional Annotation Analyzer page of Cancer & Aging is displayed in Figure 7-6:
1. You could extract what you are interested in from existing tissue (TCGA Cancers).
2. You could extract what you are interested in from existing type (gene, miRNA and lncRNA).
3. You could extract diverse P-values of differential expression analysis.
4. Click to download data.
5. Users can input keywords from any column to filter the results.
6. Click to get function annotation.
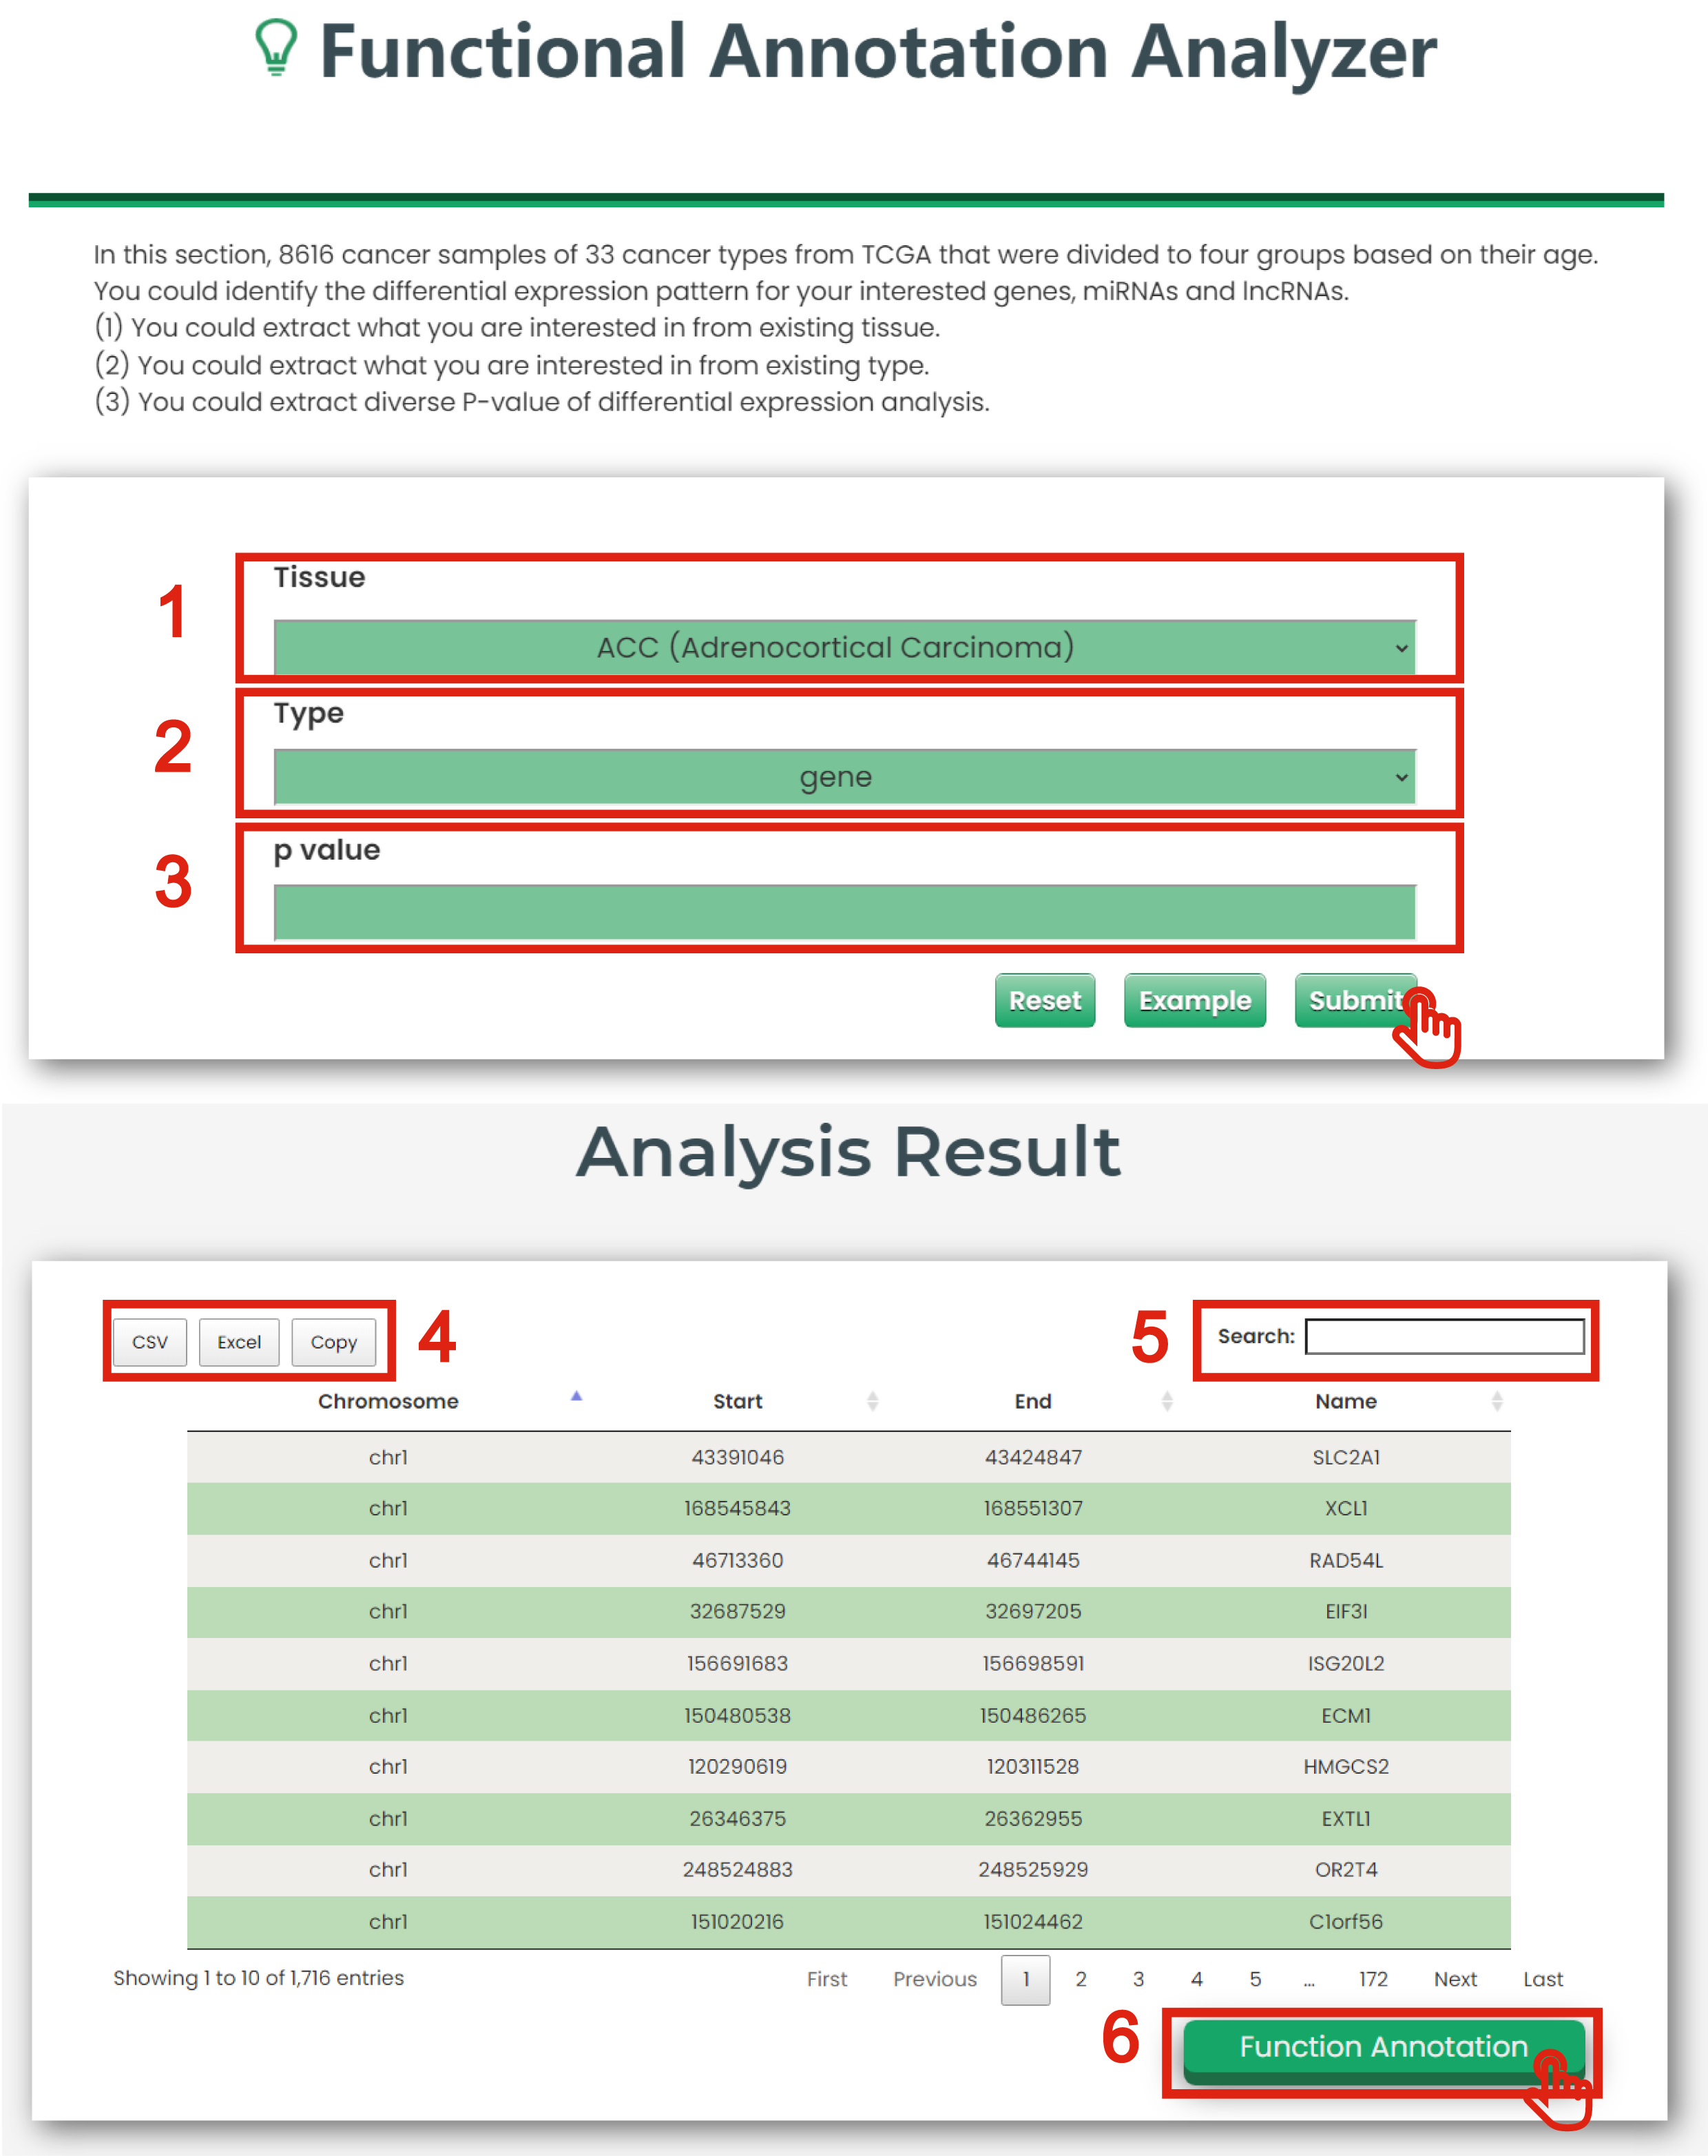
Figure 7-6
In this section, users could upload data for correlation analysis of interested molecules with age, and visualize them with heatmaps and correlation scatter plots.
The Submit & Analysis page is displayed in Figure 8-1:
1. You could upload dataset for correlation analysis.
2. You could extract diverse correlation coefficient of correlation analysis.
3. You could extract diverse P-values of correlation analysis.
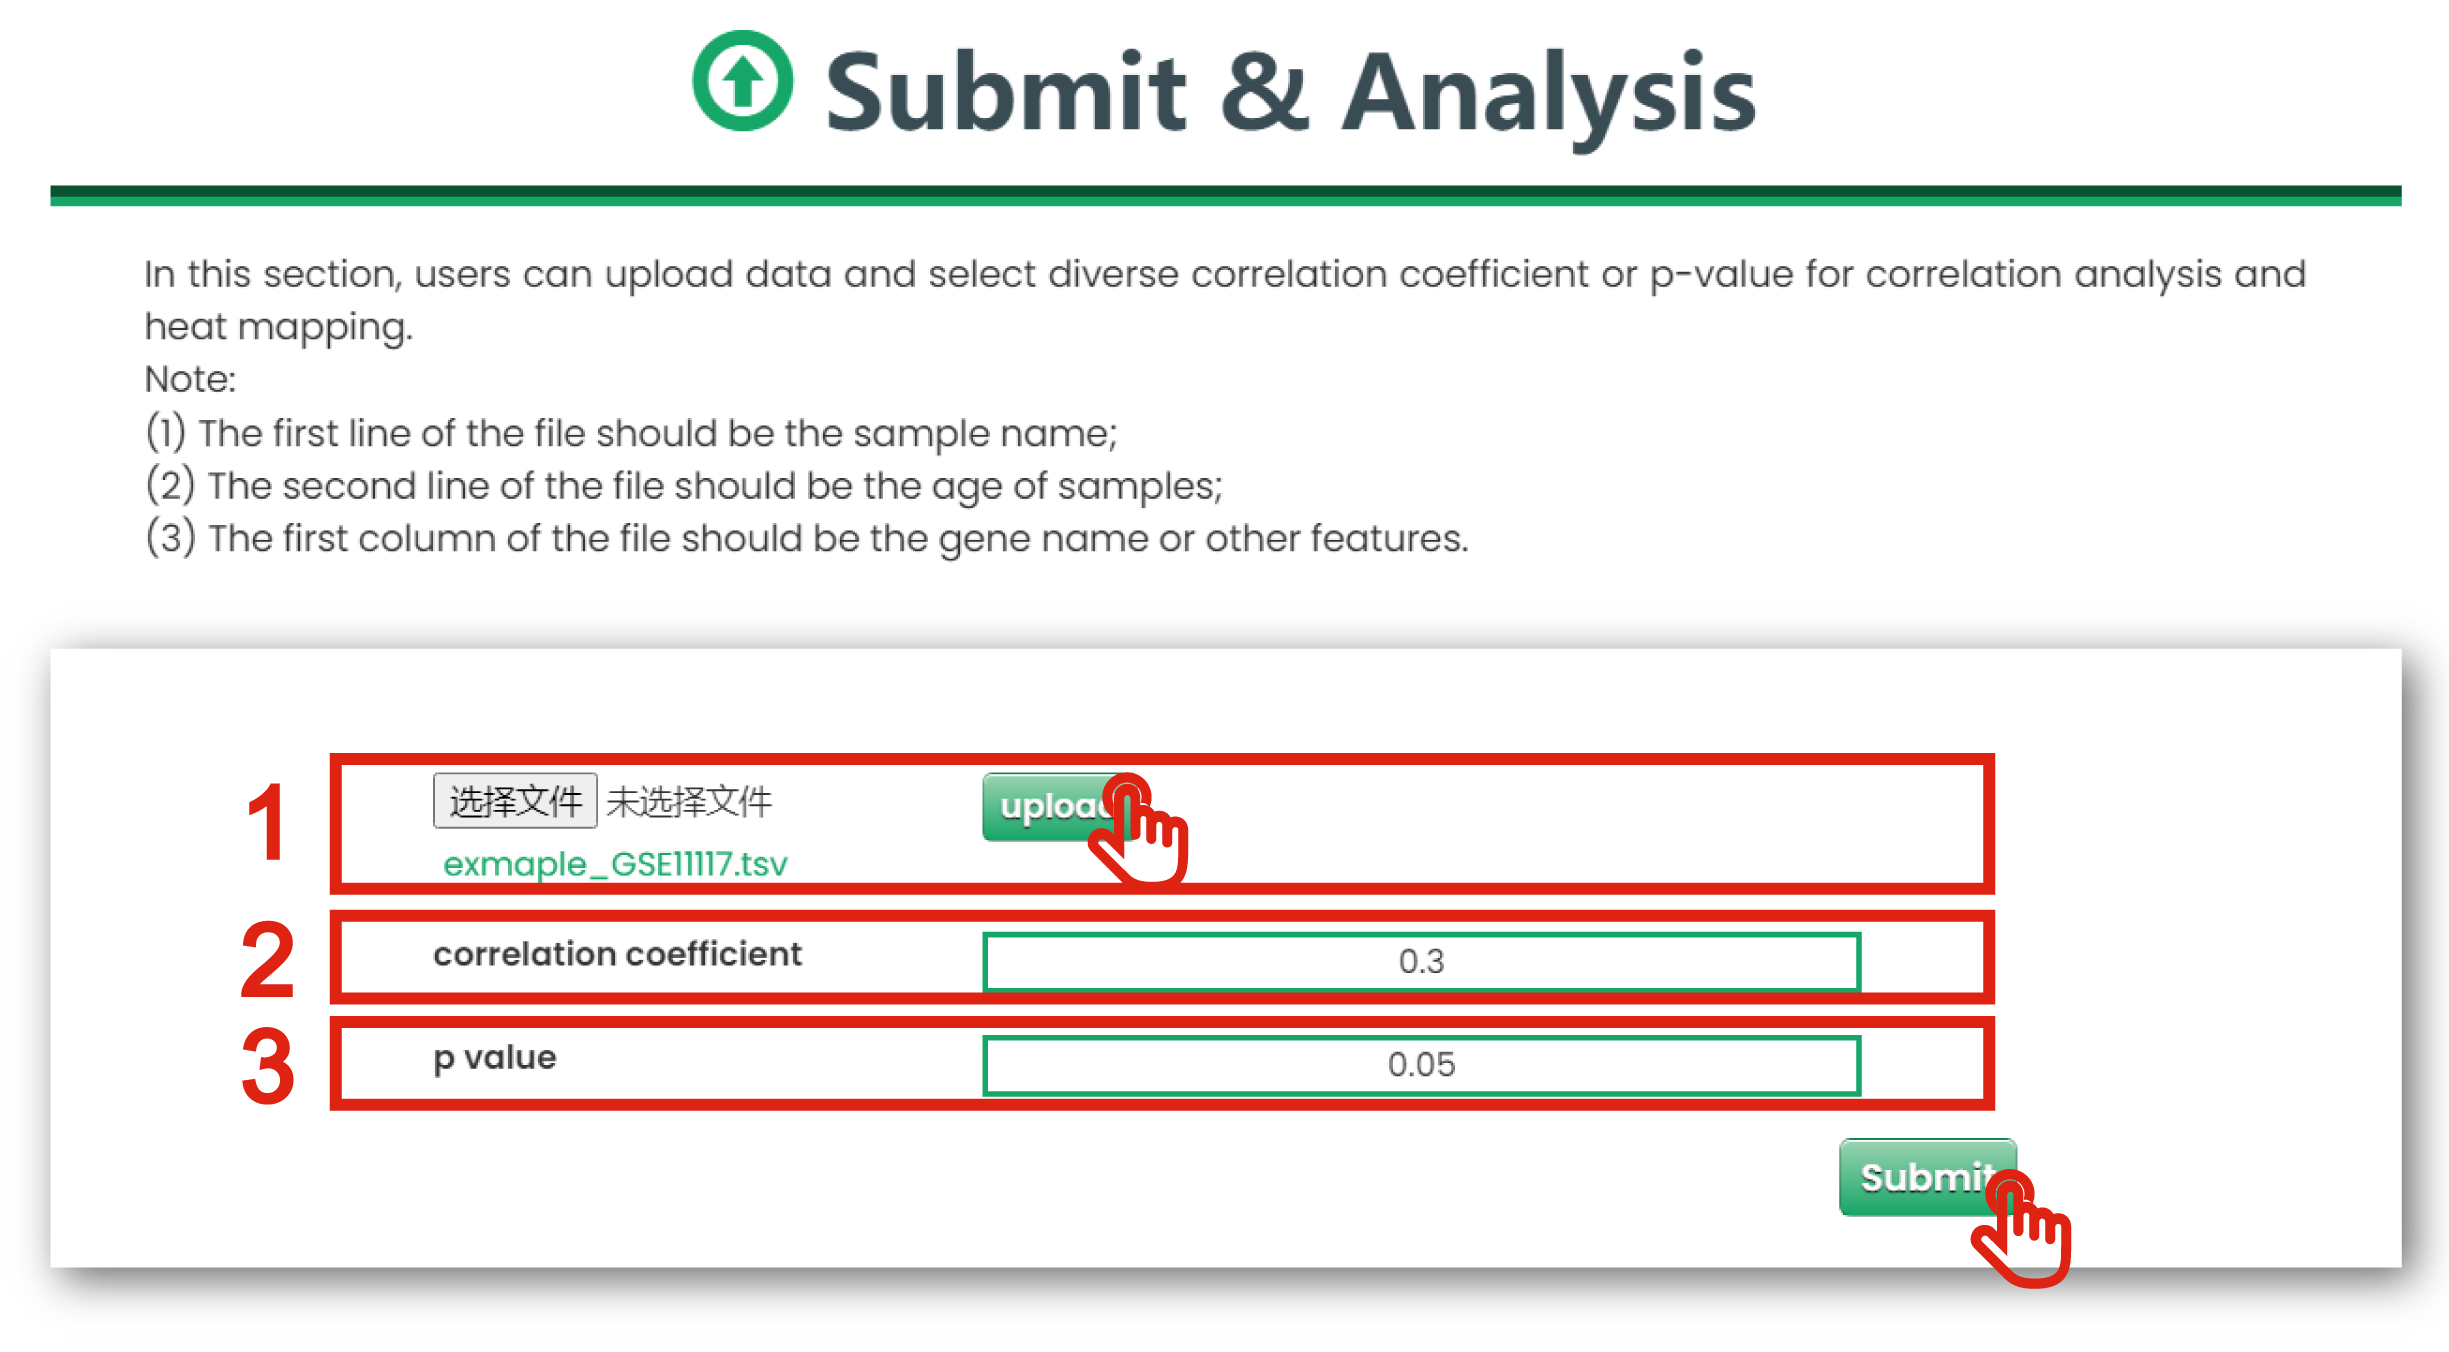
Figure 8-1
The analysis result page is displayed in Figure 8-2:
1. Click to download data.
2. Users can input keywords from any column to filter the results.
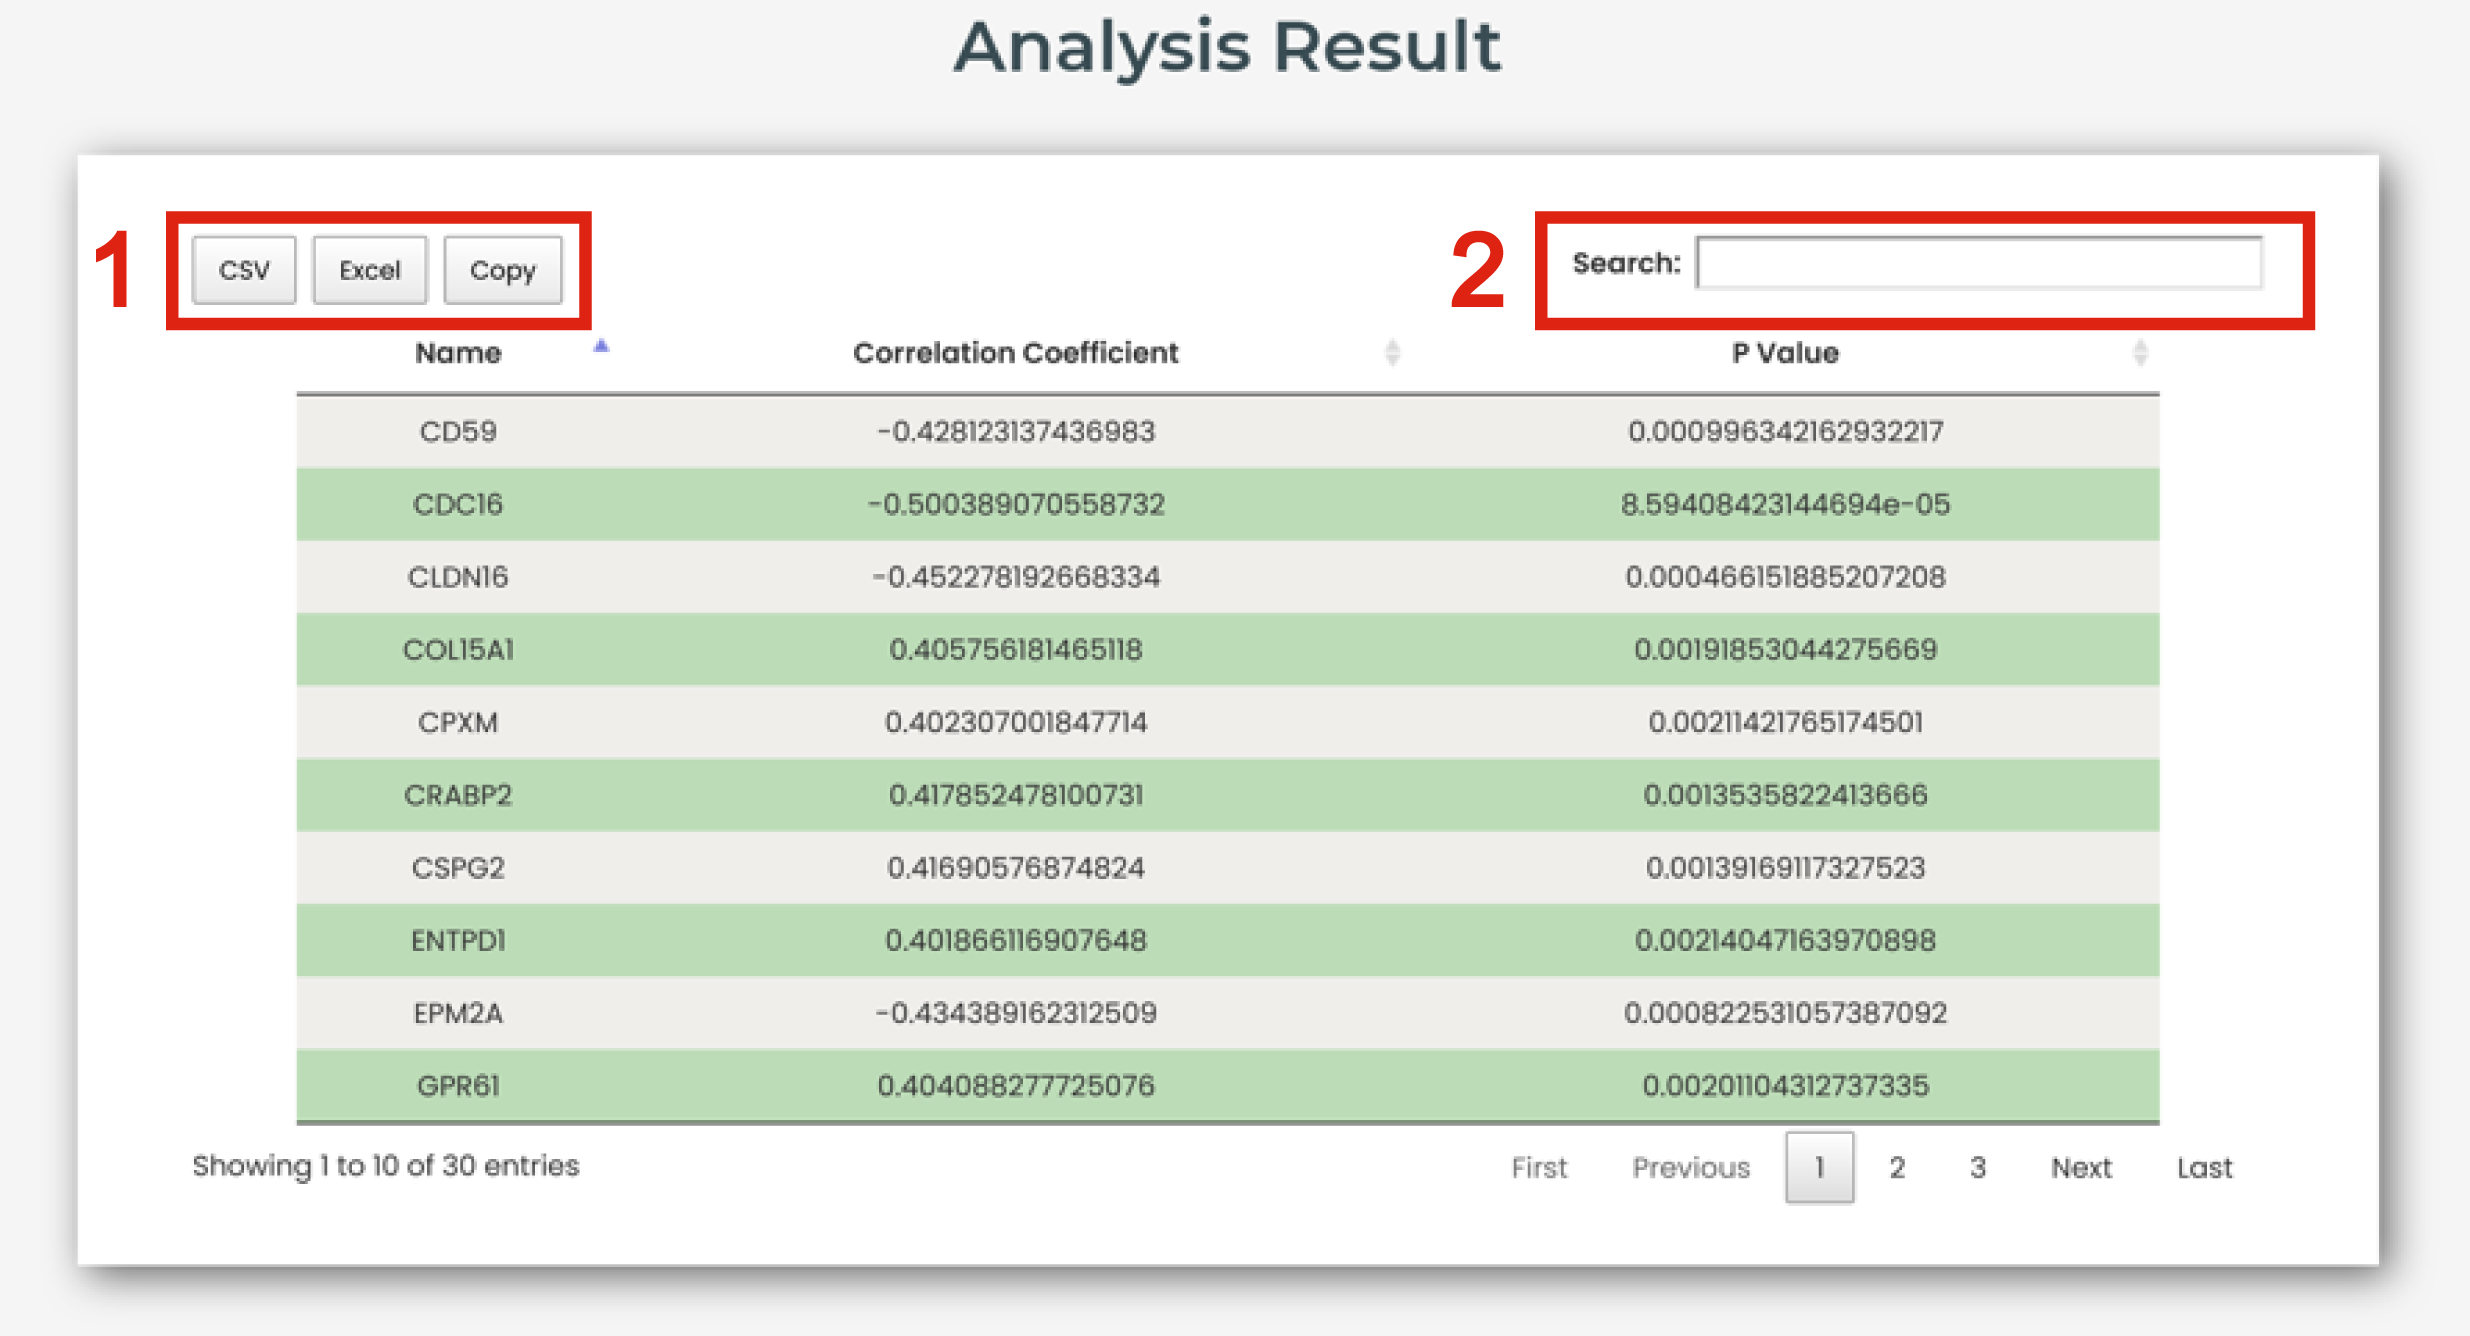
Figure 8-2
The page of heatmap or correlation scatter plot is displayed in Figure 8-3:
1. The correlation scatter plot shows the correlation between interested molecule and age.
2. The heatmap shows the association of interested molecules and age.
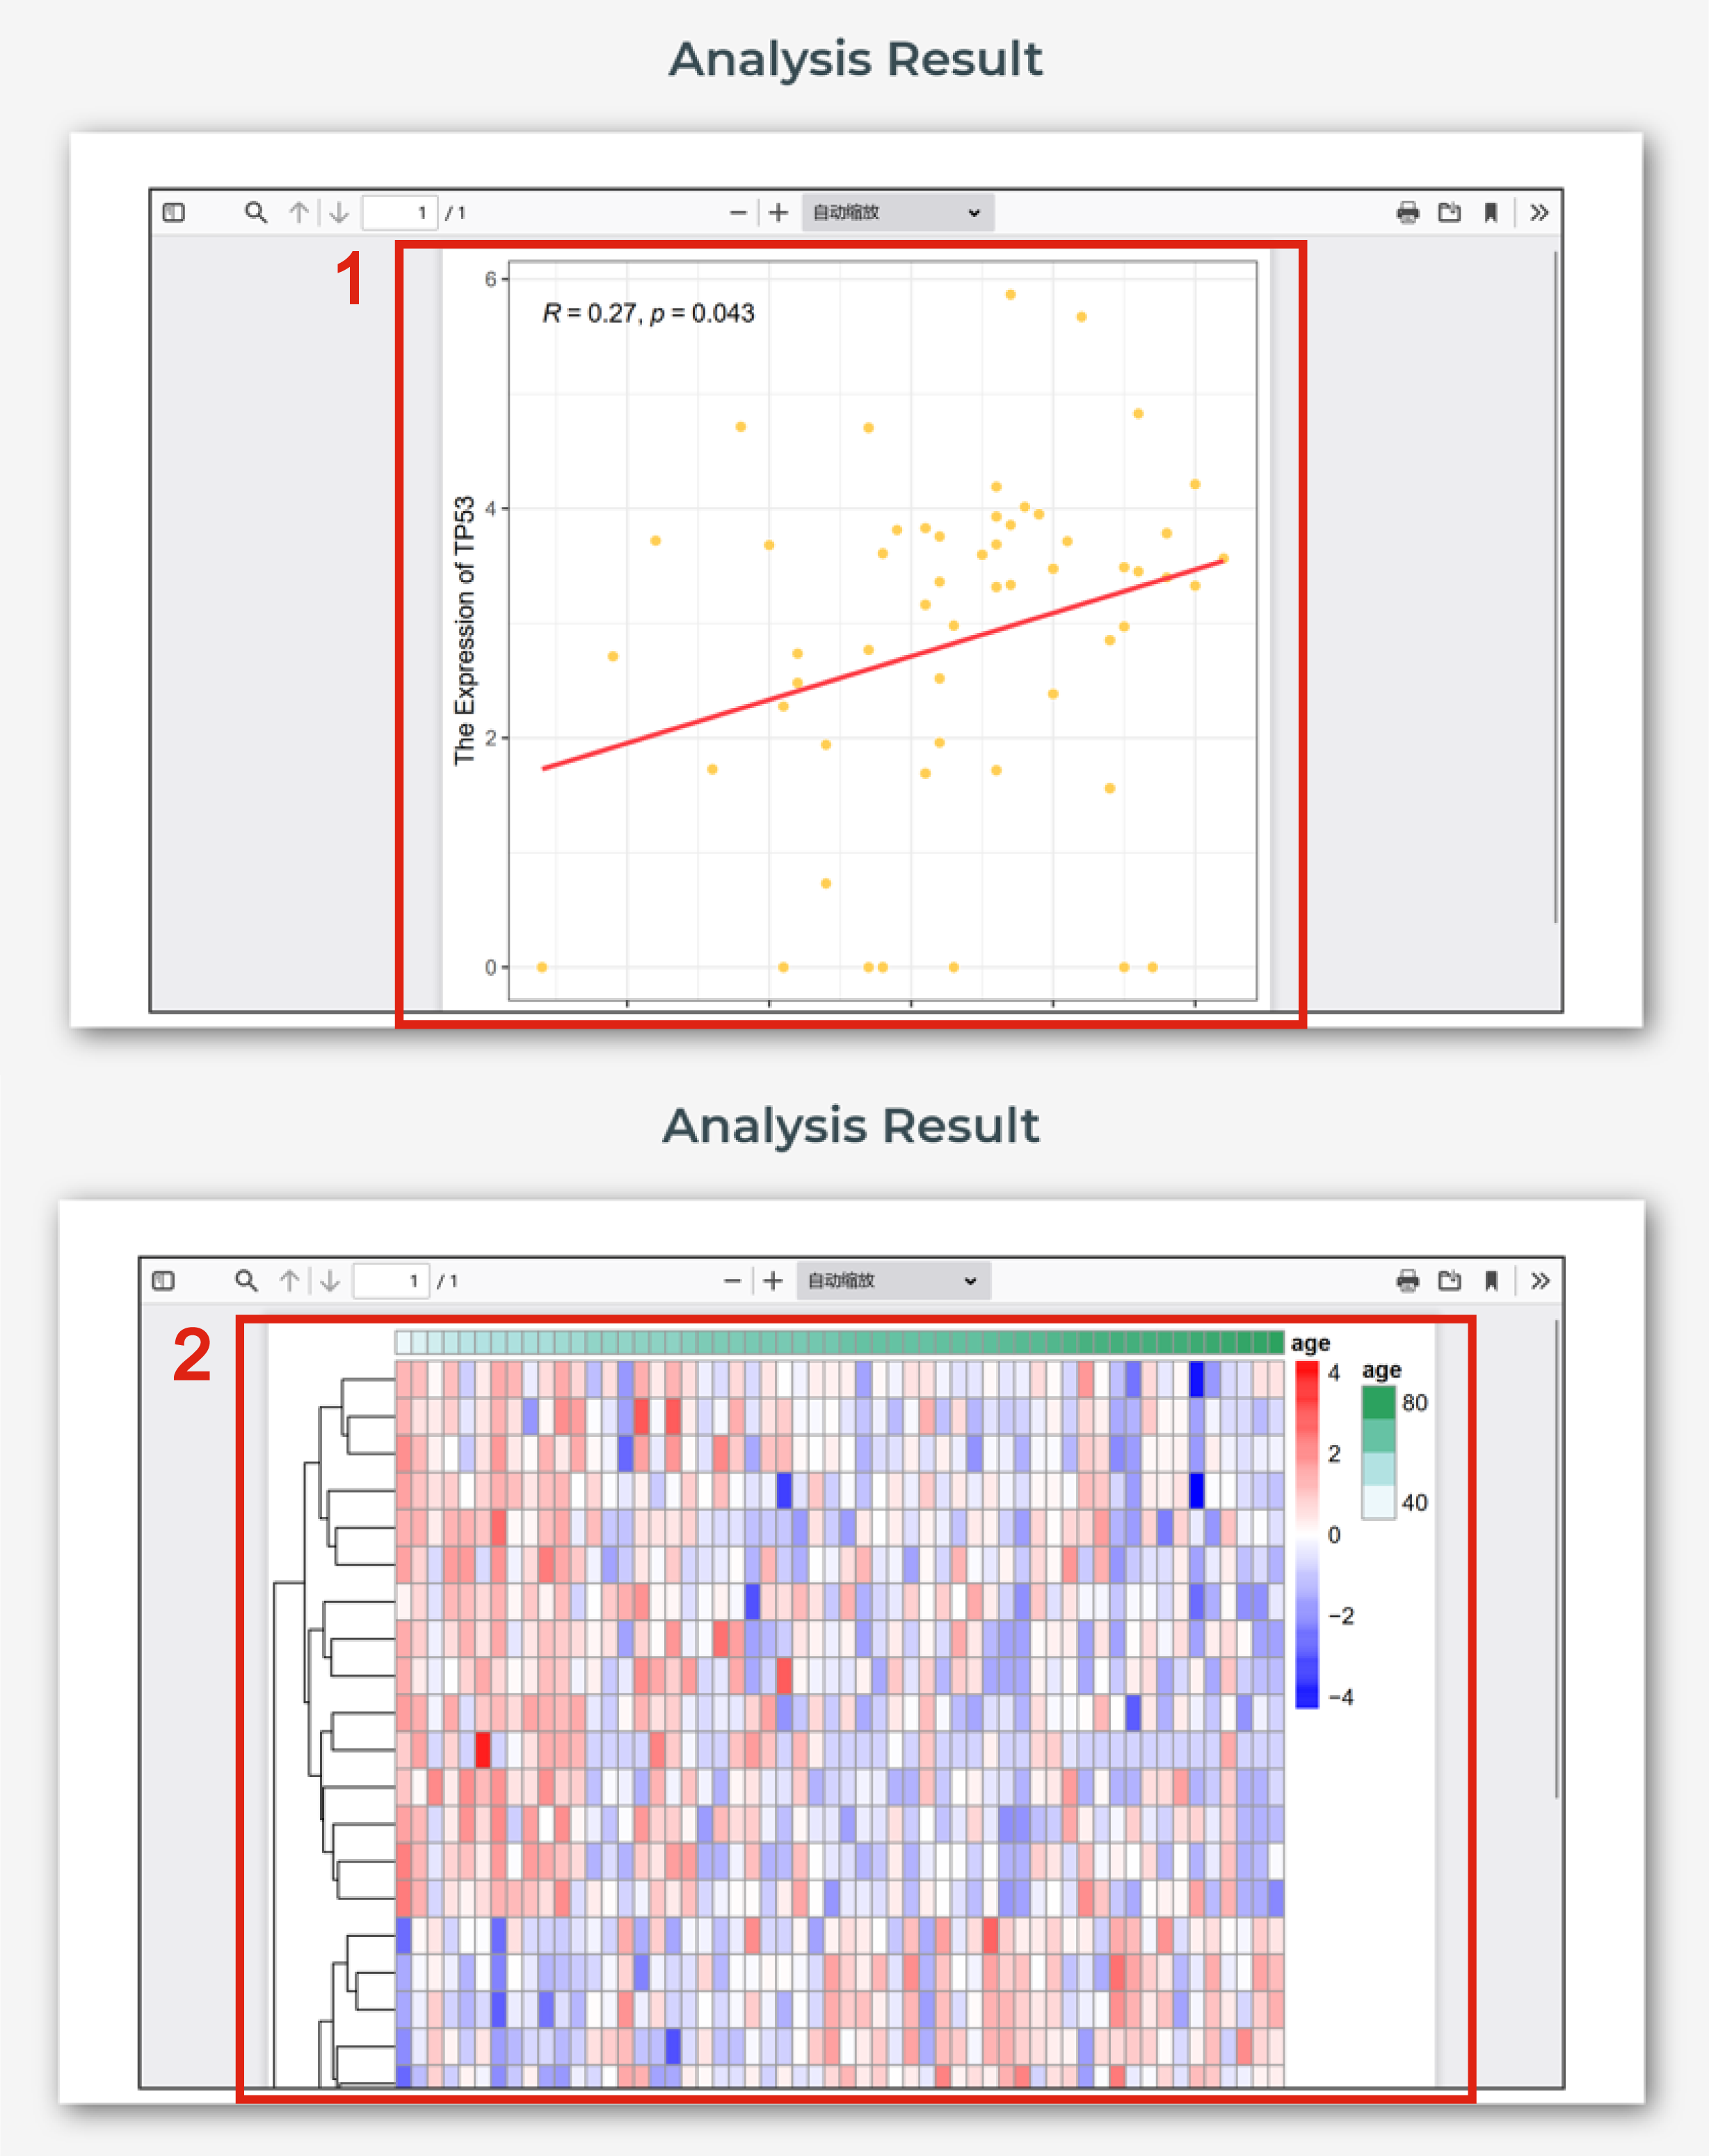
Figure 8-3
Users could download experimentally supported diverse biomarker types and regulatory mechanisms for aging associations.
The Download page is displayed in Figure 9:
1. Click to download all aging-related experimental validated dataset.
2. Click to download aging-related experimental validated dataset in human.
3. Click to download aging-related experimental validated dataset in animal model.
4. Click to download aging-related experimental validated dataset in cell senescence.
5. Click to download aging-related experimental validated genes.
6. Click to download aging-related experimental validated non-coding RNAs.
7. Click to download aging-related experimental validated epigenomes.
8. Click to download aging-related experimental validated other regulatory elements.
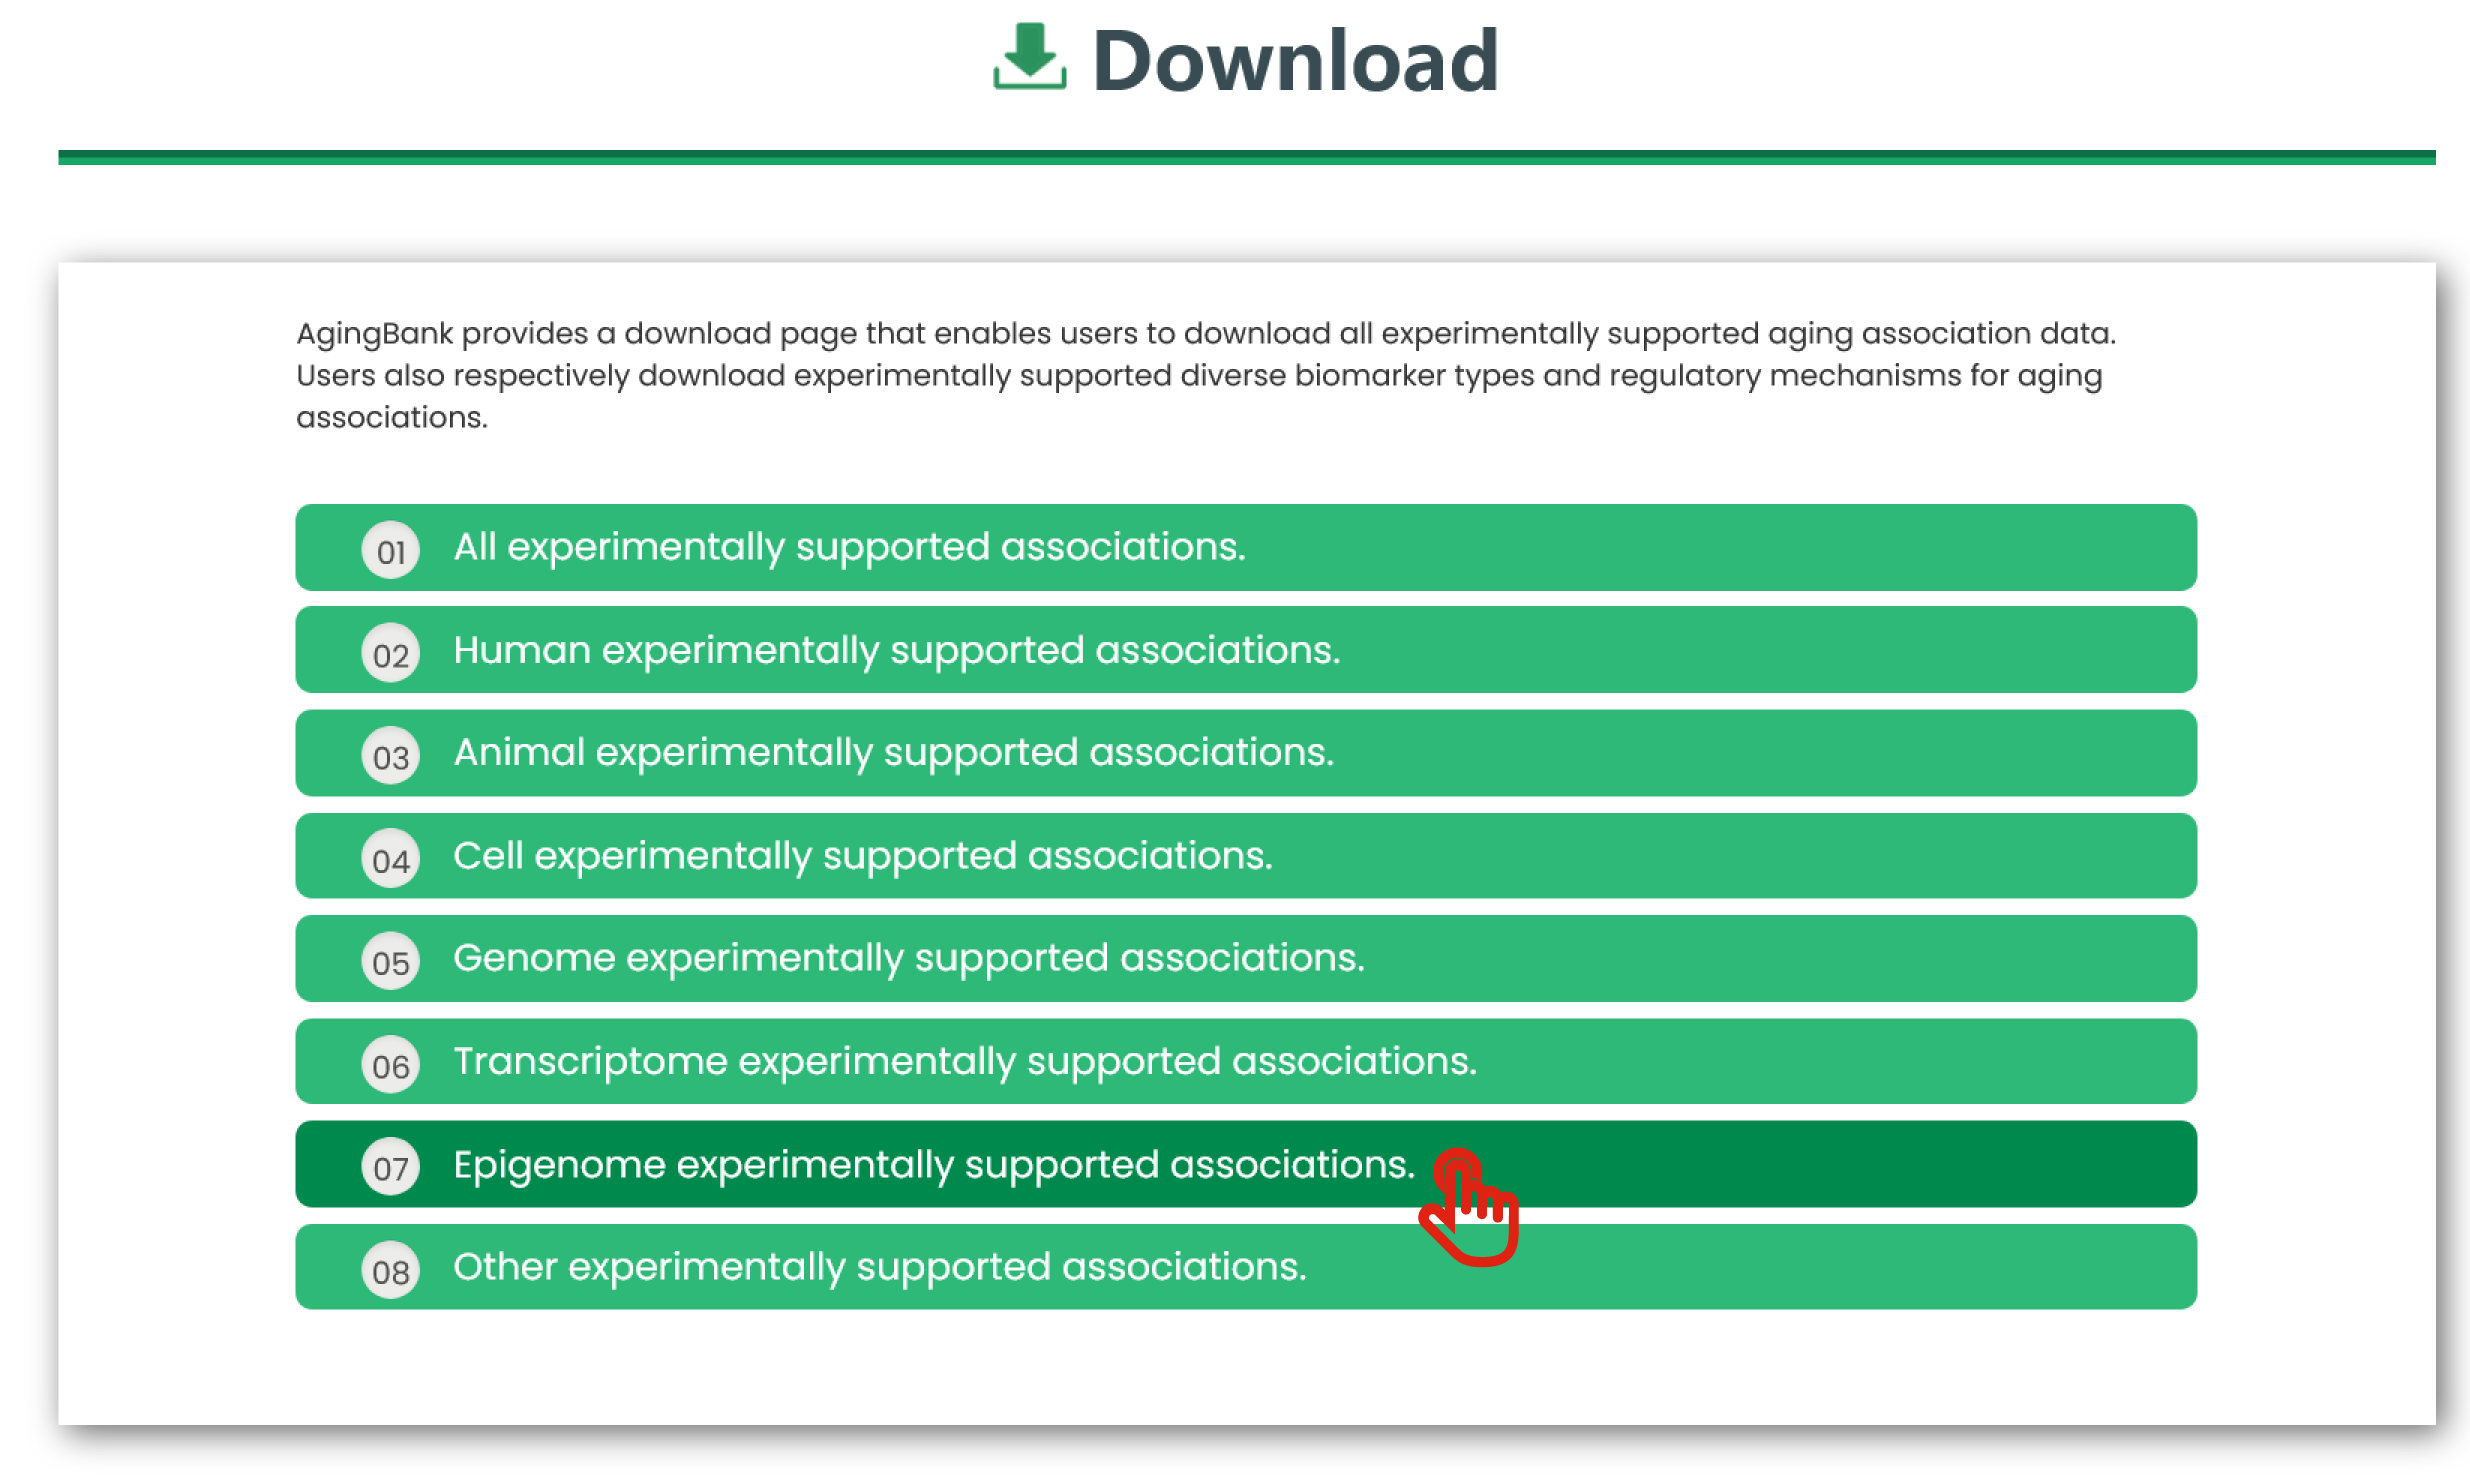
Figure 9