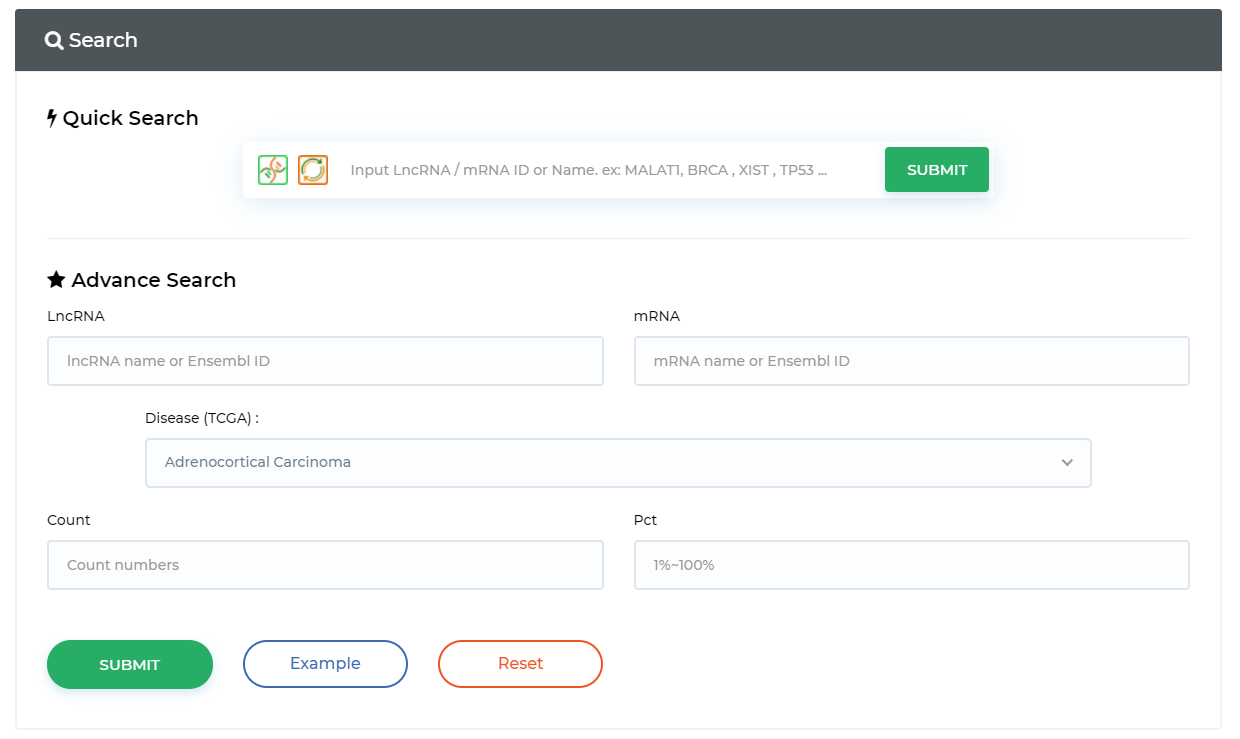
Query ceRNA in prediction data
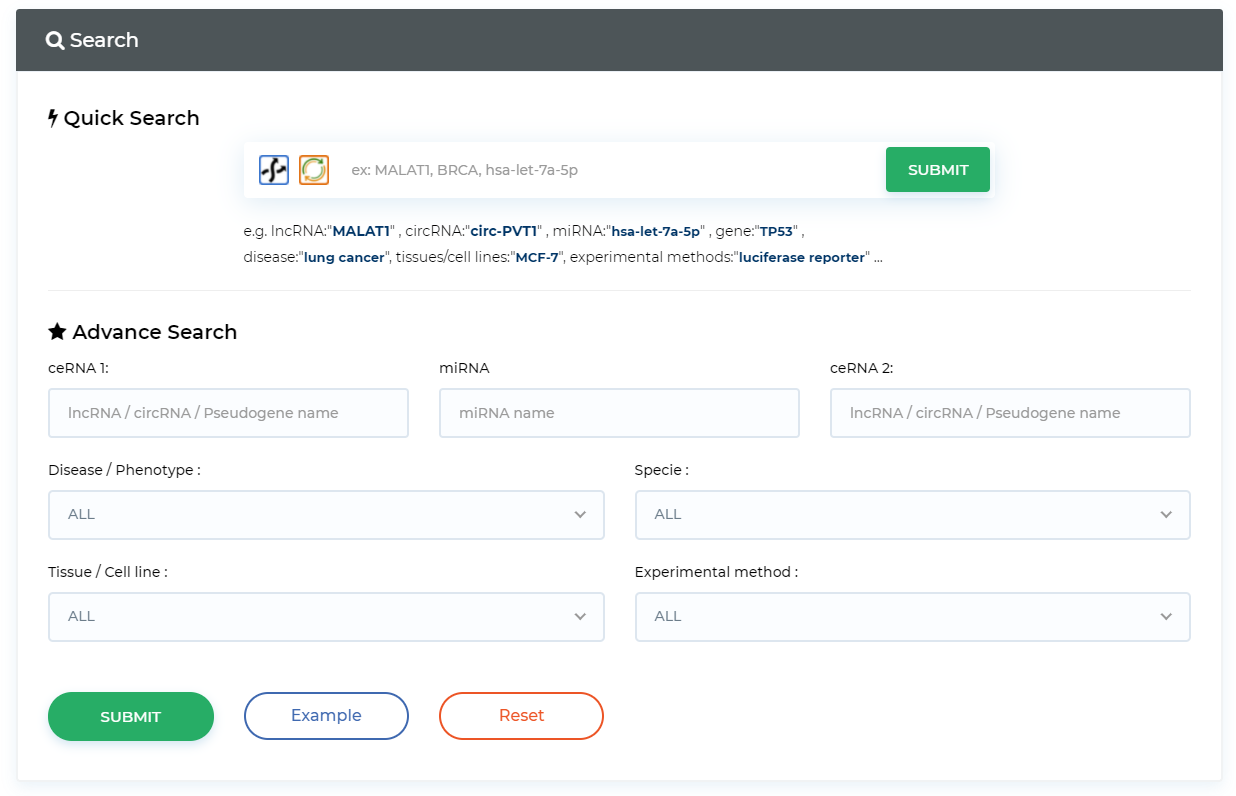
Query ceRNA in experimental validation data
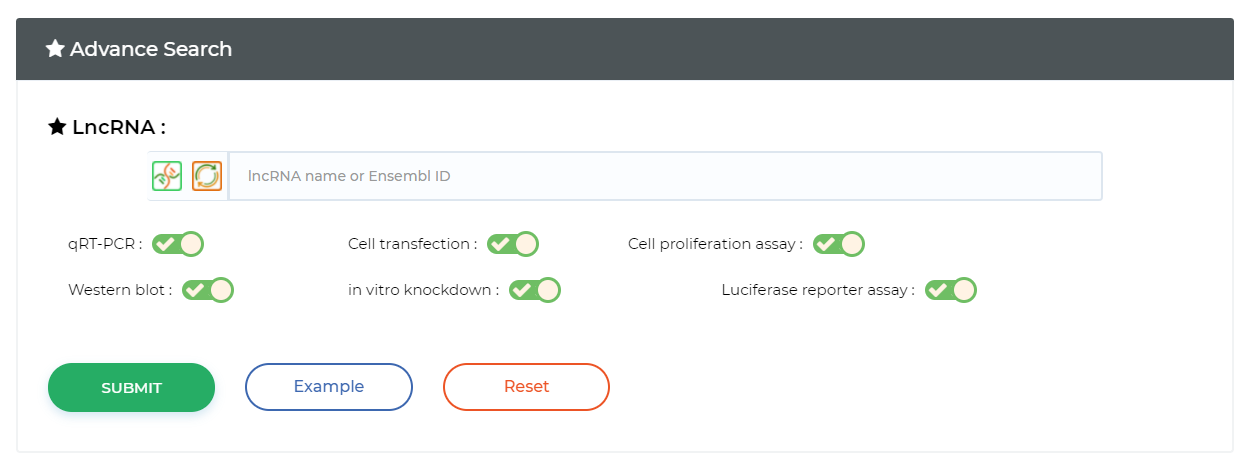
Screening samples based on sample characteristics
Screening queries based on experimental methods Biomarker
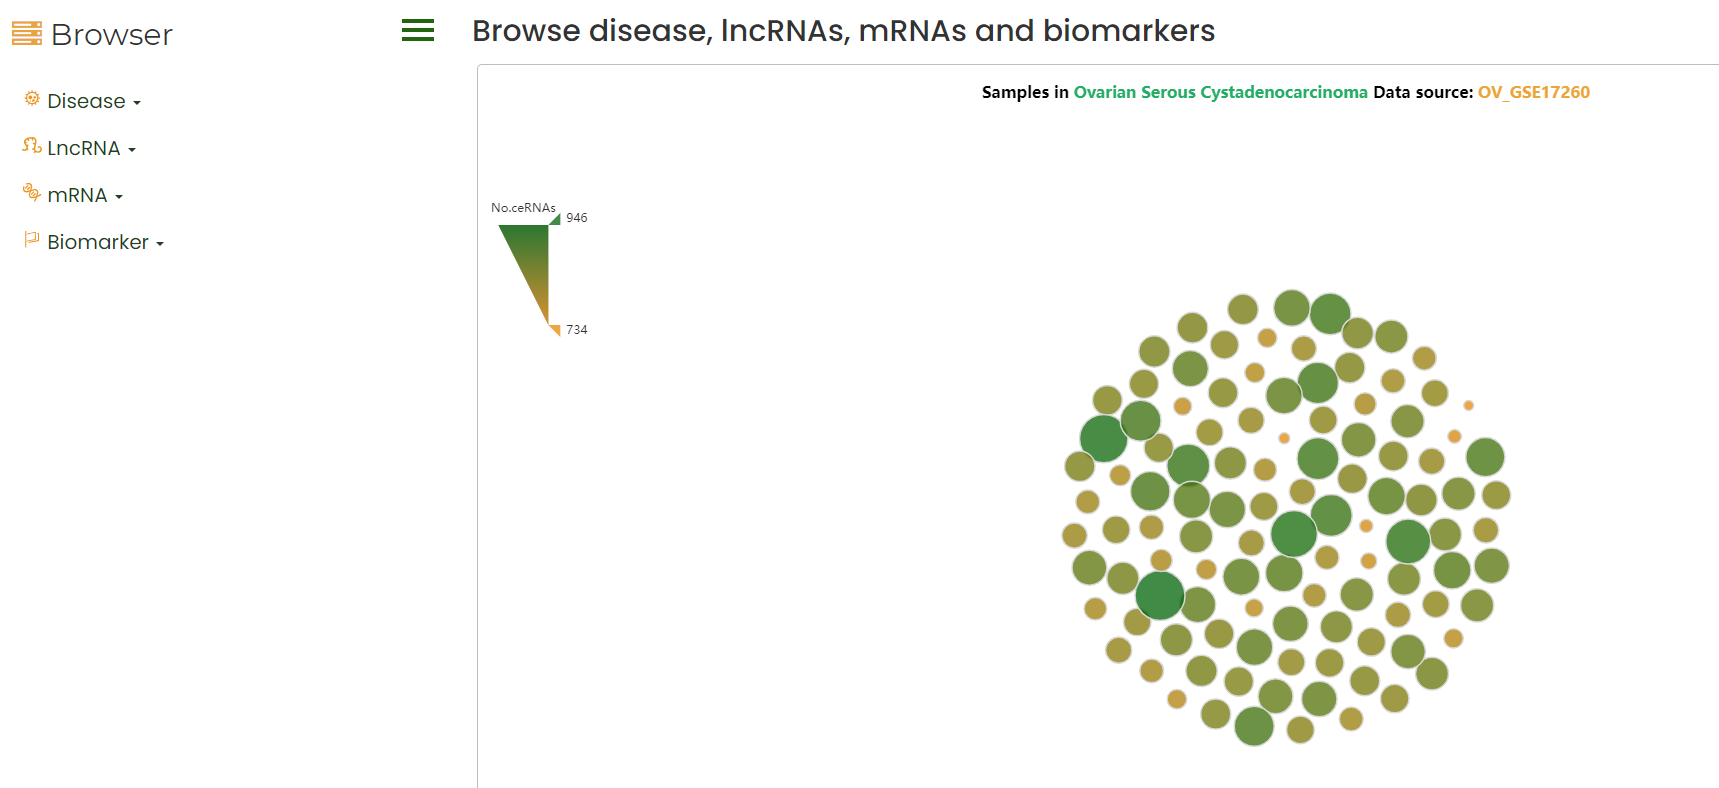
LncACTdb 3.0 Browse
The browser interface allows the user to browse and access all the information of lncACTdb 3.0.
1. Click on the dataset to show the sample ceRNA network;
2. Click on the RNA to show the sample Bodymap;
3. Click on the Biomarker to show the number of entries information.
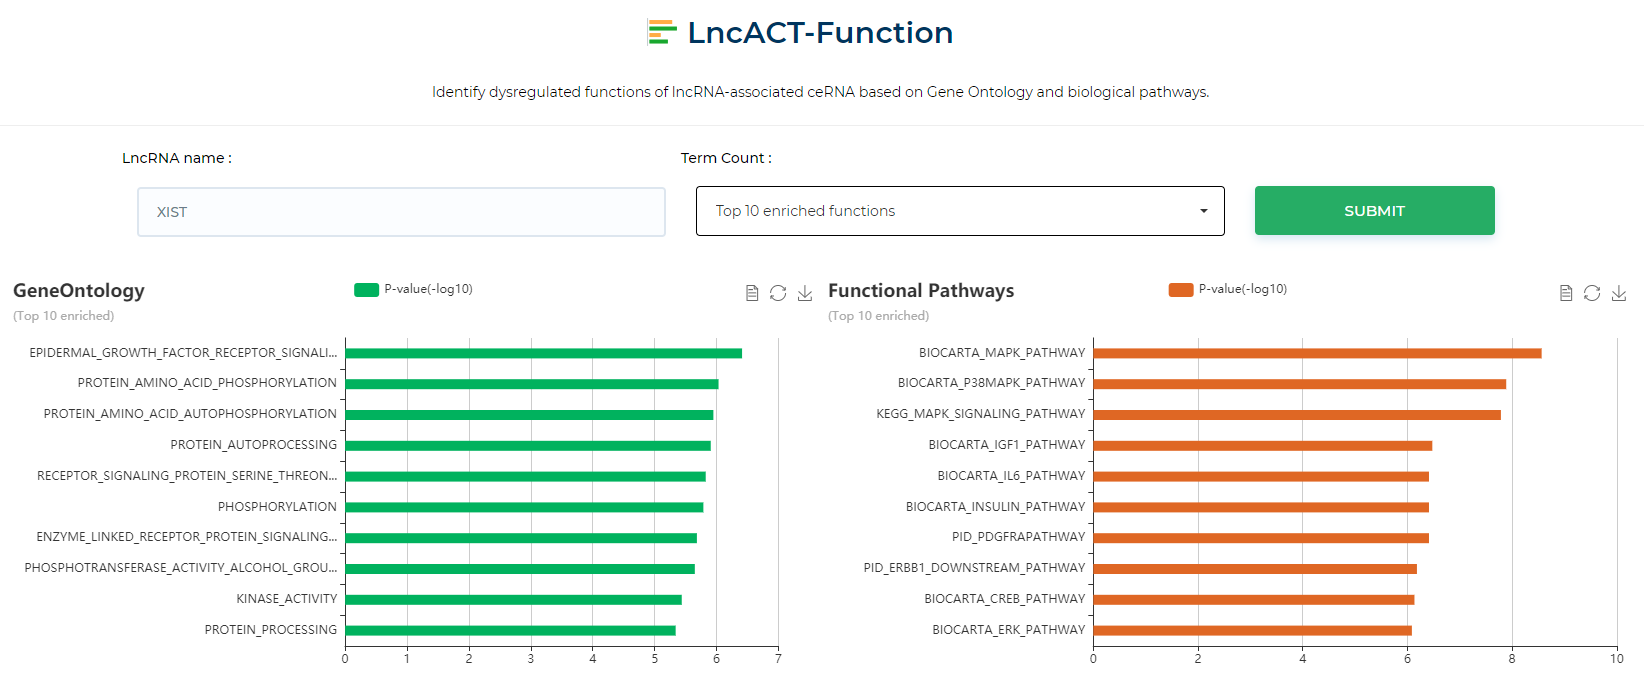
LncACTdb 3.0 : LncACT-Function
LncACTdb 3.0 LncRNA functional enrichment tool, which enriches the regulatory nodes of lncRNAs for functional analysis and presents the results
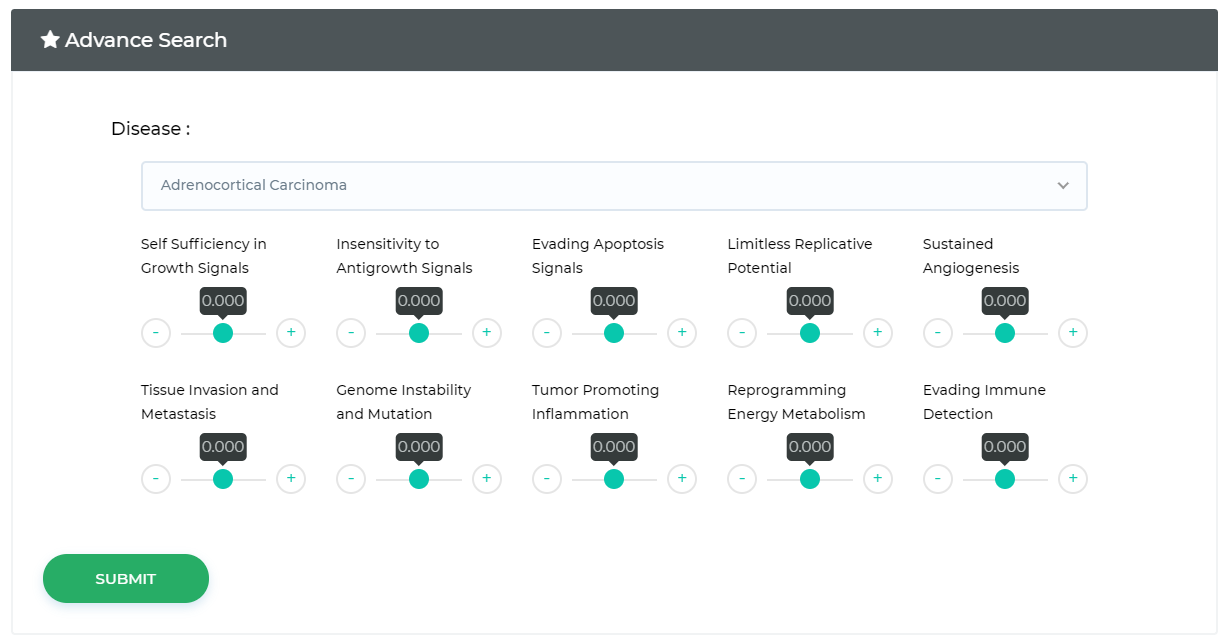
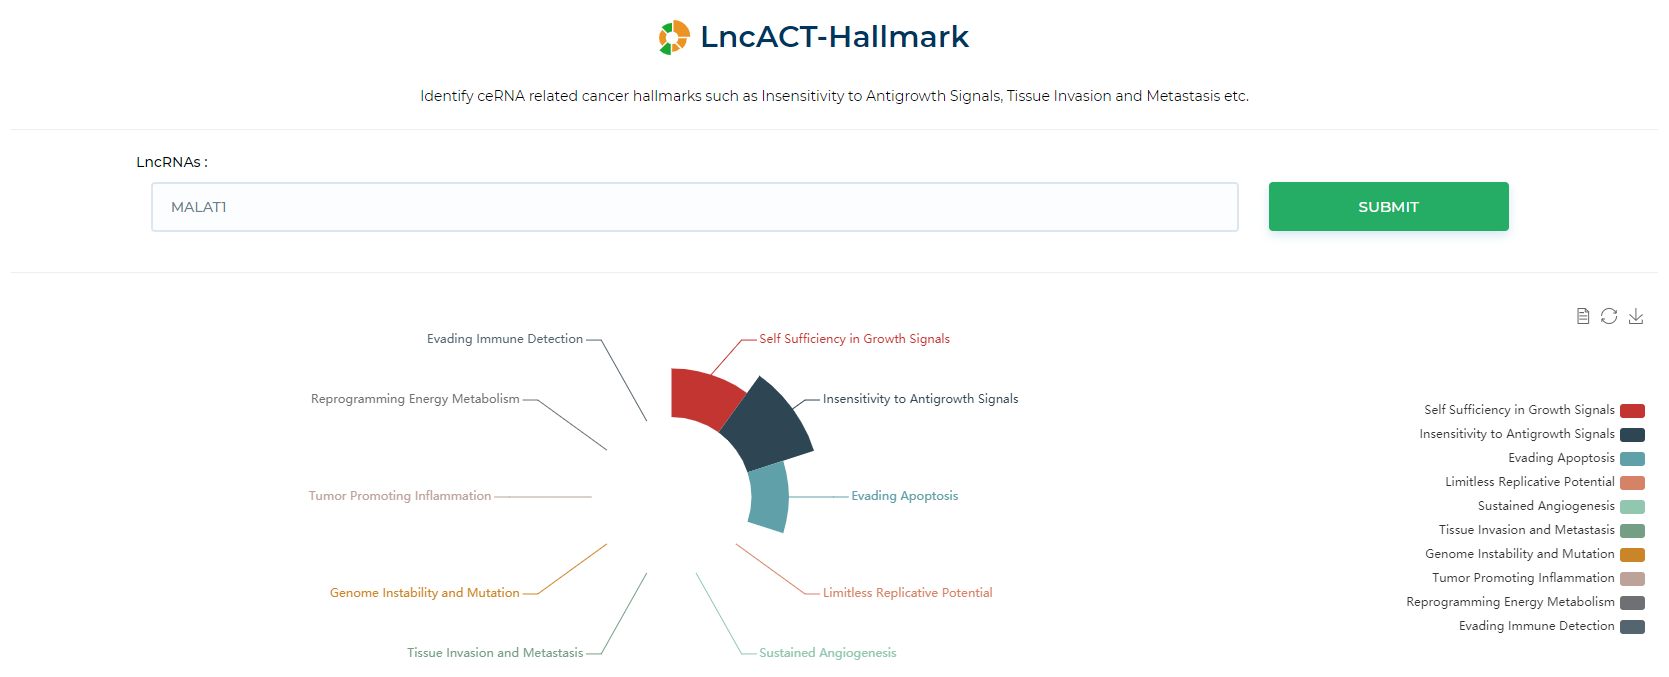
LncACTdb 3.0 : LncACT-Hallmark
Identify ceRNA related cancer hallmarks such as Insensitivity to Antigrowth Signals, Tissue Invasion and Metastasis etc.
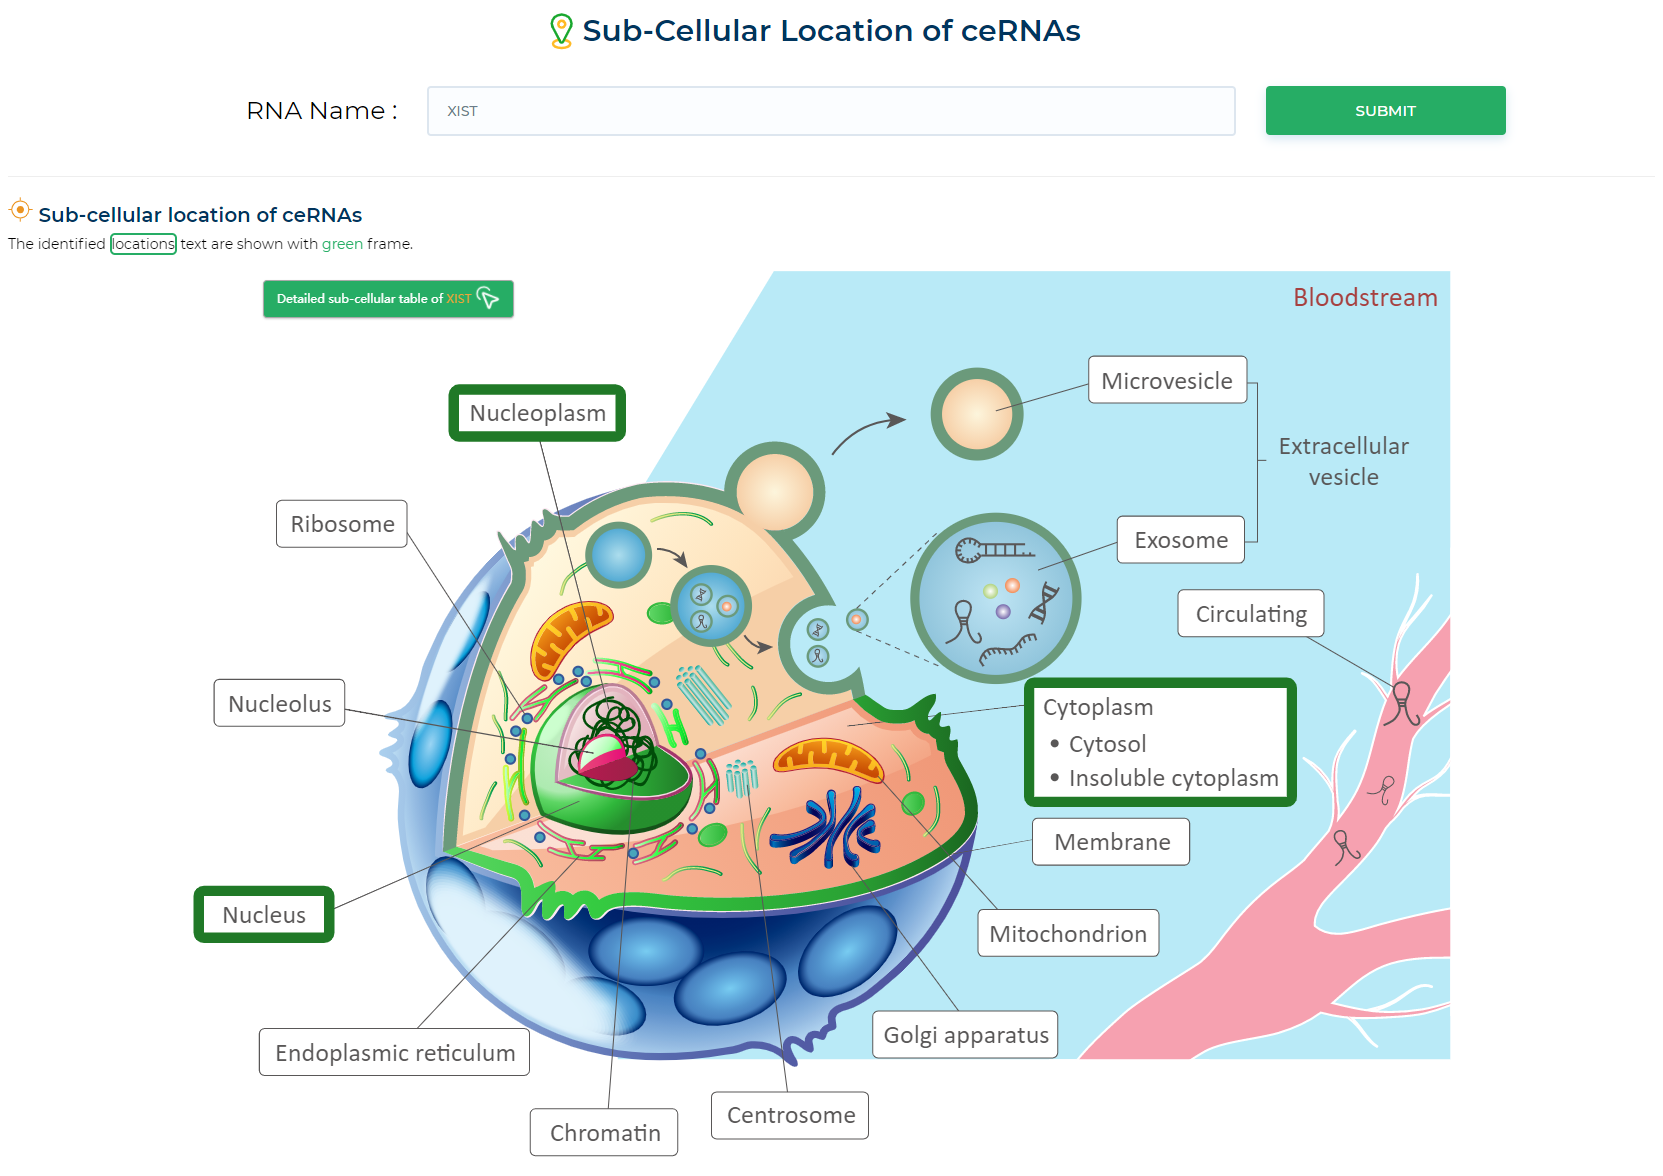
LncACTdb 3.0 : LncACT-Cell Location
The tool shows where in the cell the target gene is located.
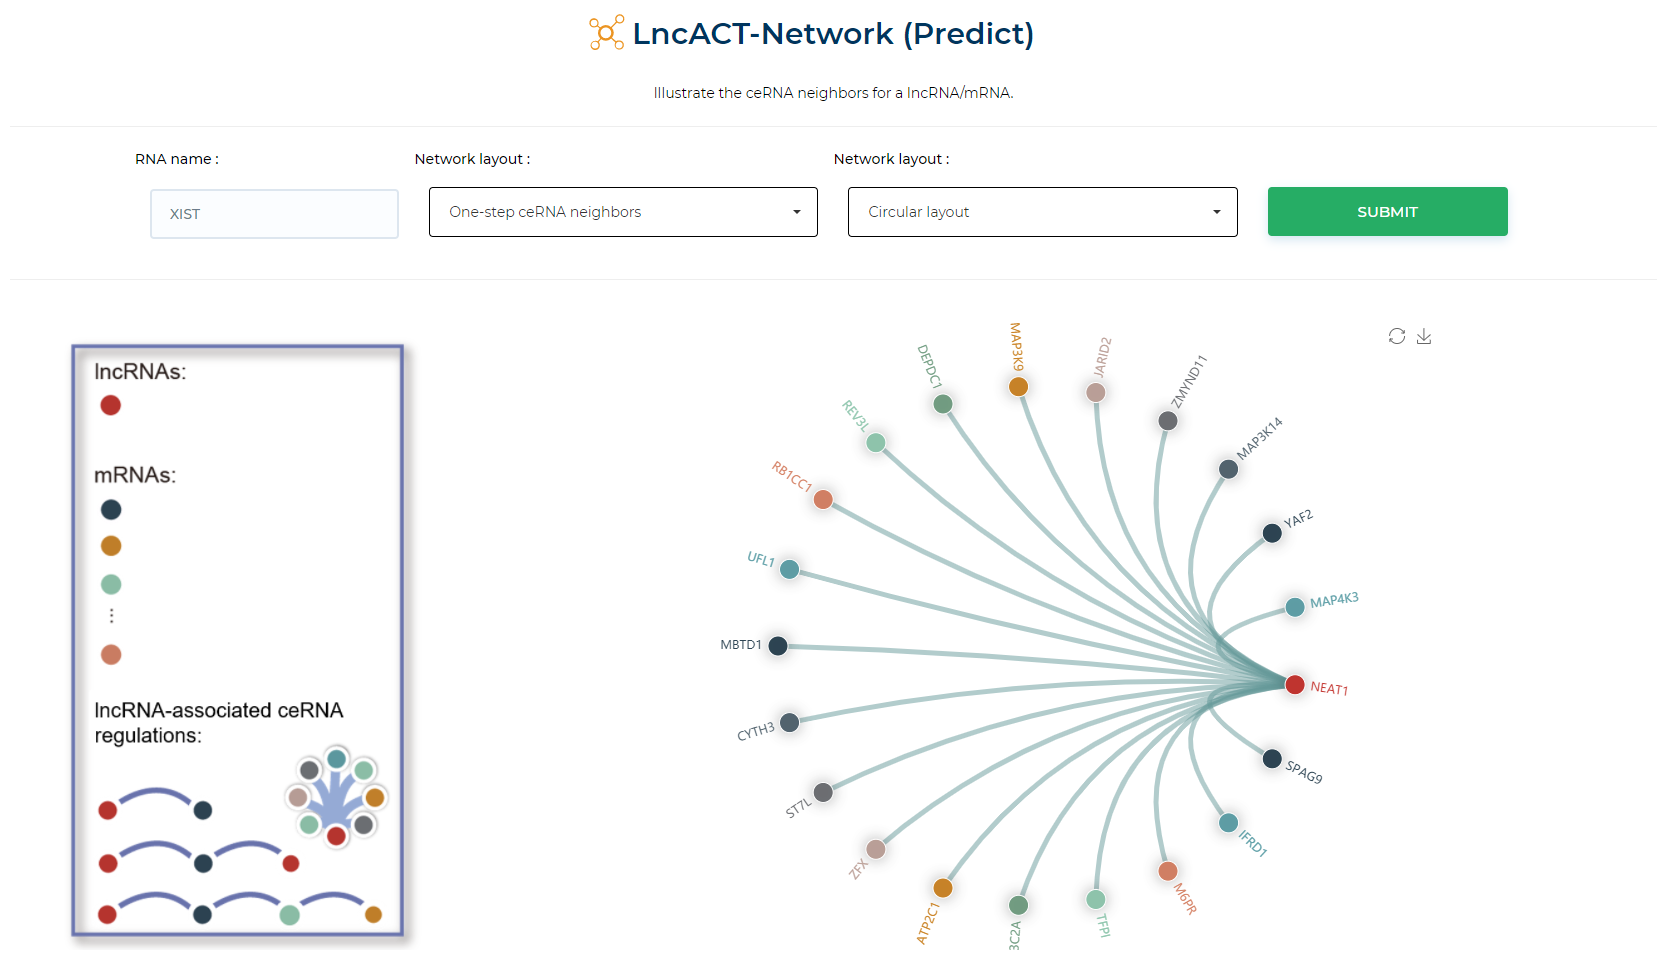
LncACTdb 3.0 : LncACT-Network (Gene-centric)
Illustrate the ceRNA neighbors for a lncRNA/mRNA.
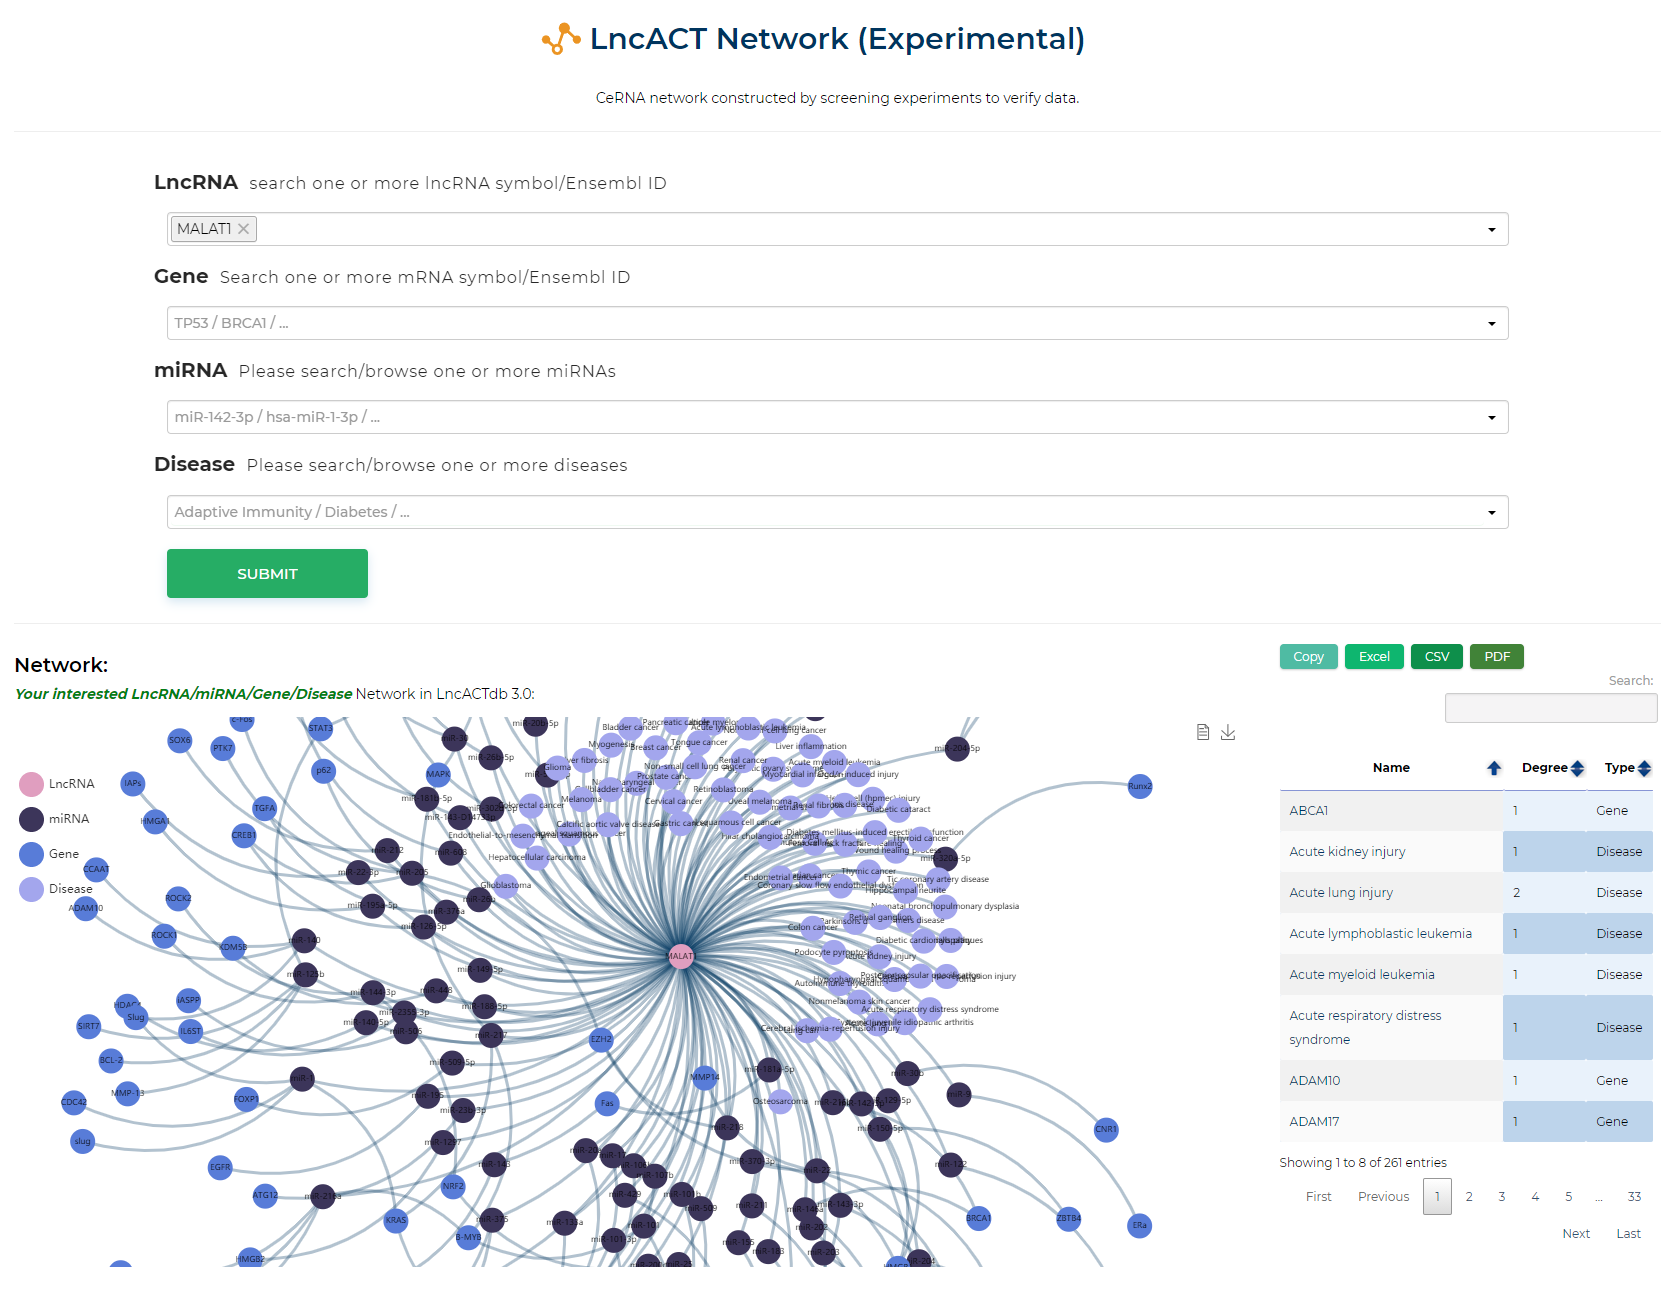
LncACTdb 3.0 : LncACT-Network (User-designed)
CeRNA network constructed by screening experiments to verify data.
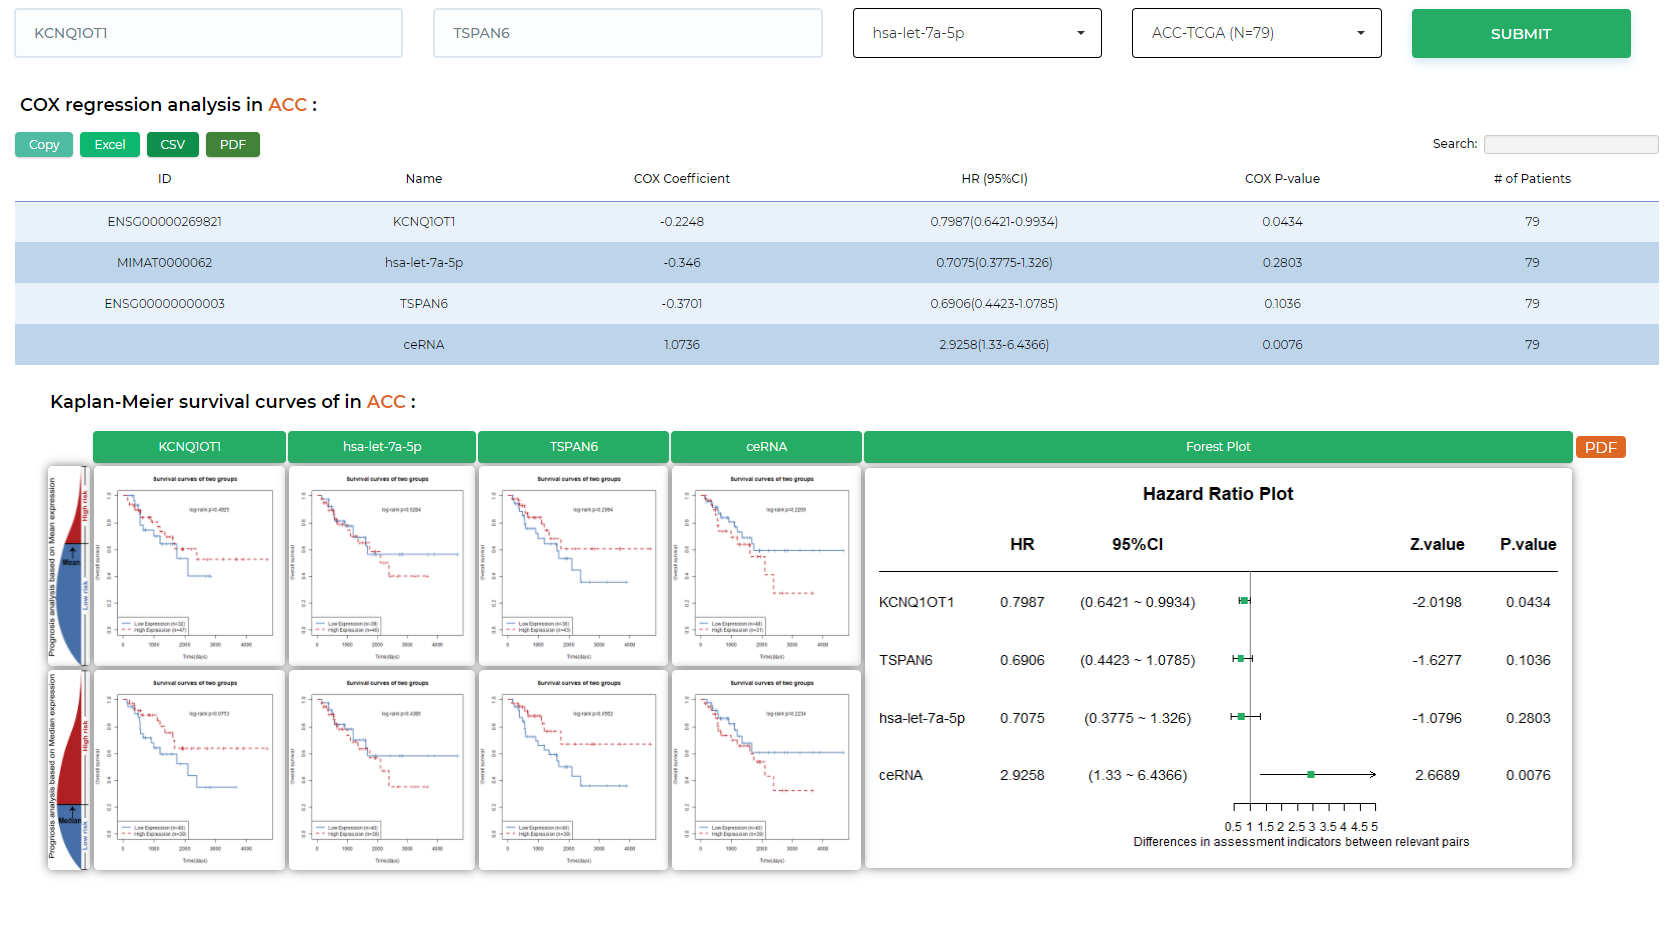
LncACTdb 3.0 : LncACT-Survival
Perform COX regression analysis and survival curves for ceRNAs across more than 30 types of malignant cancers.
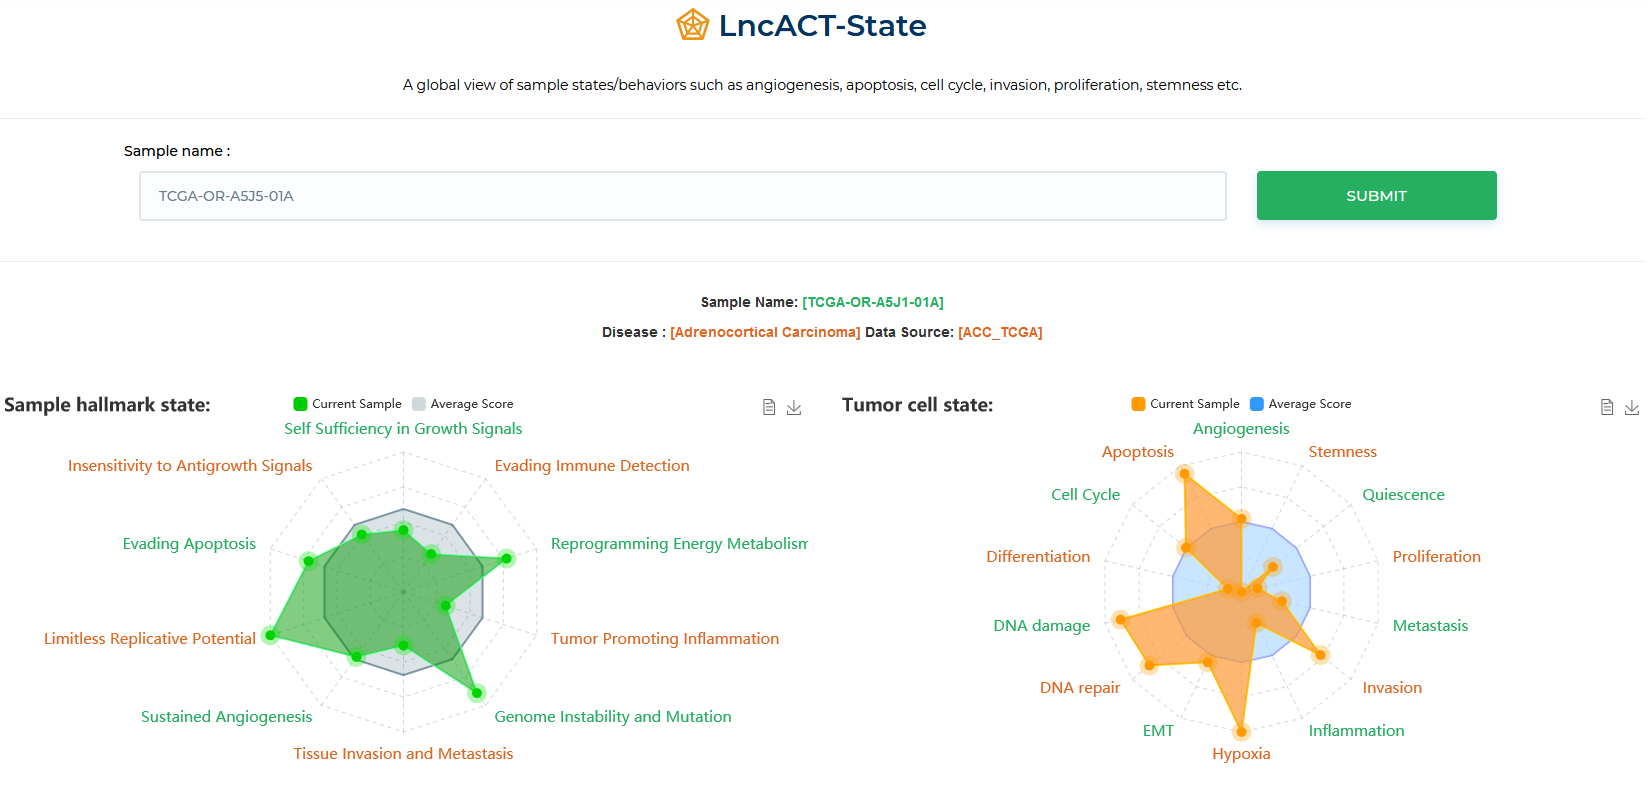
LncACTdb 3.0 : LncACT-State
A global view of sample states/behaviors such as angiogenesis, apoptosis, cell cycle, invasion, proliferation, stemness etc.
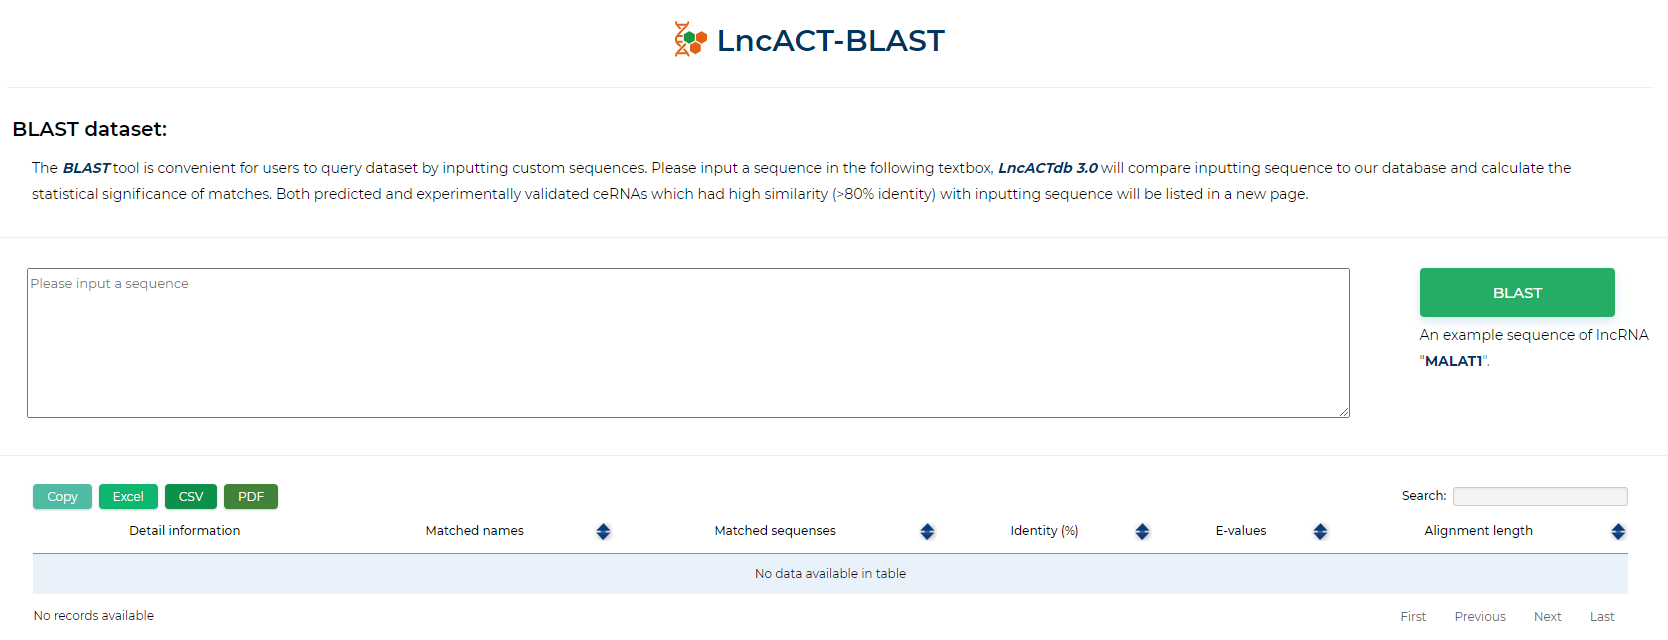
LncACTdb 3.0 : LncACT-BLAST
The BLAST tool is convenient for users to query dataset by inputting custom sequences. Please input a sequence in the following textbox, LncACTdb 3.0 will compare inputting sequence to our database and calculate the statistical significance of matches. Both predicted and experimentally validated ceRNAs which had high similarity (>80% identity) with inputting sequence will be listed in a new page.
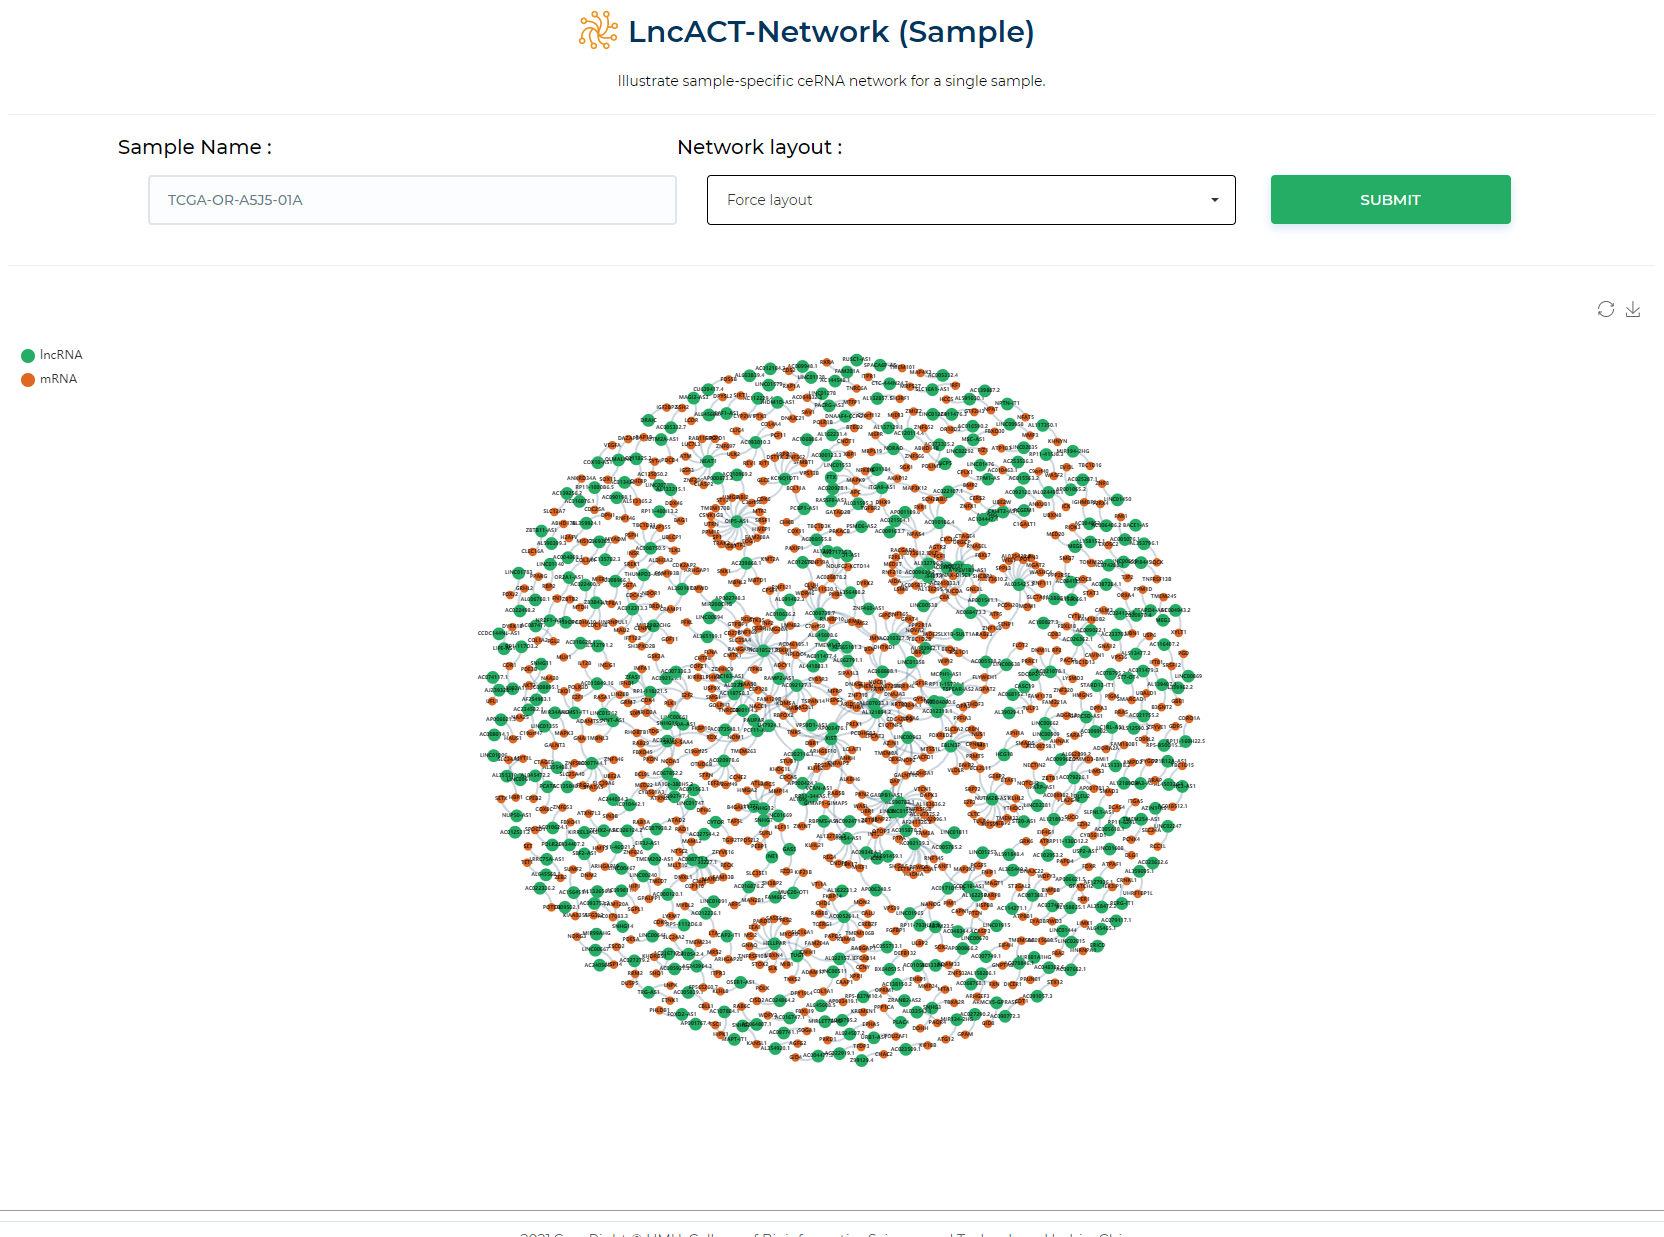
LncACTdb 3.0 : LncACT-Network (Patient-specific)
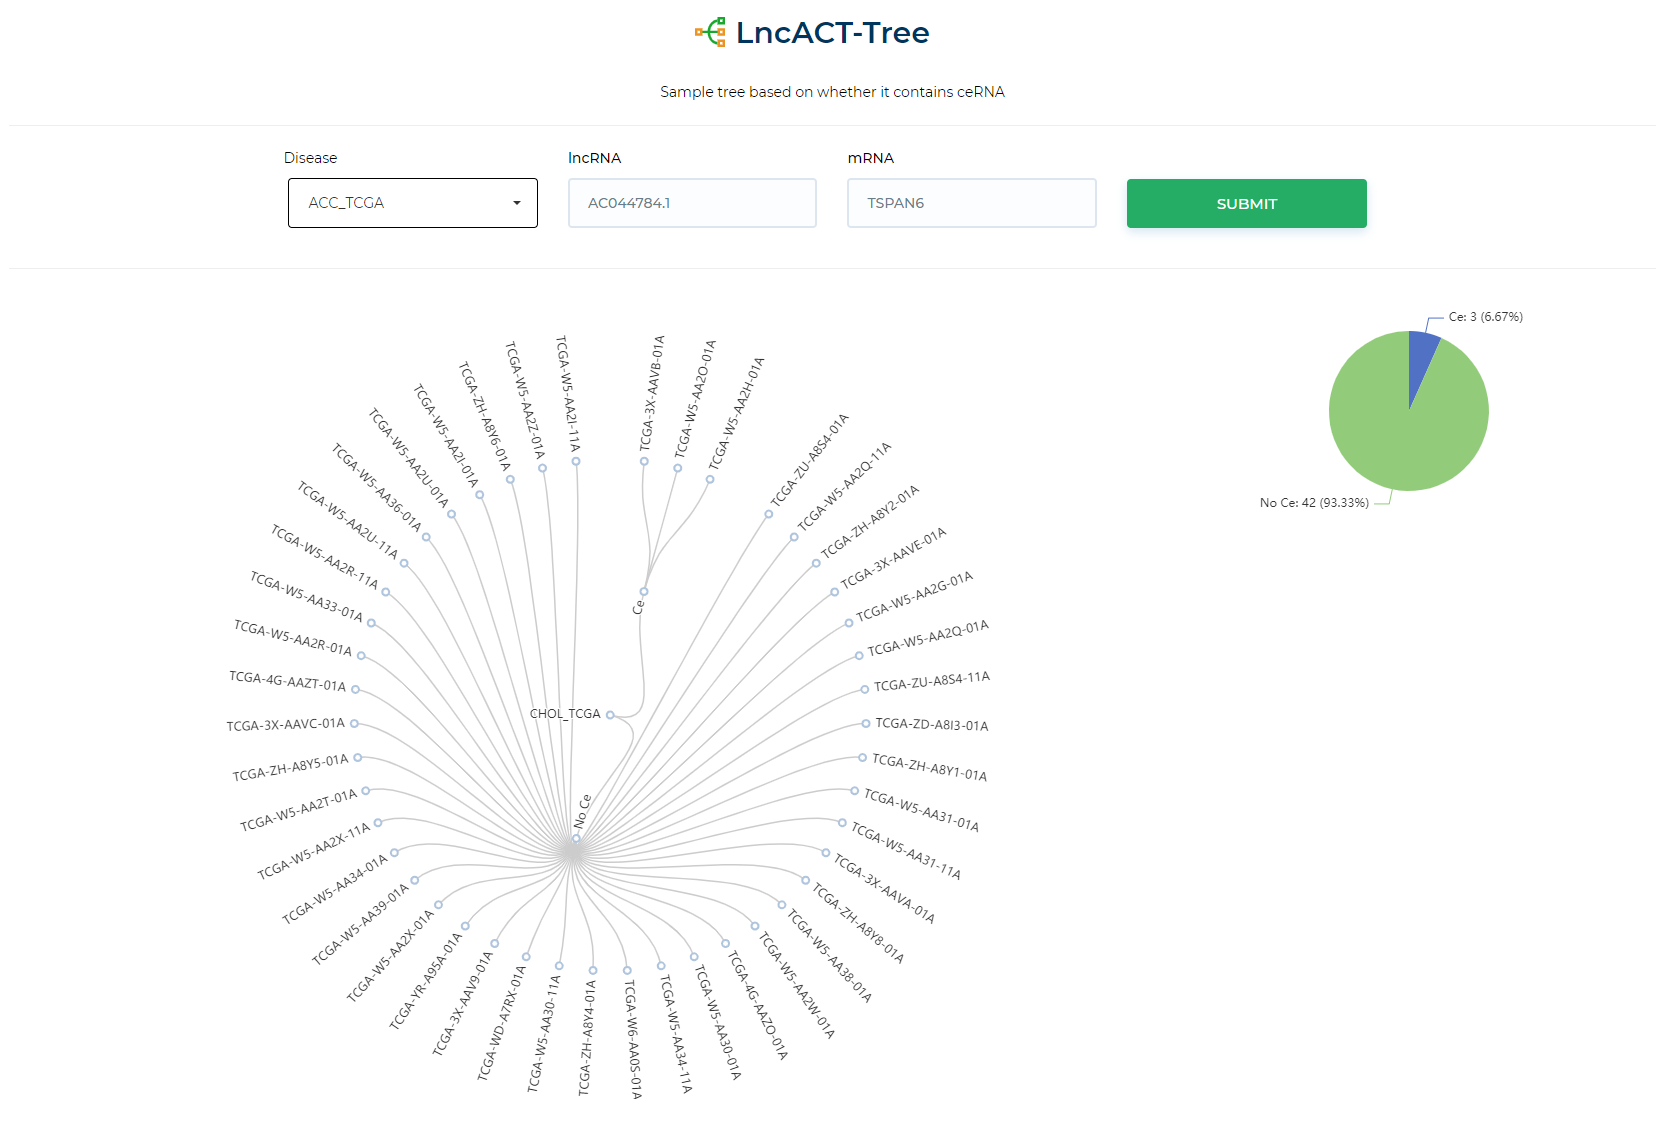
Illustrate sample-specific ceRNA network for a single sample.