Help
|
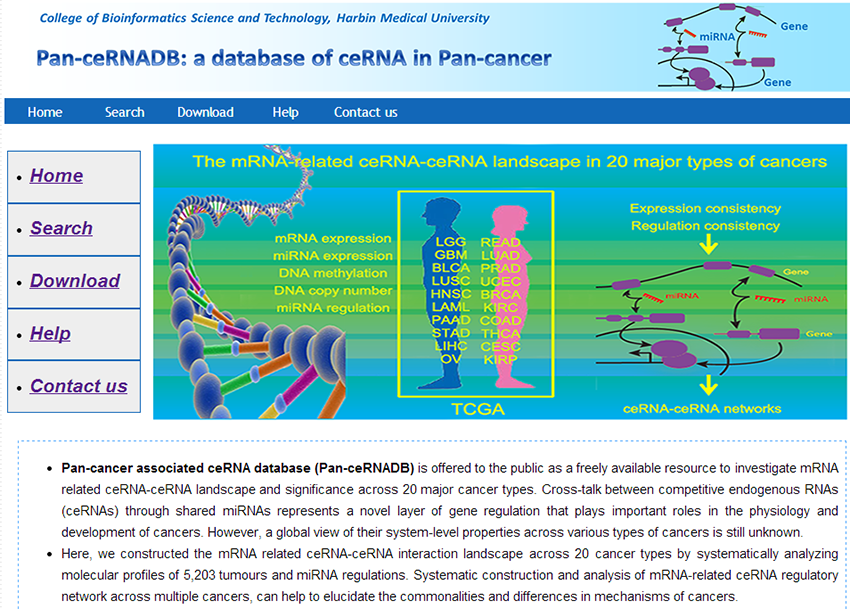 |
| Figure 1. The homepage of the Pan-ceRNADB. |
|
|---|
Level-1: A central tenet of our hypothesis is that trans-regulatory ceRNA crosstalk increased with the high miRNA regulatory similarity between mRNAs and their strong co-expression in specific cancer (Figure 2). Firstly, a hypergeometric test is used to compute the significance of shared miRNAs for each possible gene pairs (detailed description can be found in supplemental method). Moreover, the number of shared miRNAs is required to at least three. All P-values were subject to false discovery rate (FDR) correction, and mRNA pairs with FDR less than 0.01 were considered as candidate ceRNA interaction pairs. Depending on the total number of functional miR-binding sites that they share with a target, ceRNA modulators can decrease the number of free miR molecules available to repress other target genes. This indicated that the expression of ceRNA pairs was positively correlated with each other. To identify the active ceRNA pairs in a specific cancer, we computed the Pearson correlation coefficient (R) of each candidate ceRNA pairs identified above. All the candidate ceRNA pairs with R>0 and p-adjusted<0.05 were identified as ceRNA-ceRNA interactions. |
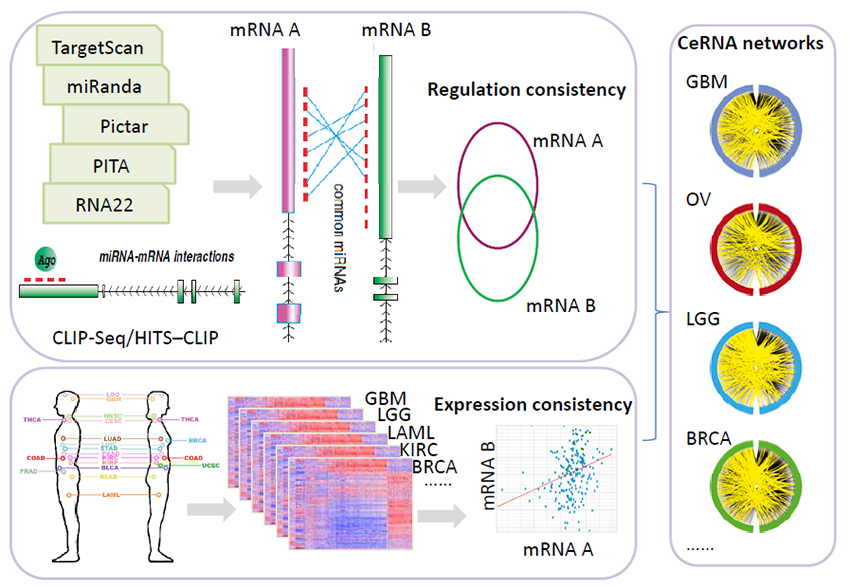 |
| Figure 2. The workflow to construct the ceRNA-ceRNA interaction network in specific cancer. |
Level-2: With the increasement of miRNA expression, DNA methylation and DNA copy number available for the same tumors, integration of these information may provide further evidence that the two correlated genes are competitively binding same miRNAs. The multivariate linear model could measure the expression association between a miRNA and a mRNA, that also factors in variation (noise) in mRNA expression induced by changes in DNA copy number and promoter methylation at the mRNA gene locus. In this regression model, the gene expression, changes as a linear function of DNA copy number, DNA methylation and miRNA expression. Then we used the ordinary least square method to obtain an estimate for the coefficient of miRNA, and test the null hypothesis the expression of the miRNA is not associated with change in expression of this gene. The association of miRNA and mRNA were obtained in ten types of cancers and a miRNA-mRNA pair was considered as associated if the FDR is under 0.05. And then integrated with the CLIP-seq supported target sites in the main text, we obtained the cancer specific miRNA-mRNA regulations. Next, we performed the same procedure (by considering the shared miRNAs and coexpression) and reconstructed the ceRNA-ceRNA networks in each cancer. |
3. Search the ceRNA interactions of interesting mRNAs |
|---|
Users can input a mRNA of interest (e.g. PTEN) and choose one type of cancer (e.g. Glioblastoma multiforme) to view the ceRNA-ceRNA interactions in specific cancer. The official mRNA gene name is expected as the keyword. The search result list includes the query mRNA, the inferred ceRNAs of this mRNA and the regulation and expression consistency of these ceRNAs. |
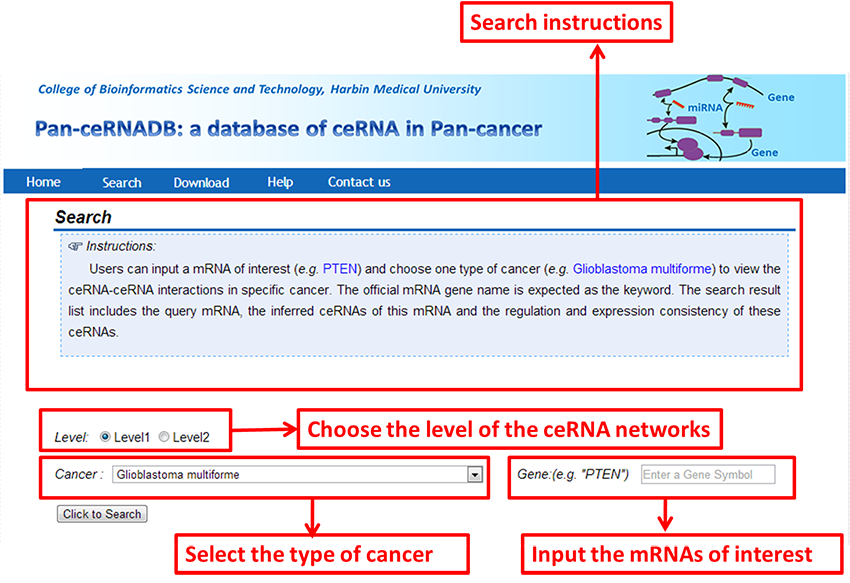 |
| Figure 3. The searching page of the Pan-ceRNADB. |
4. The results page of searching ceRNA interactions |
|---|
The resulting table shows the ceRNA-ceRNA pairs of the searched mRNAs, the first column shows the abbreviation name of the cancer, the second column shows the ceRNA-1 and the next column shows the ceRNA-2. The fourth column shows the signigicance of coregulation by miRNAs of these two ceRNAs. The fifth and sixth columns show the Pearson correlation coefficient and significance of two ceRNAs in expression. The last column shows the number of miRNAs shared by these two ceRNAs. 'Click' of the number will show detail information of common miRNAs. For the level 2 datasets, the miRNAs correspoding to the maximum sensitivity correlation score were marked with red color and the p-values were labeld in the bracket. |
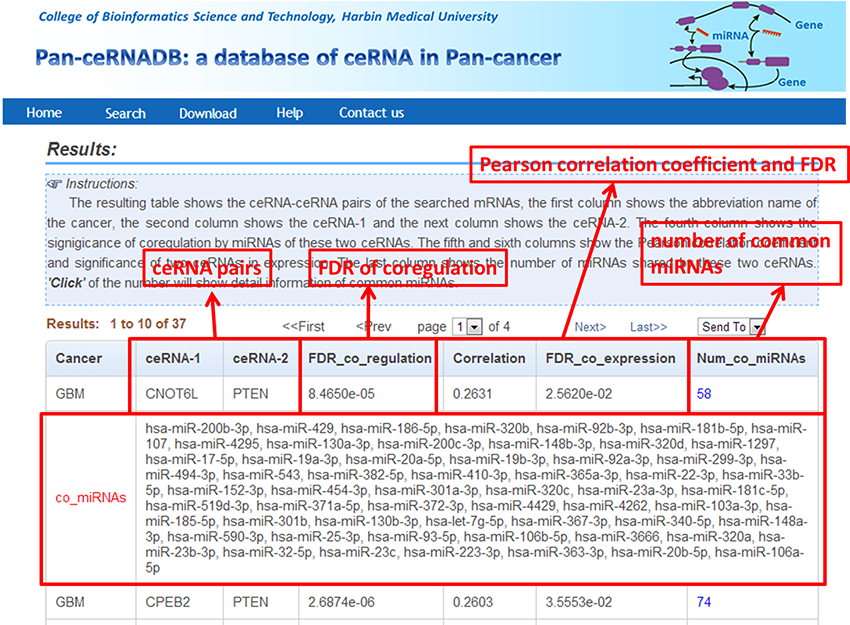 |
| Figure 4. The result page of the Pan-ceRNADB. |
5. Download |
|---|
Pan-ceRNADB is offered to the public as a freely available resource. Here, users can obtain the infered ceRNA-ceRNA interactions in specific cancers. The level 1 datasets included the ceRNA networks without integration of miRNA expression, DNA methylation and copy number variation. The level 2 datasets included the integrated ceRNA networks in ten types of cancer. |
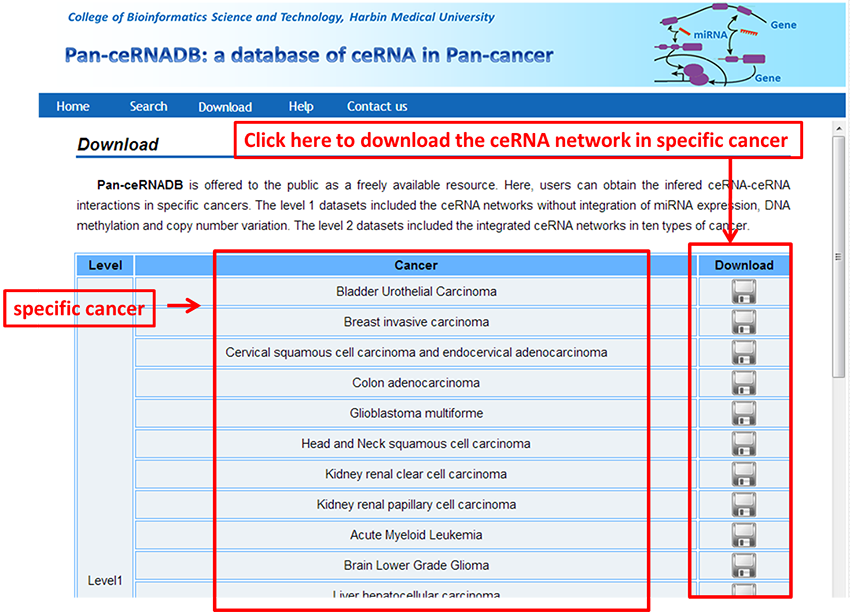 |
| Figure 5. The download page of the Pan-ceRNADB. |
6. Cancer name abbreviations |
|---|
| Abbreviations | Cancer |
| LGG | Brain Lower Grade Glioma |
| GBM | Glioblastoma multiforme |
| BLCA | Bladder Urothelial Carcinoma |
| LUSC | Lung squamous cell carcinoma |
| HNSC | Head and Neck squamous cell carcinoma |
| LAML | Acute Myeloid Leukemia |
| PAAD | Pancreatic adenocarcinoma |
| STAD | Stomach adenocarcinoma |
| LIHC | Liver hepatocellular carcinoma |
| OV | Ovarian serous cystadenocarcinoma |
| READ | Rectum adenocarcinoma |
| LUAD | Lung adenocarcinoma |
| PRAD | Prostate adenocarcinoma |
| UCEC | Uterine Corpus Endometrioid Carcinoma |
| BRCA | Breast invasive carcinoma |
| KIRC | Kidney renal clear cell carcinoma |
| COAD | Colon adenocarcinoma |
| THCA | Thyroid carcinoma |
| CESC | Cervical and endocervical cancers |
| KIRP | Kidney renal papillary cell carcinoma |