Home
Search
Browse
Download
Help
Home
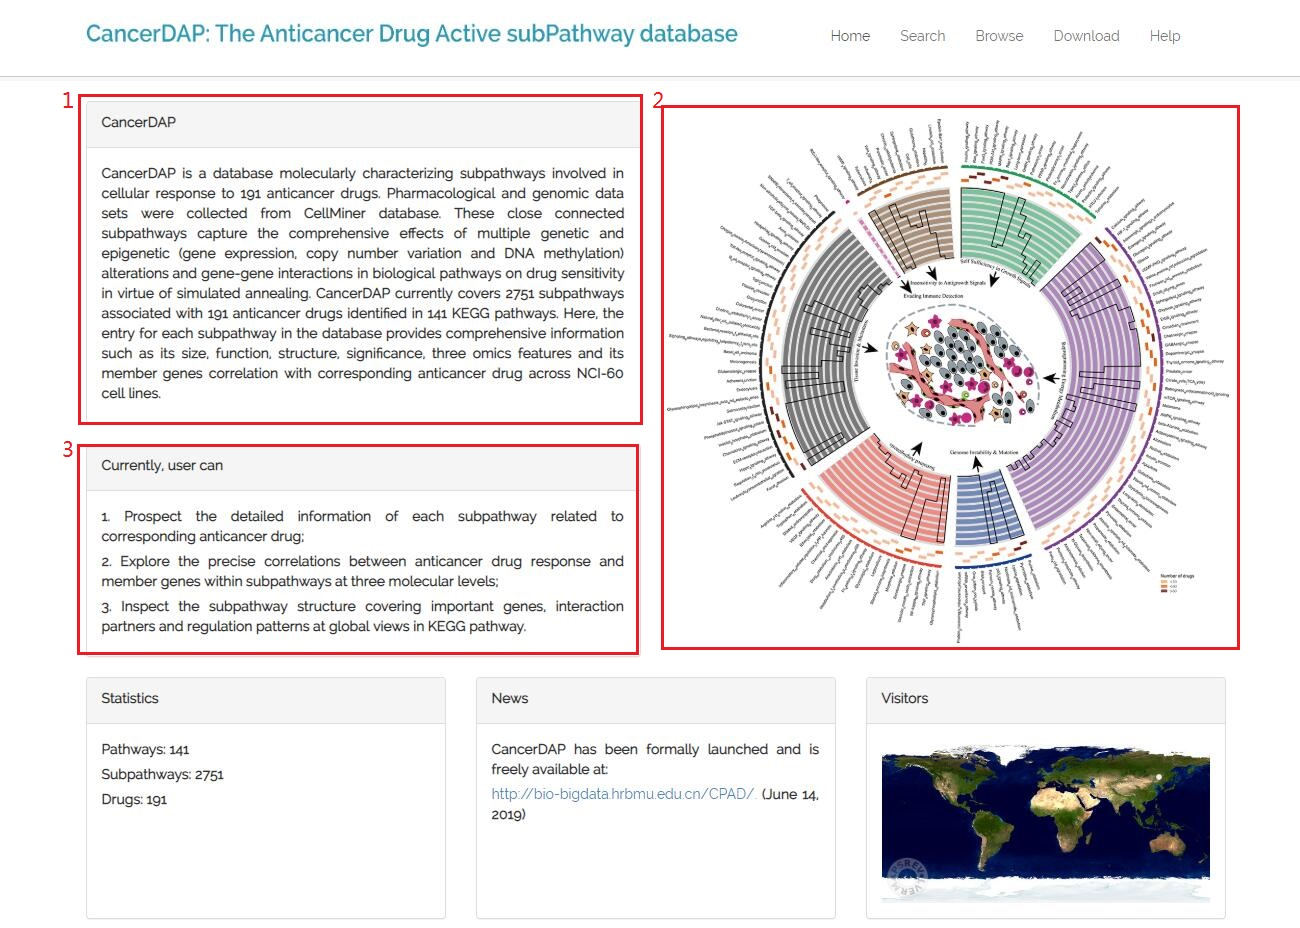
1. A brief introduction about CancerDAP;
2. Overview of the 141 entire pathways embracing all subpathways for 191 anticancer drugs in this resource. The next ring and histogram (Where the y axis limit is 23) illustrate the number of anticancer drug affected;
3. Three core functions of the resource.
Search
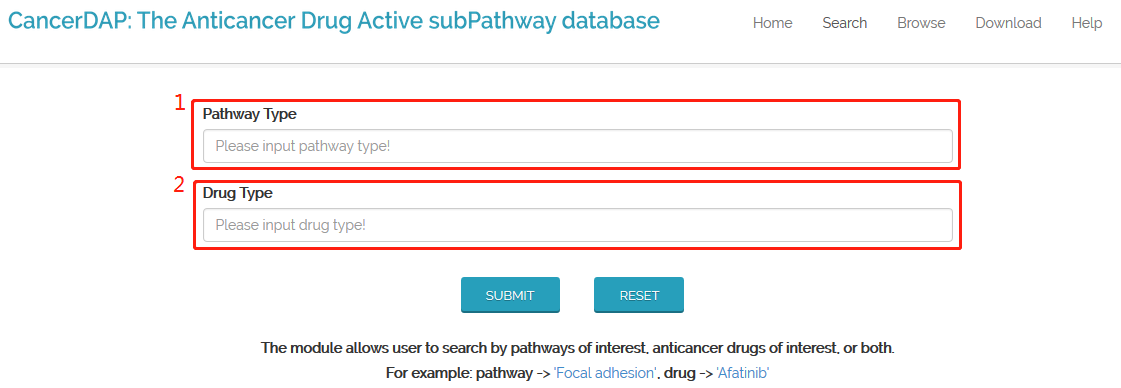
The "Search" module allows users to search by pathways of interest, anticancer drugs of interest, or both.
1. Input pathway name to start the research;
2. Input anticancer drug name to start the research.
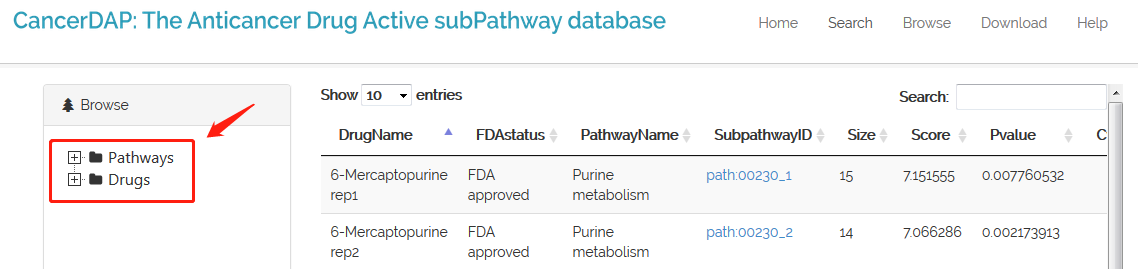
Browse
User can browse data based on pathways or drugs
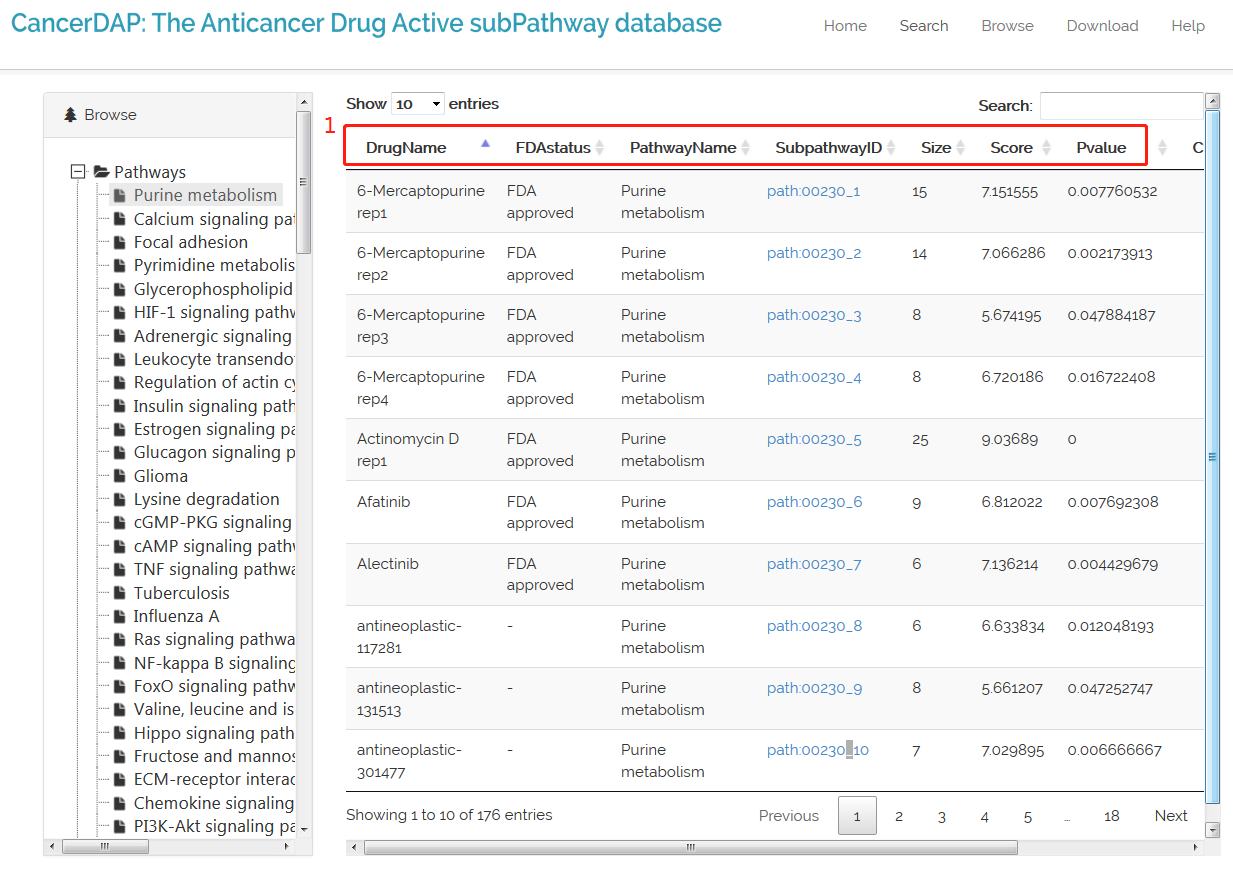
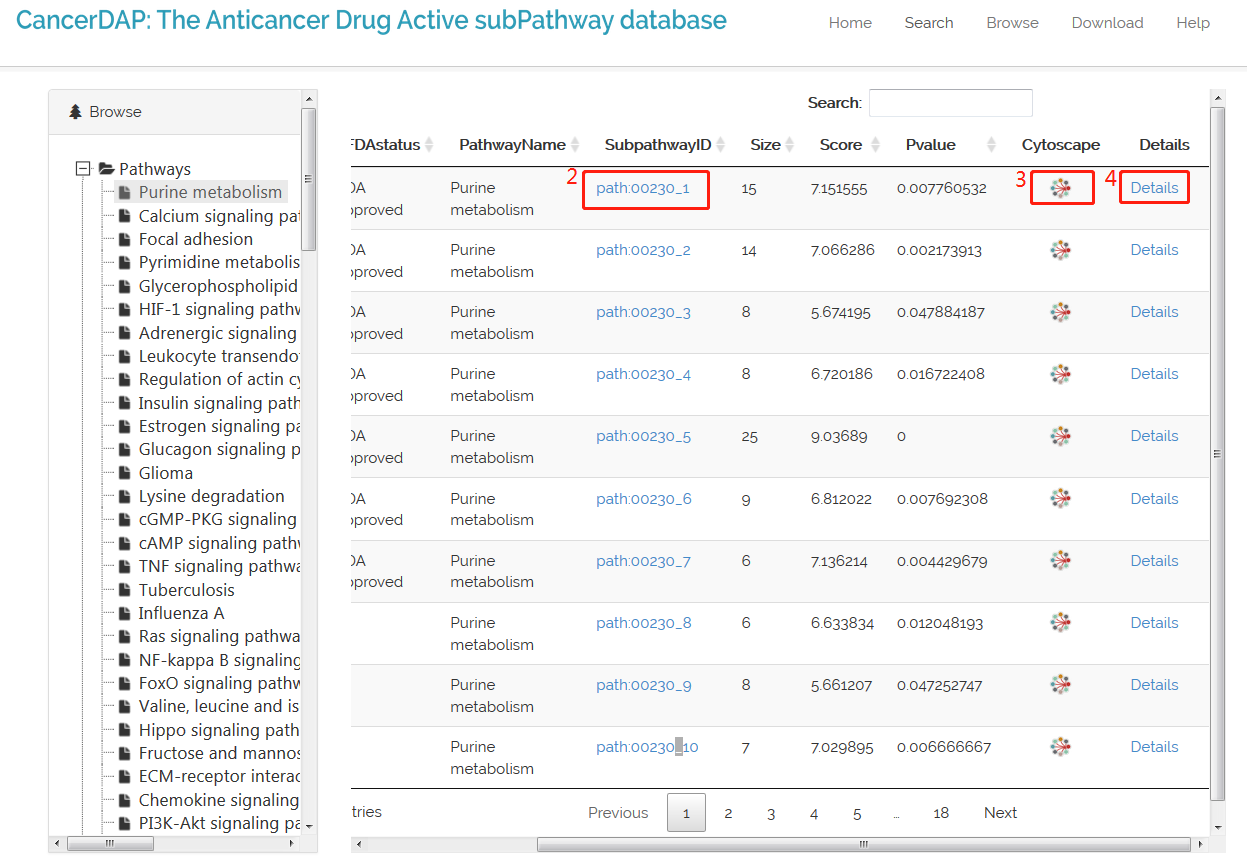
Search/browse result table:
1. Basic information about anticancer drug-subpathway association:
DrugName (anticancer drug name have a “rep” suffix if there are duplicates in CellMiner)
FDAstatus (FDA status of anticancer drug from CellMiner)
PathwayName (the entire pathway name in which corresponding subpathway is located)
SubpathwayID (subpathway ID derived from KEGG pathway ID)
Size (the number of member genes in corresponding subpathway)
Score (the score of subpathway from R package signet)
Pvalue (the P value of subpathway from R package signet);
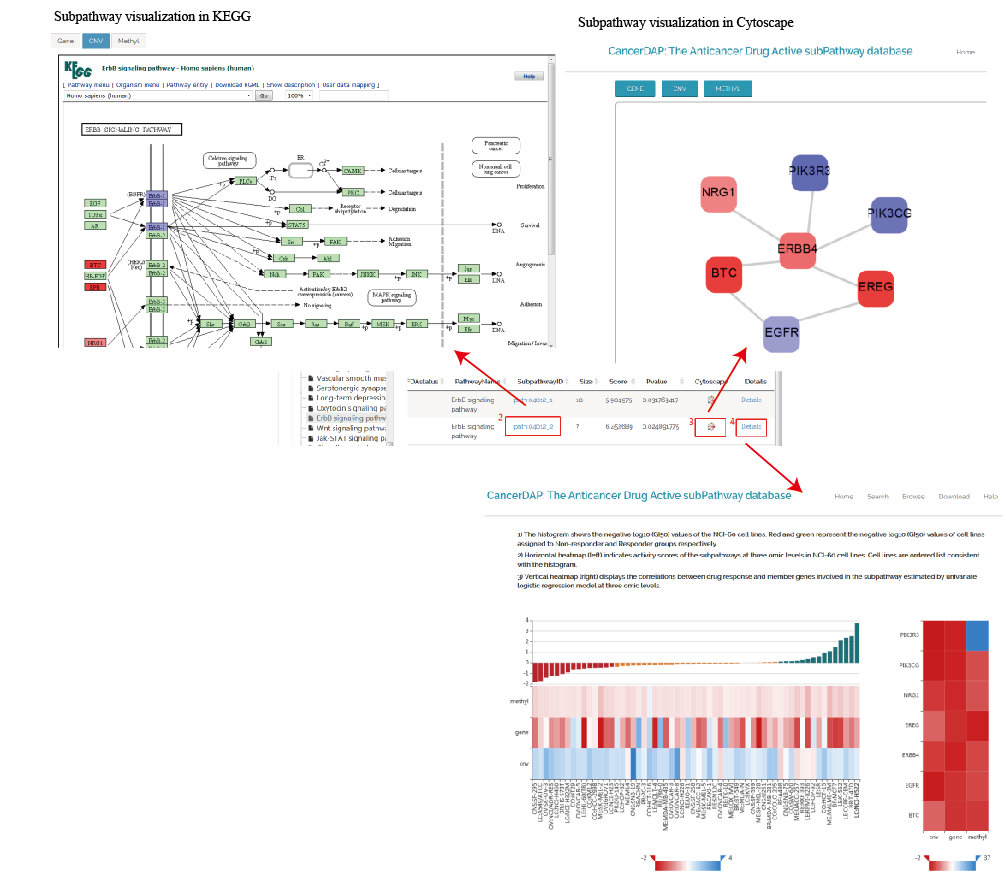
2. It provides hyperlinks to KEGG to get subpathway structure at holistic level, and intensity of gene color depends on the correlation between gene and drug sensitivity based on expression, methylation and copy number variation respectively. Red depicts positive and blue depicts negative correlation;
3. Visualization in cytoscape. Node color is the same as 2;
4. Visualization for multi-omic subpathway activity and the correlation between member genes and corresponding anticancer drug across NCI-60 cell lines.