Database content
CancerProteome provides a user-friendly searching interface.
Exploring quantification and modification proteome helps revealing the alterations at protein levels, which leads to new biological and diagnostic knowledge with the potential to improve our understanding of malignant transformation and therapeutic outcomes. Besides canonical proteins, an increasing number of novel functional microproteins have been identified as oncogenic drivers or tumour suppressors in cancer. Here, we developed the CancerProteome database to comprehensively decipher proteome landscape across various cancer types.
We collected all available proteome datasets of clinical samples and cell lines from widely used proteome storage databases, such as CPTAC (https://pdc.cancer.gov), PRIDE (1), MassIVE.quant (2), PeptideAtlas (3), jPOST (4), Panorama (5) and iProX (6). The raw data and clinical-related information were downloaded for in-depth analysis. Both quantitative and PTM proteome across 21 cancer types were re-analyzed. Additionally, we acquired transcriptome datasets of corresponding patients of 10 cancer types, including 1,560 tumor and 368 control samples.
Information of MS-based datasets
| Omics |
Cancer abbreviation |
Cancer |
Resource |
Clinical characteristic(sample number) |
Sample type |
We integrated all the ribo-seq-supported open reading frames (ORFs) from RPFdb (7), nuORFdb (8), TransLnc (9) and IEAtlas (10) along with their basic annotations. All ORFs with ‘NTG’ start codons and ‘TAA/TGA/TAG’ stop codons were performed following analysis. Based on the genome coordinates of ORFs and the corresponding annotation files, we obtained the sequences of ORFs using the ‘getblast’ function in the R ‘bedtoolsr’ package with default parameters. Only ORFs that produced peptides longer than 8 amino acids (aa) but smaller than 100 aa were further retained, defined as microproteins as previous studies (11,12). Those microproteins whose sequences were entirely contained within other (micro-)proteins were removed. After integrating with known protein information from human UniProt database (13), benchmarked proteins and microproteins theory library were constructed for further analysis.
Web interface
1. Main functions of the database are provided in menu bar form.
2. Click the icon of mouse button to start a quick search.
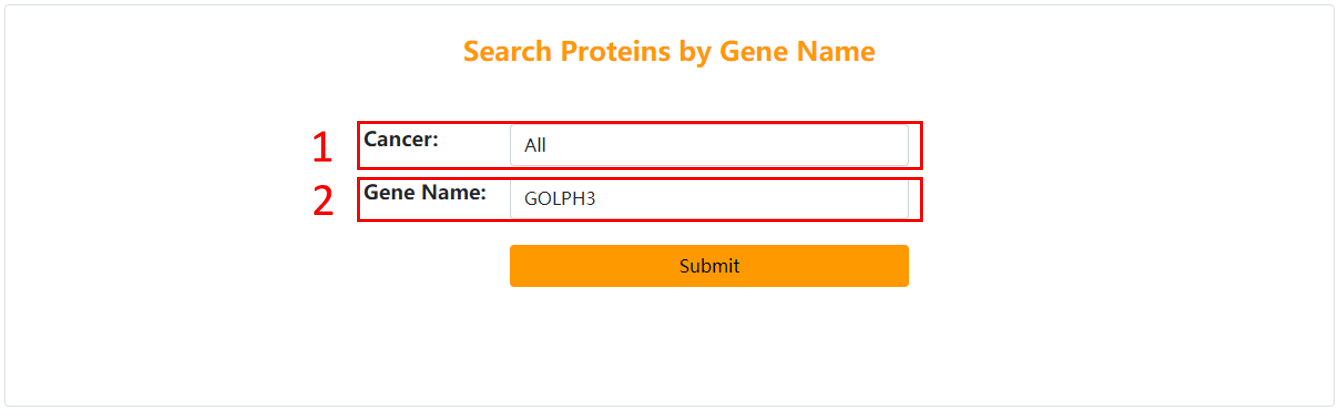
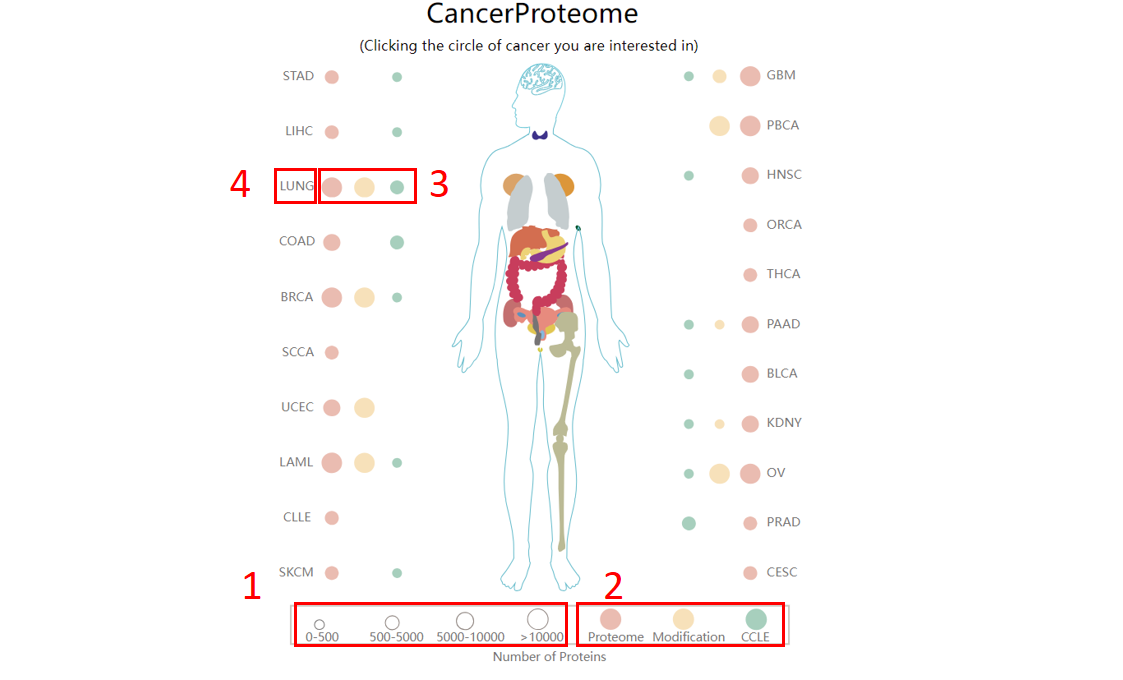
1. Choose the cancer you are interested in.
2. Input gene symbol.
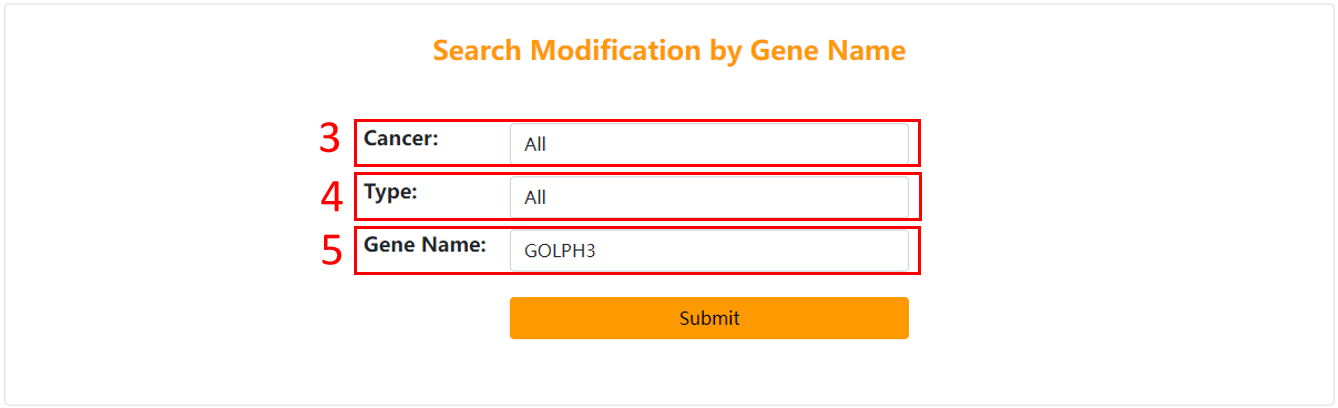
3. Choose the cancer you are interested in.
4. Choose the type of protein post-translational modification you are interested in.
5. Input gene symbol.
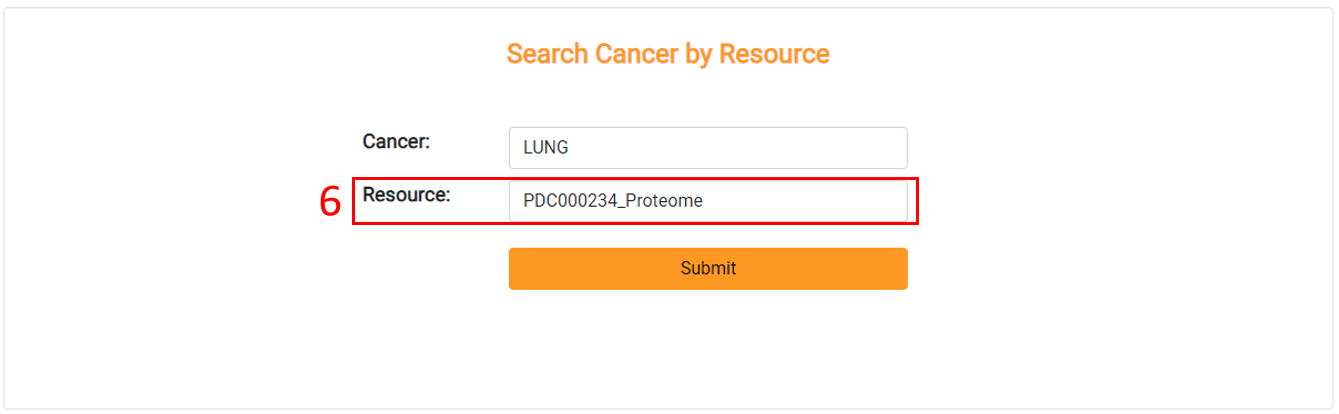
6. Choose the resource you are interested in.
For the browse page, we provide differentially expressed proteins identified by proteome across cancers in CancerProteome (default significance thresholds: FDR<0.05 and fold change (FC) <1/1.5 or 1*1.5).
1. The size of the dot indicates the number of differentially expressed proteins across cancer.
2. The color of the dot indicates the type of omics data.
3. Click to browse differentially expressed proteins in specific omics data.
4. Mouse over the text to display the full name of the cancer.
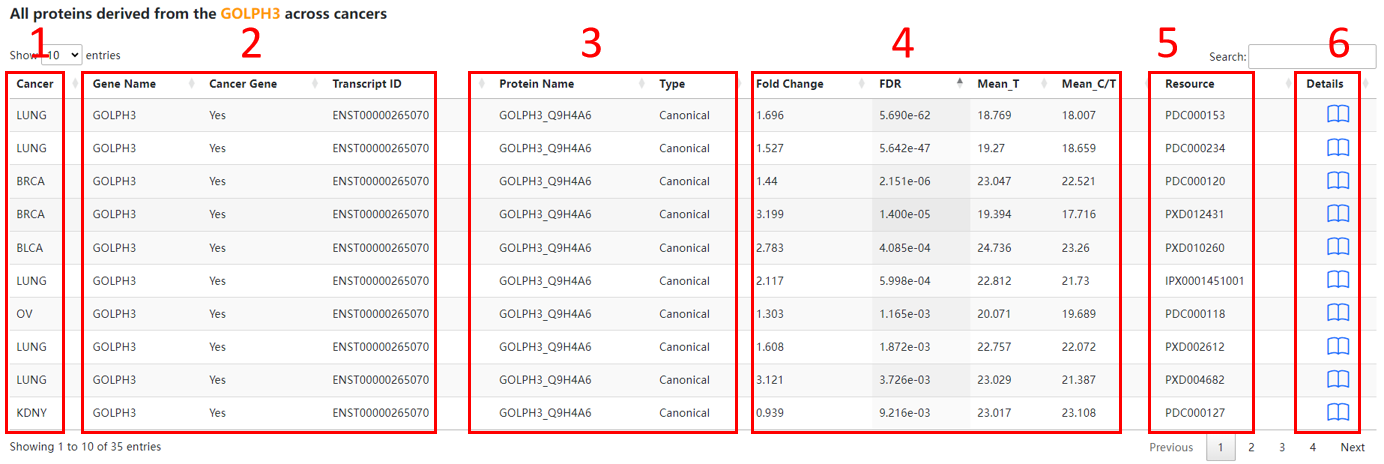
The result page of proteins is displayed as below.
1. Cancer.
2. Gene basic information.
3. Protein basic information.
4. Expression basic informaton.
5. Resource.
6. Click to view the detail information.
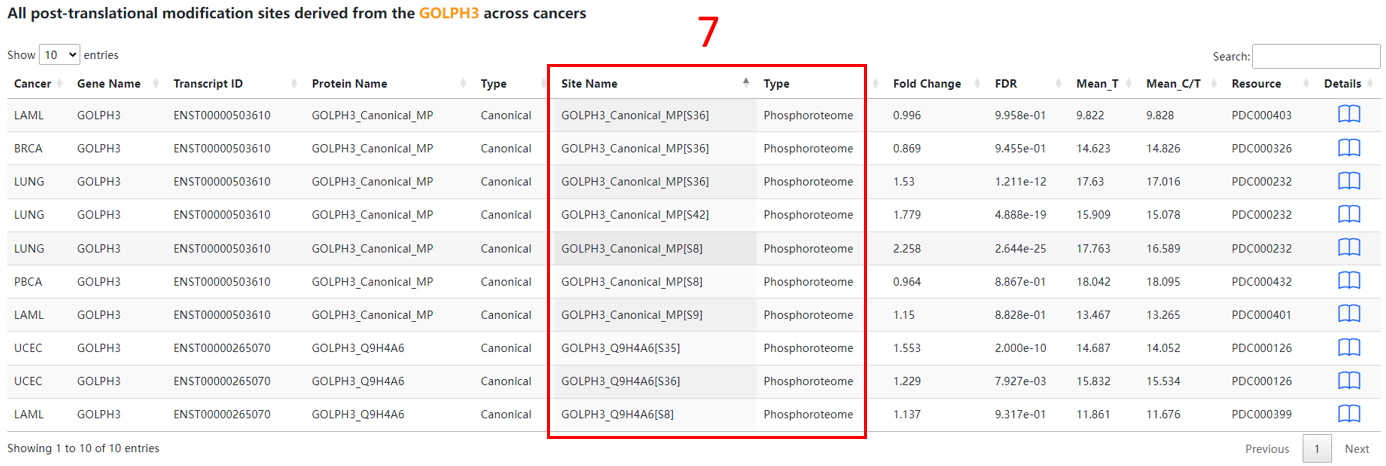
7. Protein post-translational modification basic information.
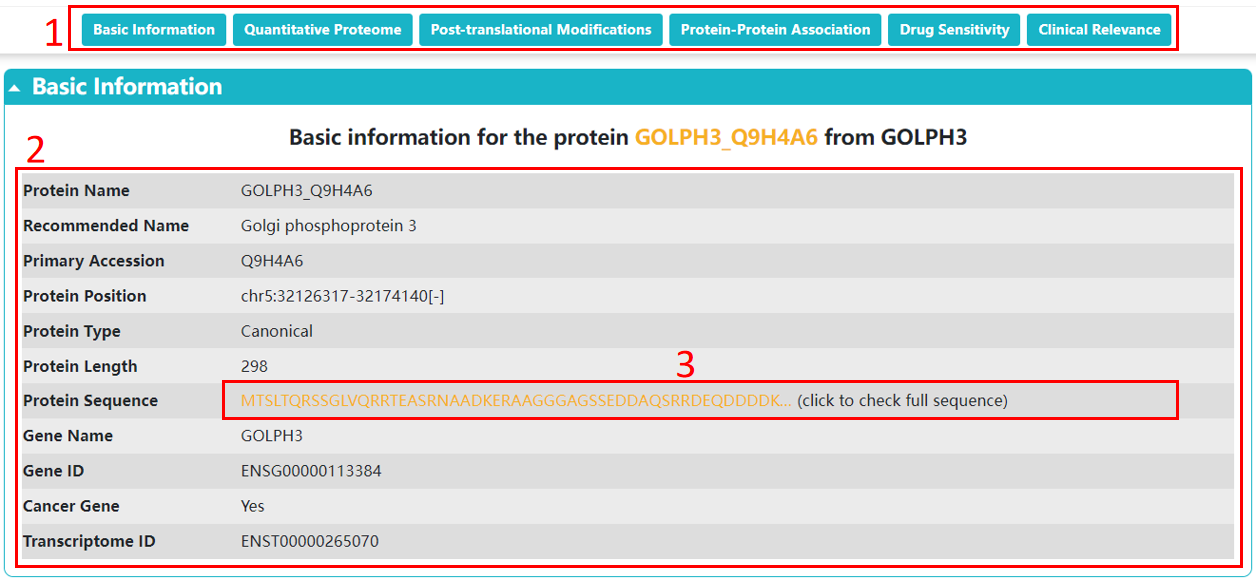
For each protein or modification site, we provide basic information, which is displayed as below.
1. You could directly go to the module of interest by click the axis.
2. The basic information of the protein/site.
3. Click the protein sequence to check the details.
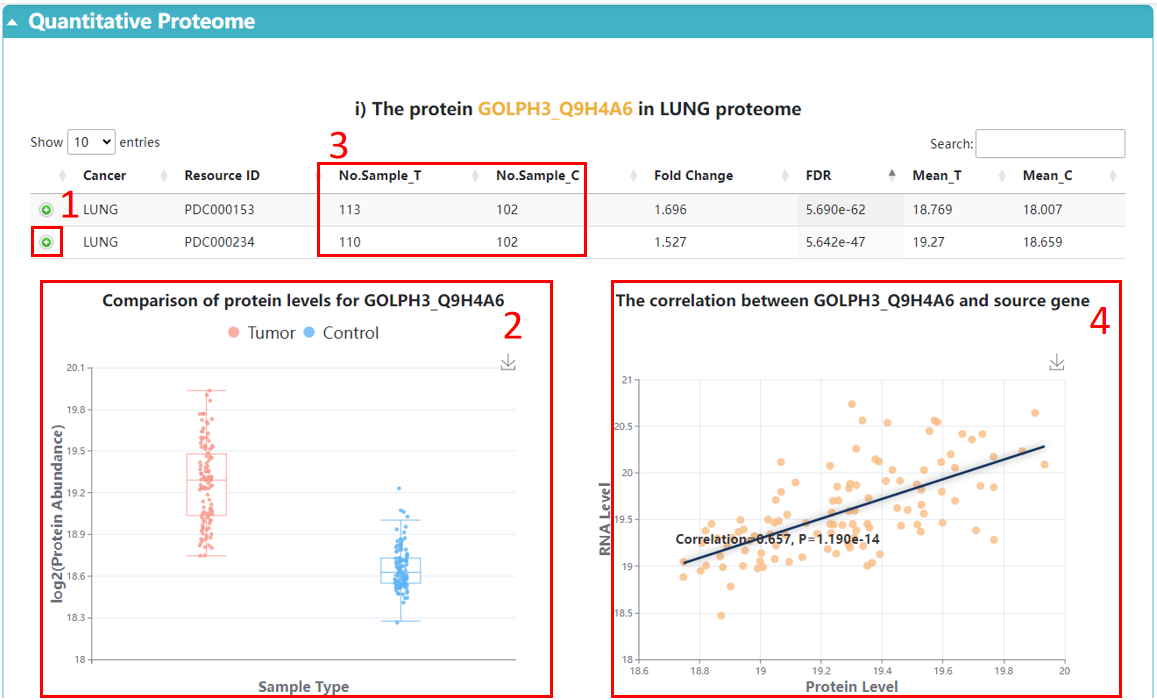
1. Browse the hidden information.
2. Boxplot with a comparison of protein levels between tumor and control samples.
3. The number of tumor/control samples in the resource.
4. The correlation scatter for RNA and protein levels. Correlation coefficients are Spearman’s rho and calculated across cancer samples.
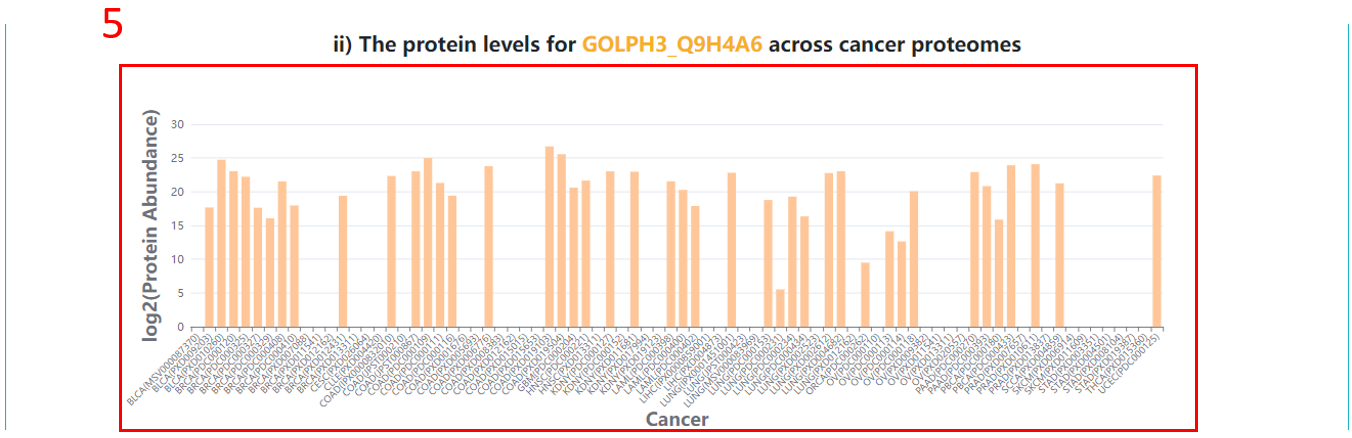
5. The protein abundances across different cancer proteomes.
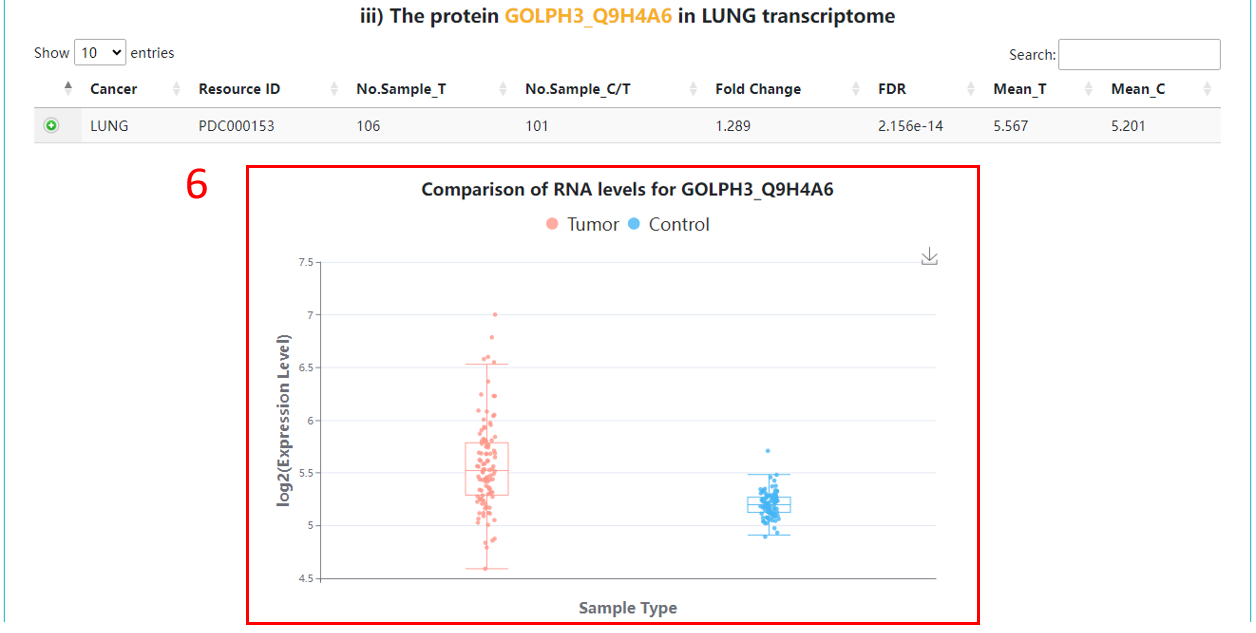
6. Boxplot with a comparison of RNA levels between tumor and control samples.
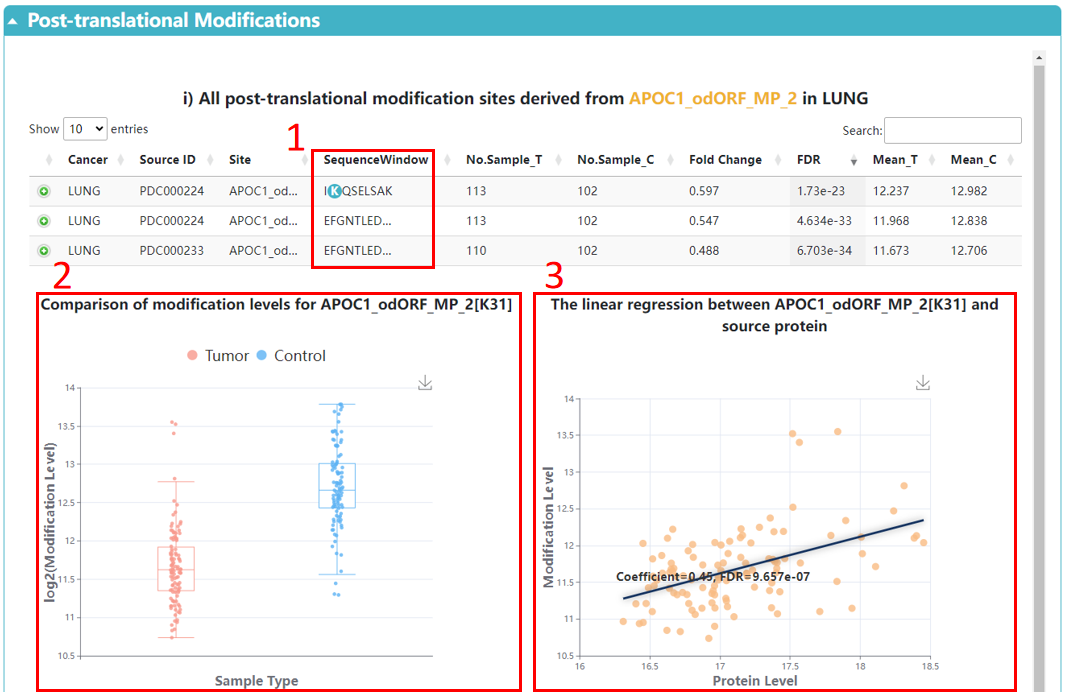
1. Click to browse the sequence near the modification site.
2. Boxplot with a comparison of protein modification levels between tumor and control samples.
3. We applied linear regression to test all pairwise associations between modification site and its corresponding proteins across cancer samples.
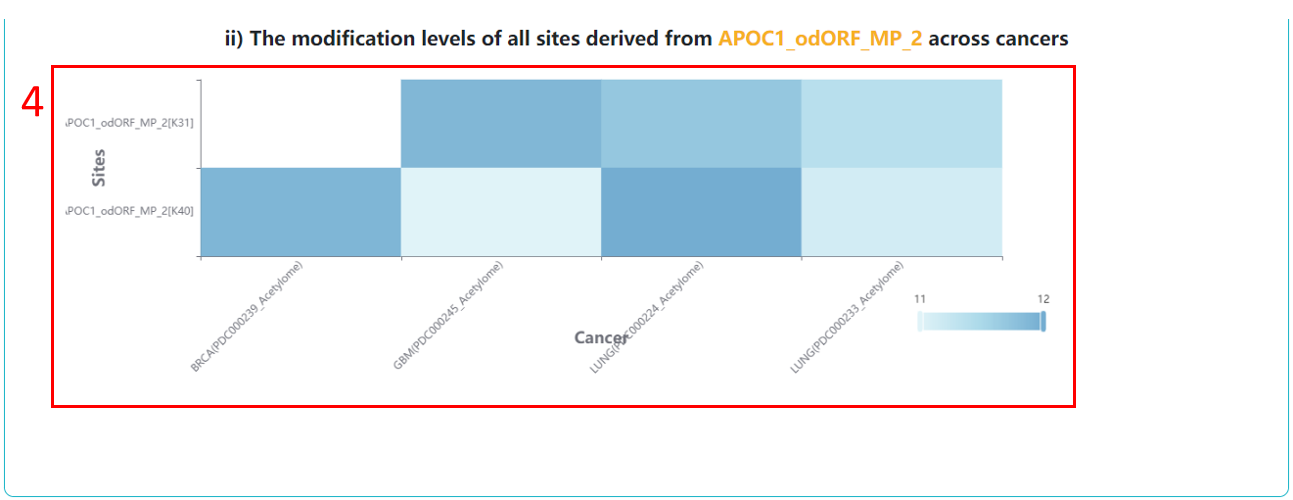
4. The abundances of modification sites derived from the same protein across cancers.
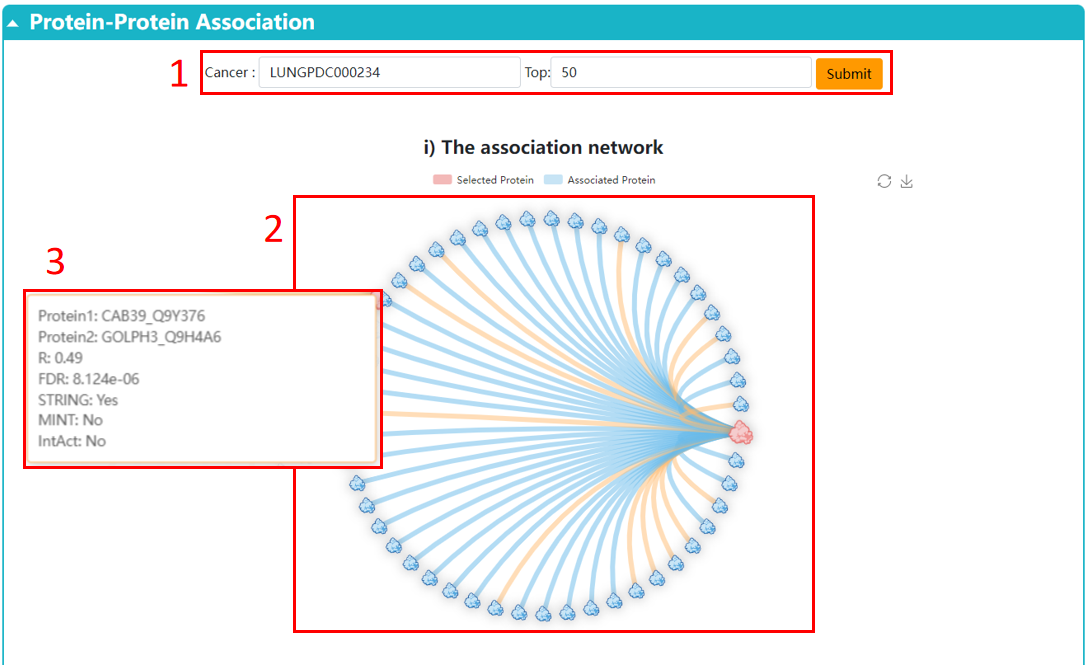
1. Choose the cancer and display the pair of association you are interested in.
2. The network displays the proteins associated with the selected protein.
3. Click the point to display the detailed information of the pairwise correlation. Correlation coefficients are Spearman’s rho and calculated across cancer samples.
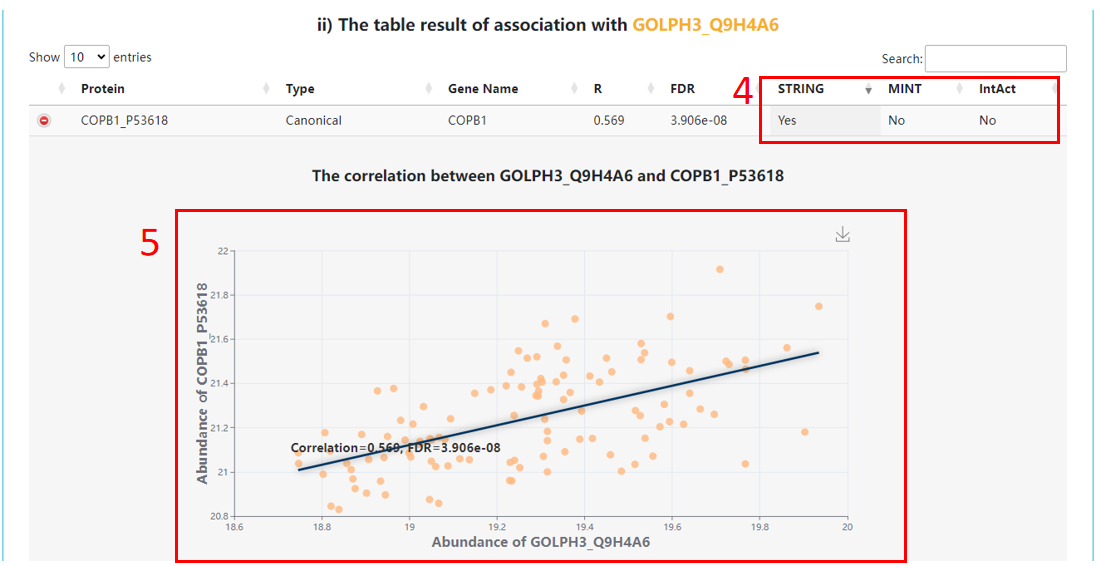
4. The valid information: "Yes" represents the associations were supported by the corresponding databases.
5. The correlation scatter for selected and associated protein levels. Correlation coefficients are Spearman’s rho and calculated across cancer samples.
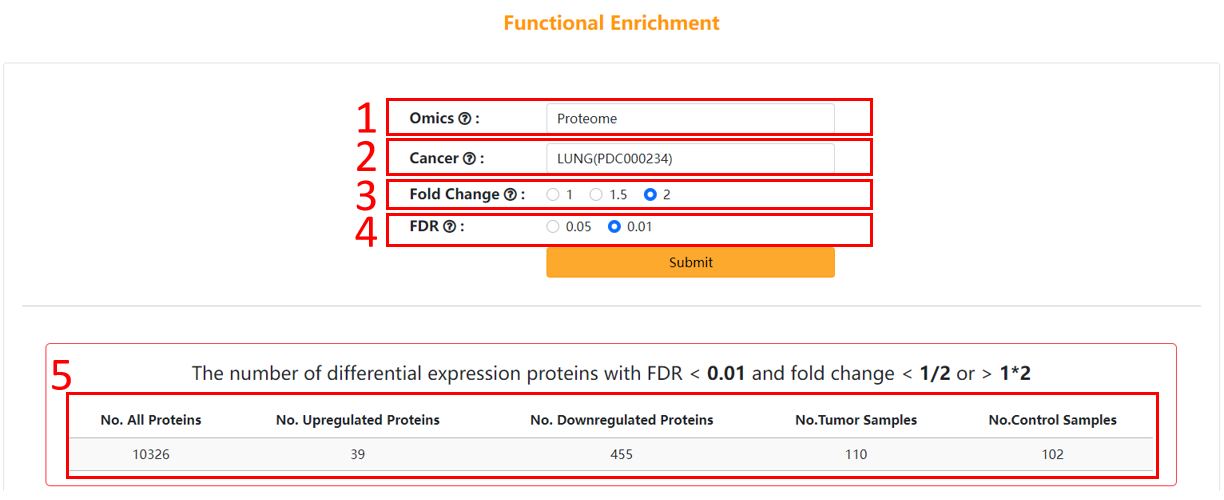
1. Choose the type of omics data you are interested in.
2. Choose the cancer you are interested in.
3. Choose the threshold of fold change you are interested in.
4. Choose the threshold of FDR you are interested in.
5. The result table of differentially expressed proteins/sites/genes.
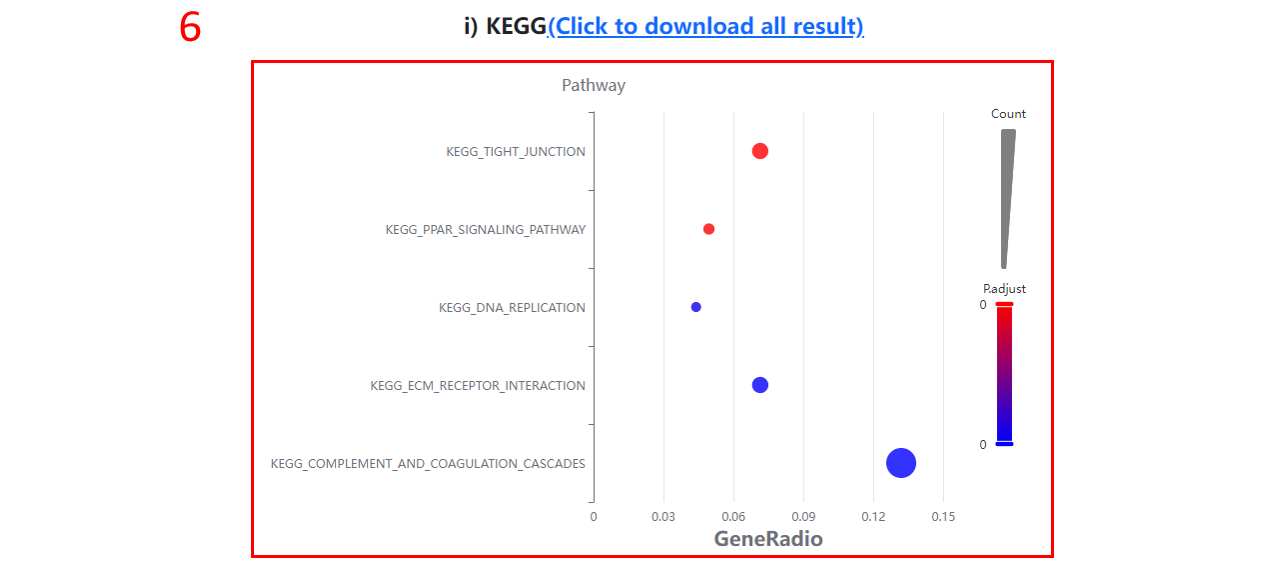
6. The KEGG terms enriched for differentially expressed proteins/sites/genes.
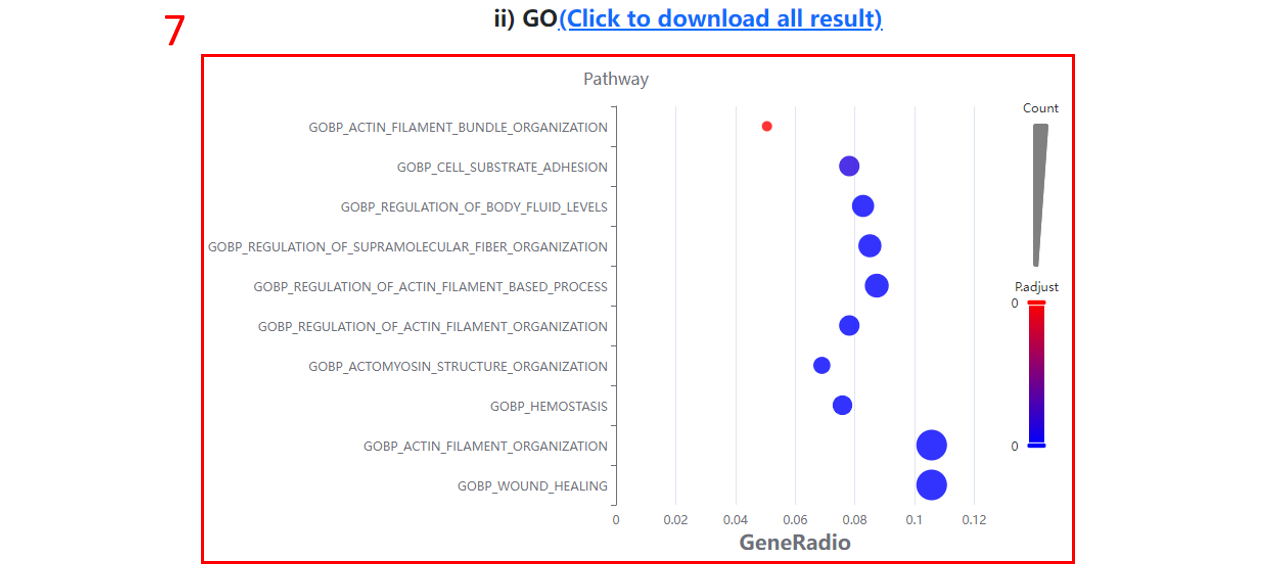
7. The GO:BP terms enriched for differentially expressed proteins/sites/genes.
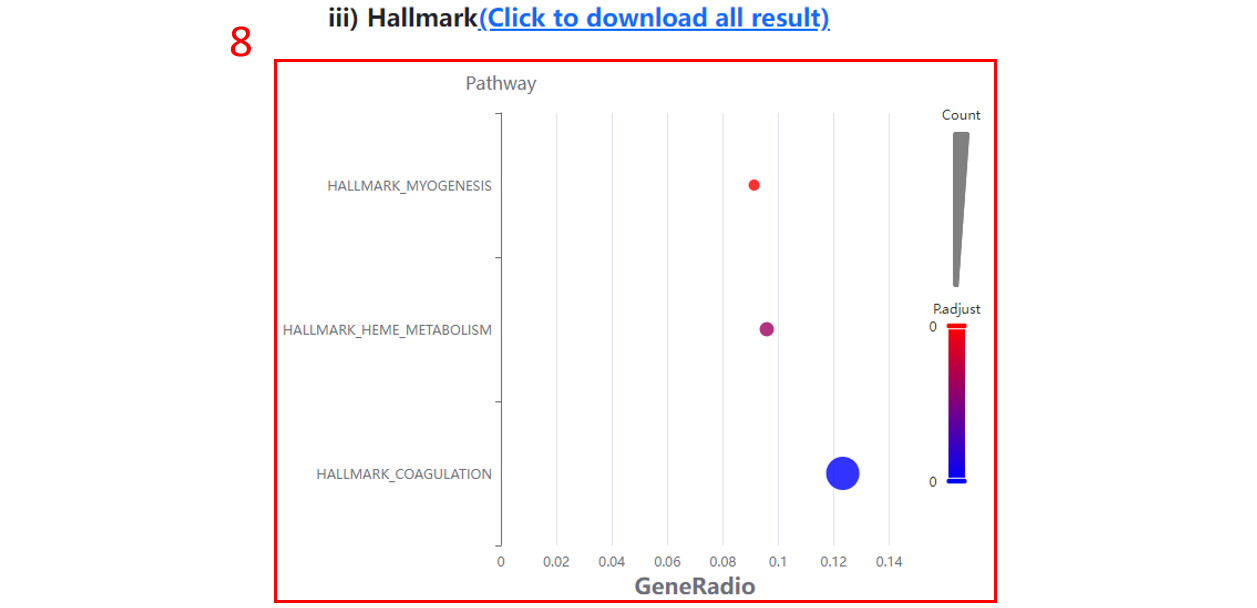
8. The Hallmark terms enriched for differentially expressed proteins/sites/genes.
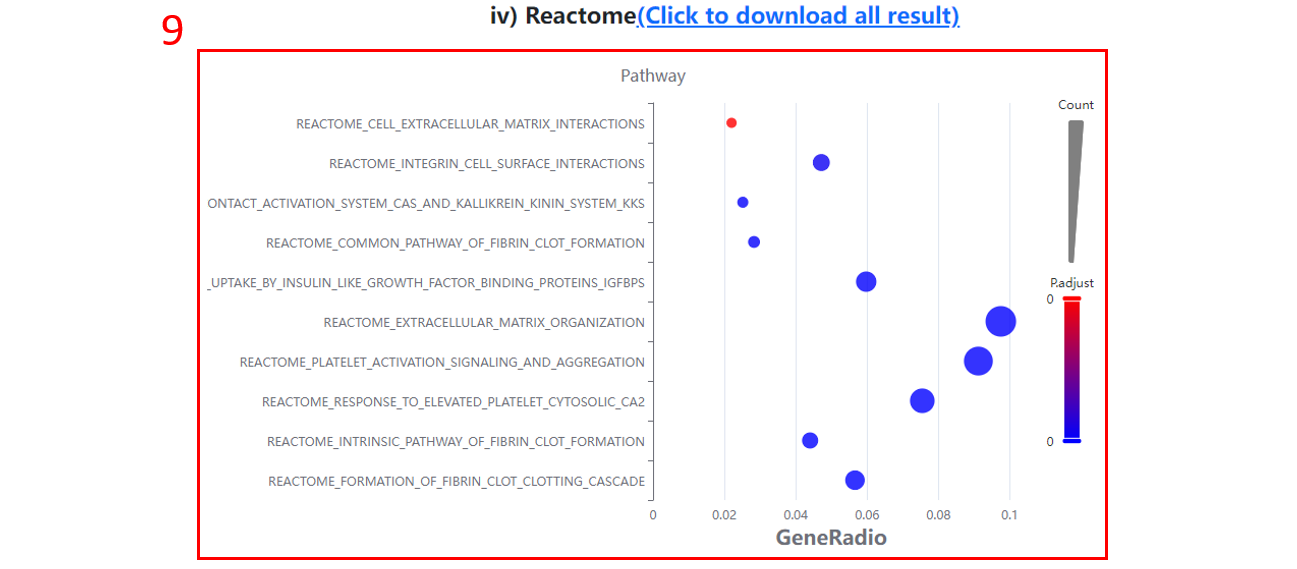
9. The Reactome terms enriched for differentially expressed proteins/sites/genes.
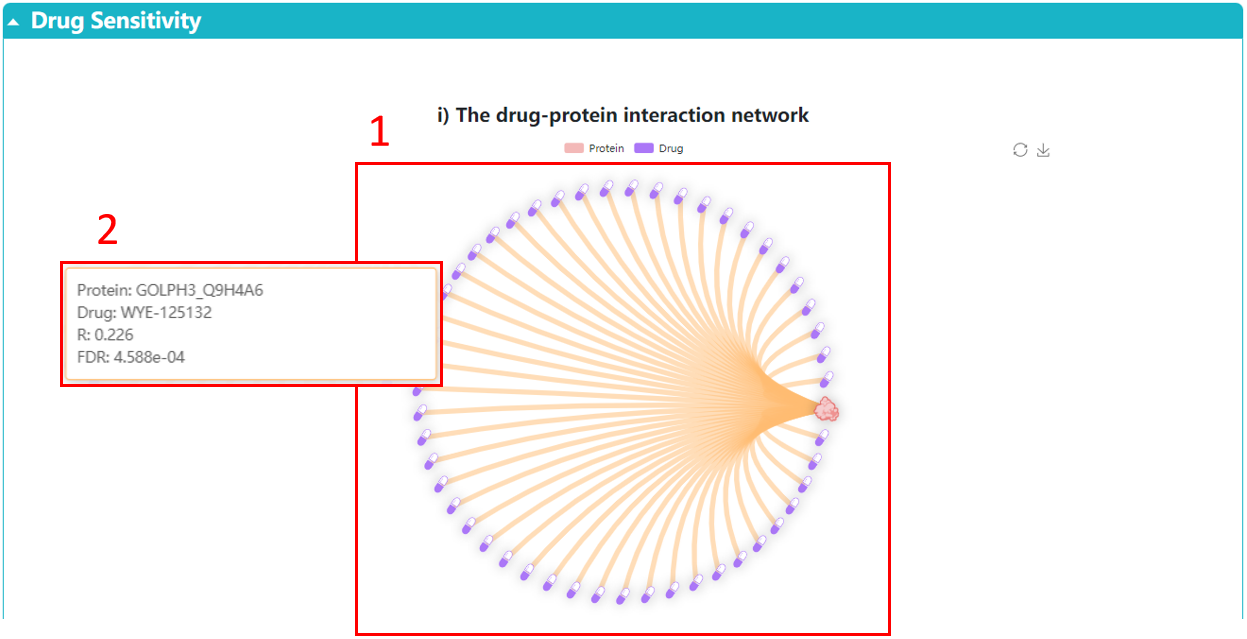
1. The network displays the drugs associated with the selected protein.
2. Click the point to display the detailed information of the pairwise correlation.
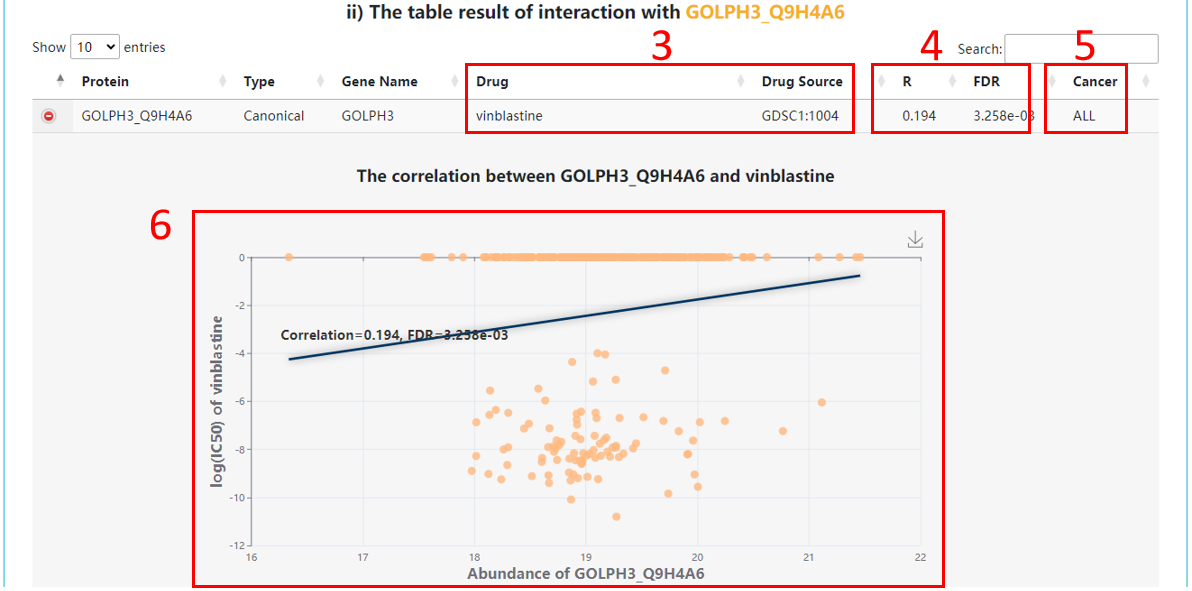
3. Drug information.
4. Correlation information.
5. Cancer information for cell lines.
6. The correlation scatter for drug sensitivity and protein abundances. Correlation coefficients are Spearman’s rho and calculated across cancer cell lines.
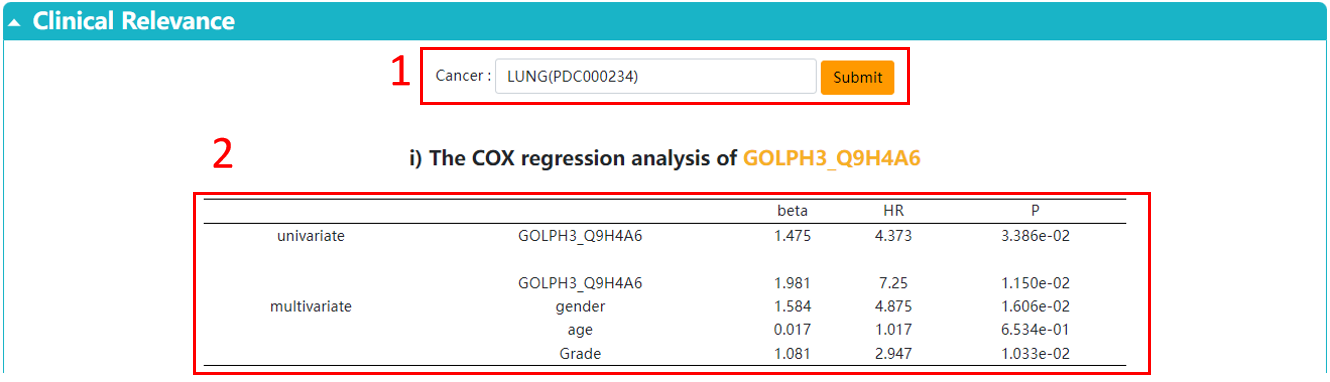
1. Choose the cancer you are interested in.
2. The univariate and multivariate Cox regression.
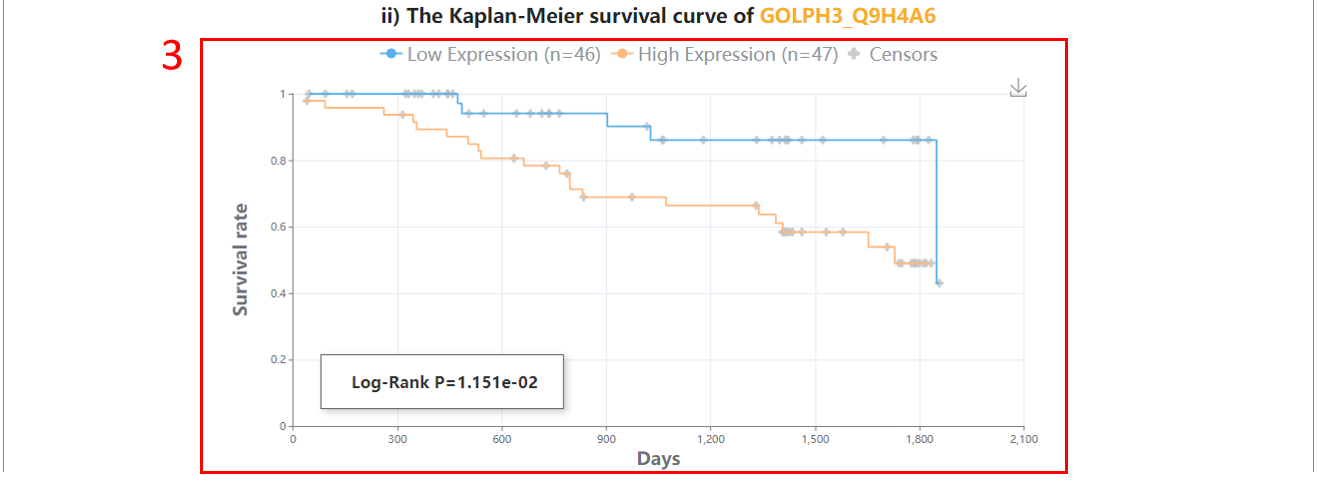
3. Survival analysis.
1. Perez-Riverol, Y., Bai, J., Bandla, C., Garcia-Seisdedos, D., Hewapathirana, S., Kamatchinathan, S., Kundu, D.J., Prakash, A., Frericks-Zipper, A., Eisenacher, M. et al. (2022) The PRIDE database resources in 2022: a hub for mass spectrometry-based proteomics evidences. Nucleic Acids Res, 50, D543-D552.
2. Choi, M., Carver, J., Chiva, C., Tzouros, M., Huang, T., Tsai, T.H., Pullman, B., Bernhardt, O.M., Huttenhain, R., Teo, G.C. et al. (2020) MassIVE.quant: a community resource of quantitative mass spectrometry-based proteomics datasets. Nat Methods, 17, 981-984.
3. Desiere, F., Deutsch, E.W., King, N.L., Nesvizhskii, A.I., Mallick, P., Eng, J., Chen, S., Eddes, J., Loevenich, S.N. and Aebersold, R. (2006) The PeptideAtlas project. Nucleic Acids Res, 34, D655- 658.
5. Sharma, V., Eckels, J., Taylor, G.K., Shulman, N.J., Stergachis, A.B., Joyner, S.A., Yan, P., Whiteaker, J.R., Halusa, G.N., Schilling, B. et al. (2014) Panorama: a targeted proteomics knowledge base. J Proteome Res, 13, 4205-4210.
6. Ma, J., Chen, T., Wu, S., Yang, C., Bai, M., Shu, K., Li, K., Zhang, G., Jin, Z., He, F. et al. (2019) iProX: an integrated proteome resource. Nucleic Acids Res, 47, D1211-D1217.
7. Wang, H., Yang, L., Wang, Y., Chen, L., Li, H. and Xie, Z. (2019) RPFdb v2.0: an updated database for genome-wide information of translated mRNA generated from ribosome profiling. Nucleic Acids Res, 47, D230-D234.
8. Ouspenskaia, T., Law, T., Clauser, K.R., Klaeger, S., Sarkizova, S., Aguet, F., Li, B., Christian, E., Knisbacher, B.A., Le, P.M. et al. (2022) Unannotated proteins expand the MHC-I-restricted immunopeptidome in cancer. Nat Biotechnol, 40, 209-217.
9. Lv, D., Chang, Z., Cai, Y., Li, J., Wang, L., Jiang, Q., Xu, K., Ding, N., Li, X., Xu, J. et al. (2022) TransLnc: a comprehensive resource for translatable lncRNAs extends immunopeptidome. Nucleic Acids Res, 50, D413-D420.
10. Cai, Y., Lv, D., Li, D., Yin, J., Ma, Y., Luo, Y., Fu, L., Ding, N., Li, Y., Pan, Z. et al. (2023) IEAtlas: an atlas of HLA-presented immune epitopes derived from non-coding regions. Nucleic Acids Res, 51, D409-D417.
11. van Heesch, S., Witte, F., Schneider-Lunitz, V., Schulz, J.F., Adami, E., Faber, A.B., Kirchner, M., Maatz, H., Blachut, S., Sandmann, C.L. et al. (2019) The Translational Landscape of the Human Heart. Cell, 178, 242-260 e229.
12. Duffy, E.E., Finander, B., Choi, G., Carter, A.C., Pritisanac, I., Alam, A., Luria, V., Karger, A., Phu, W., Sherman, M.A. et al. (2022) Developmental dynamics of RNA translation in the human brain. Nat Neurosci, 25, 1353-1365.