I. Tutorial & Method
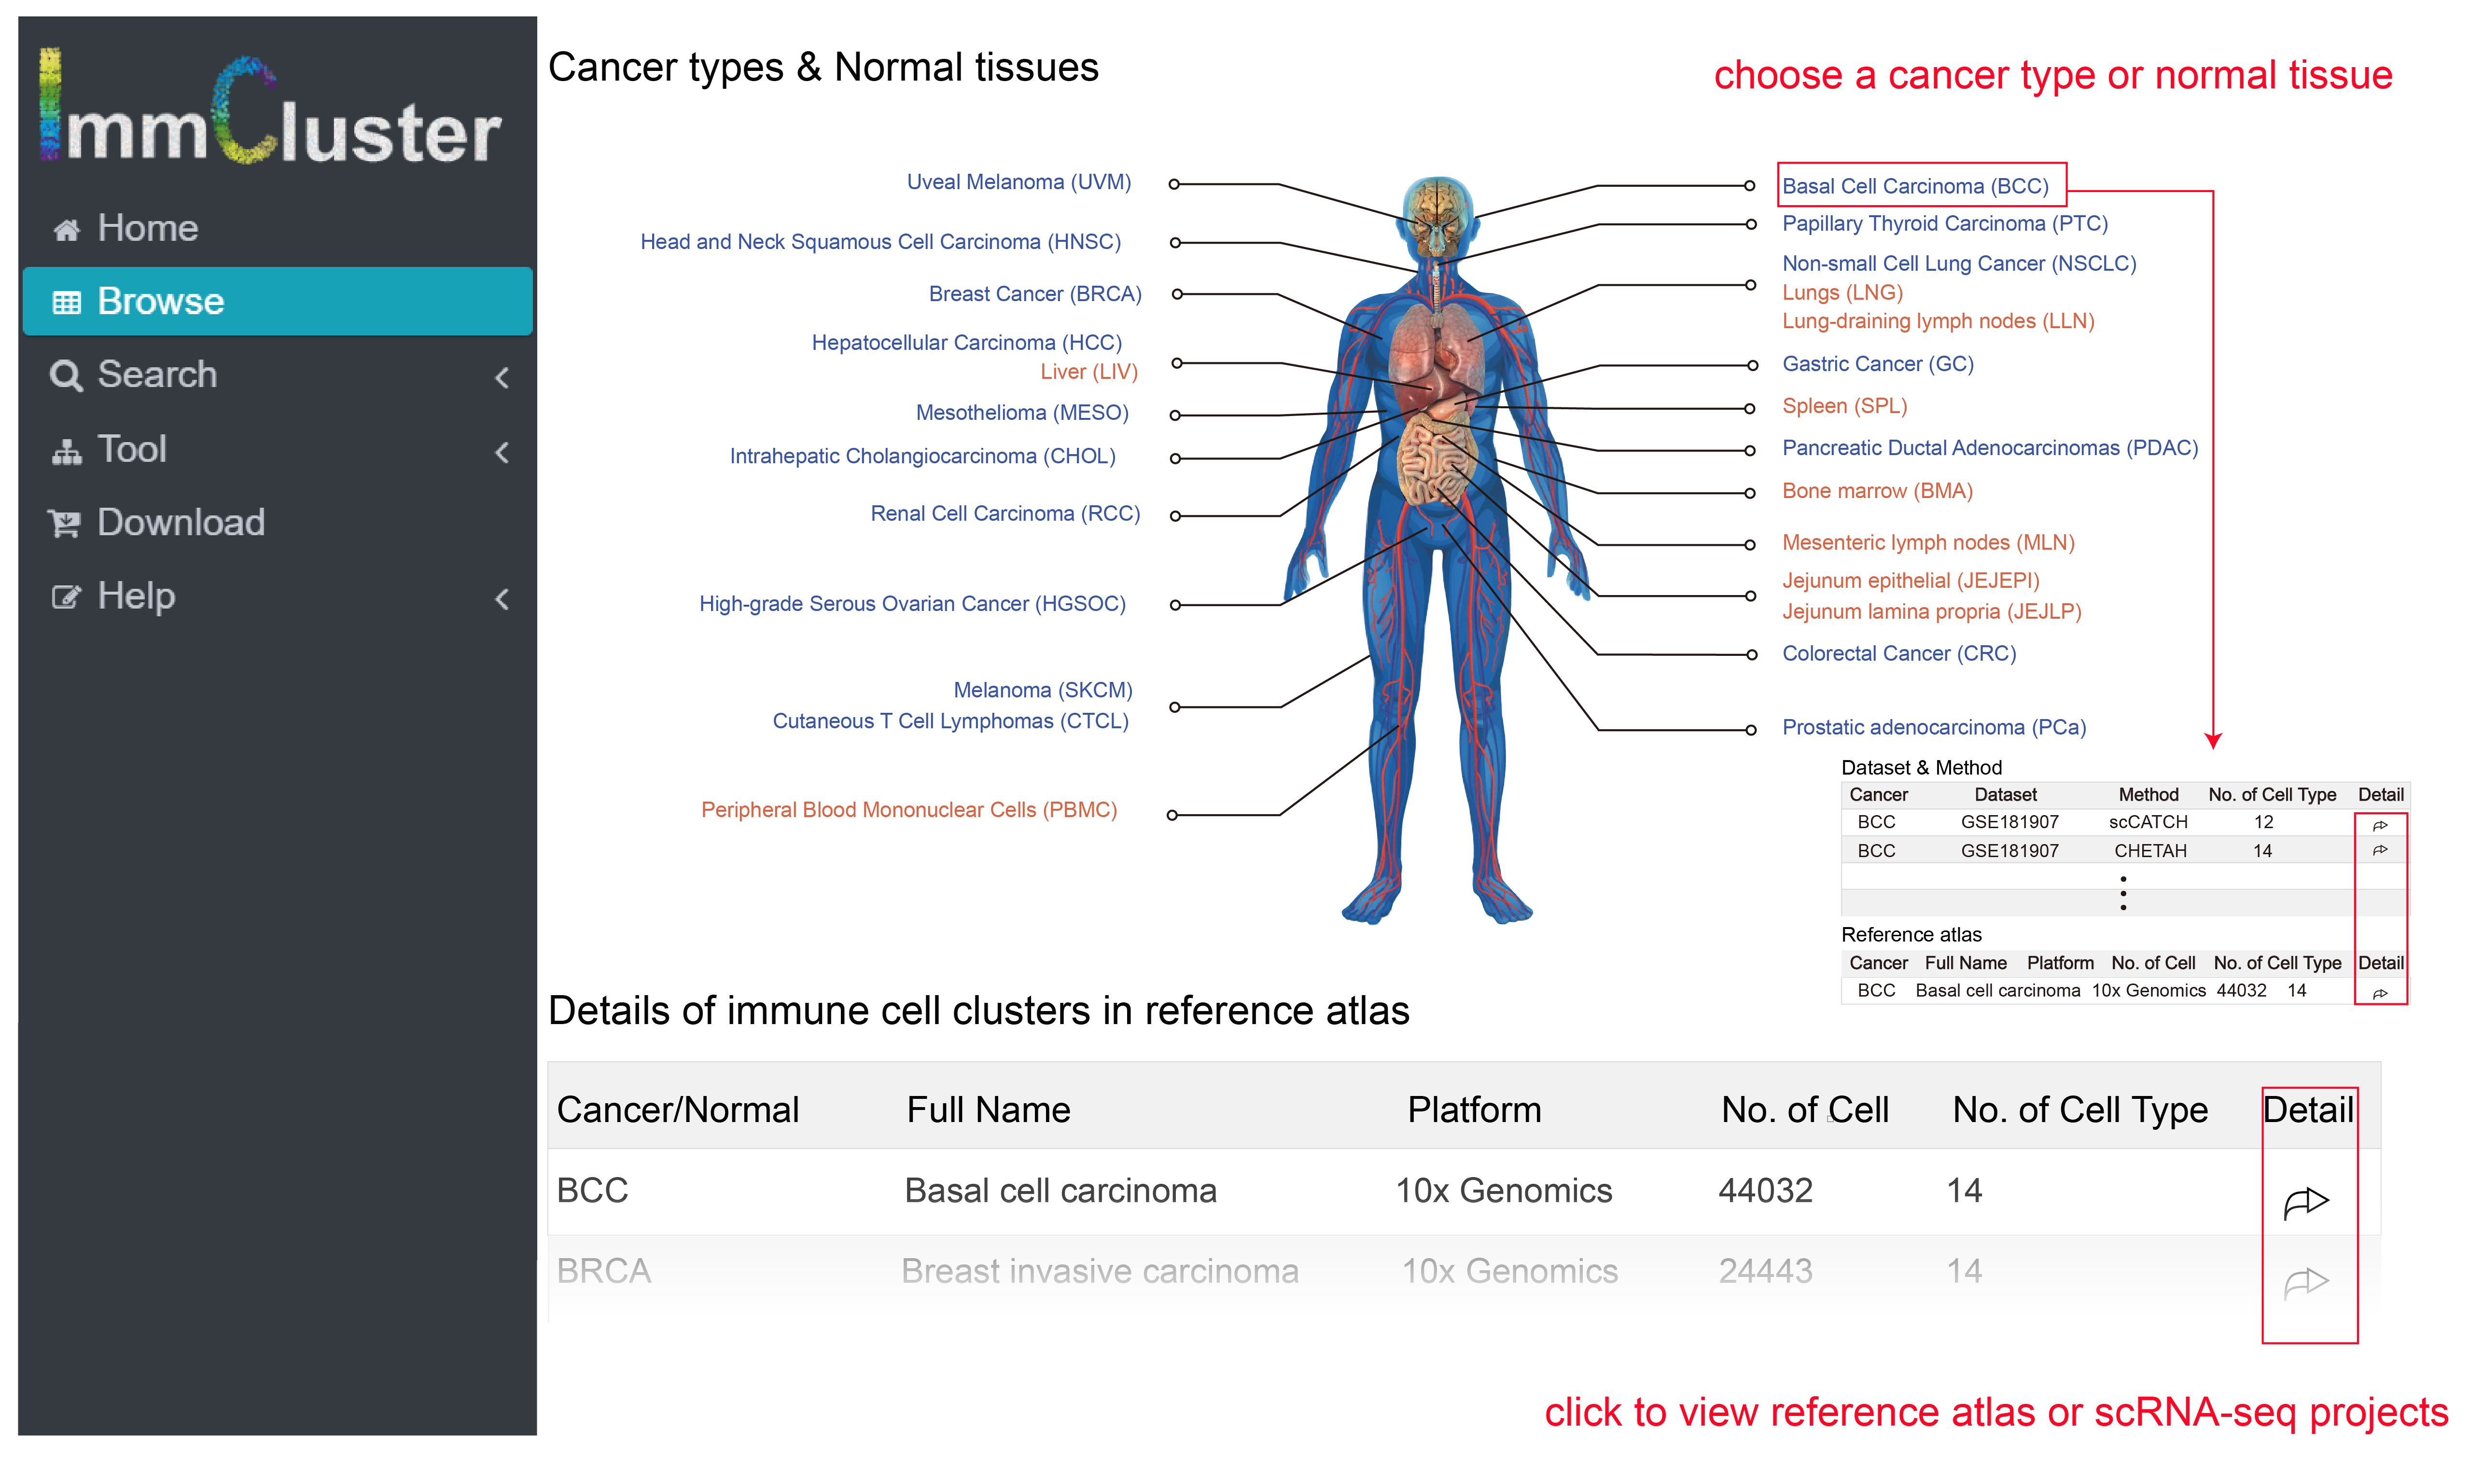
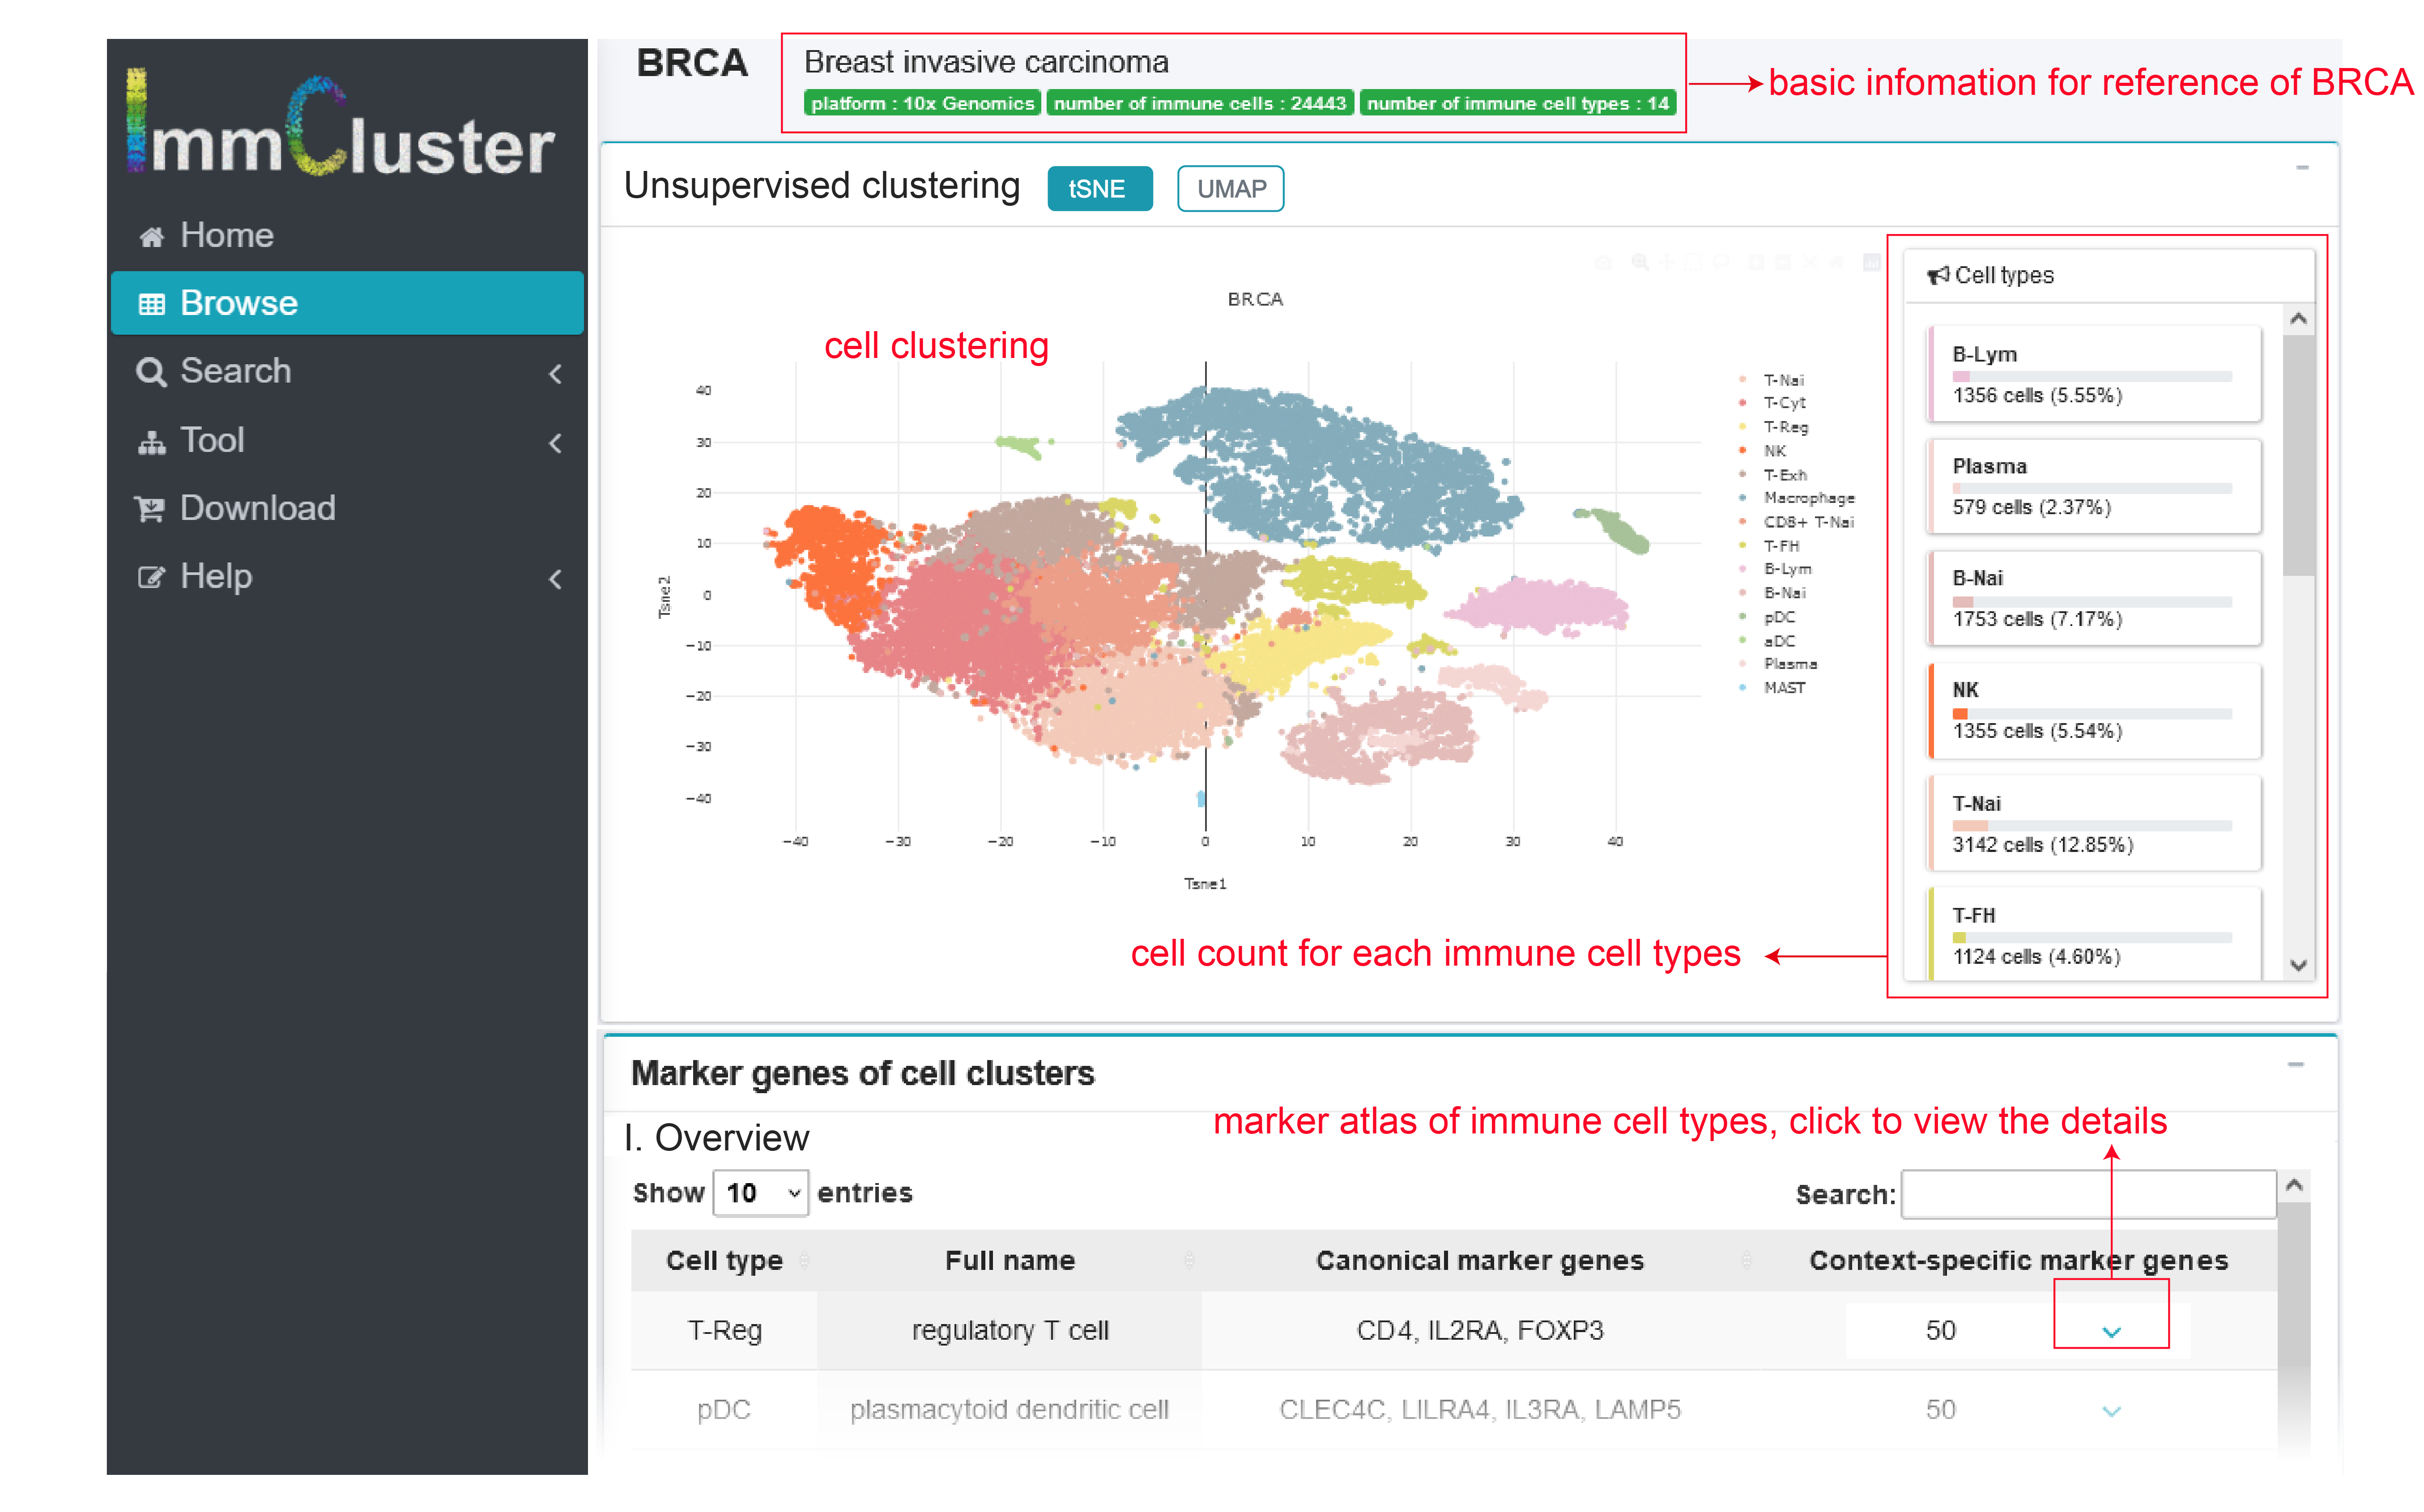
In the page Browse, users can choose one cancer type or normal tissue to view immune cell clusters with certain context. Similarly, users can click the options in table below with information button of data set.
In the page Search, there are 4 sections for users to search scRNA-seq dataset, context-specific reference, marker gene and immune cell type by entering letters within cancer names and obtaining a list of possible names or choose data directly.

In the page Tool, users can submit their single-cell RNA-seq data to explore the immune cell types by selecting some interested prediction methods. Through the integrated project, we give all the results belonging to every method and the optimal annotations. Following pages would be loaded in order.
- Data upload. Users should submit a single-cell expression profile(.txt or .csv) and provide E-mail address to create task ID. As some integrated method would take a long time, we will send a message when these computations are done. To get an integrated result, users should choose some interested methods, with specifying cancer types or normal tissue and specifying whether to predict unknown, and submit.
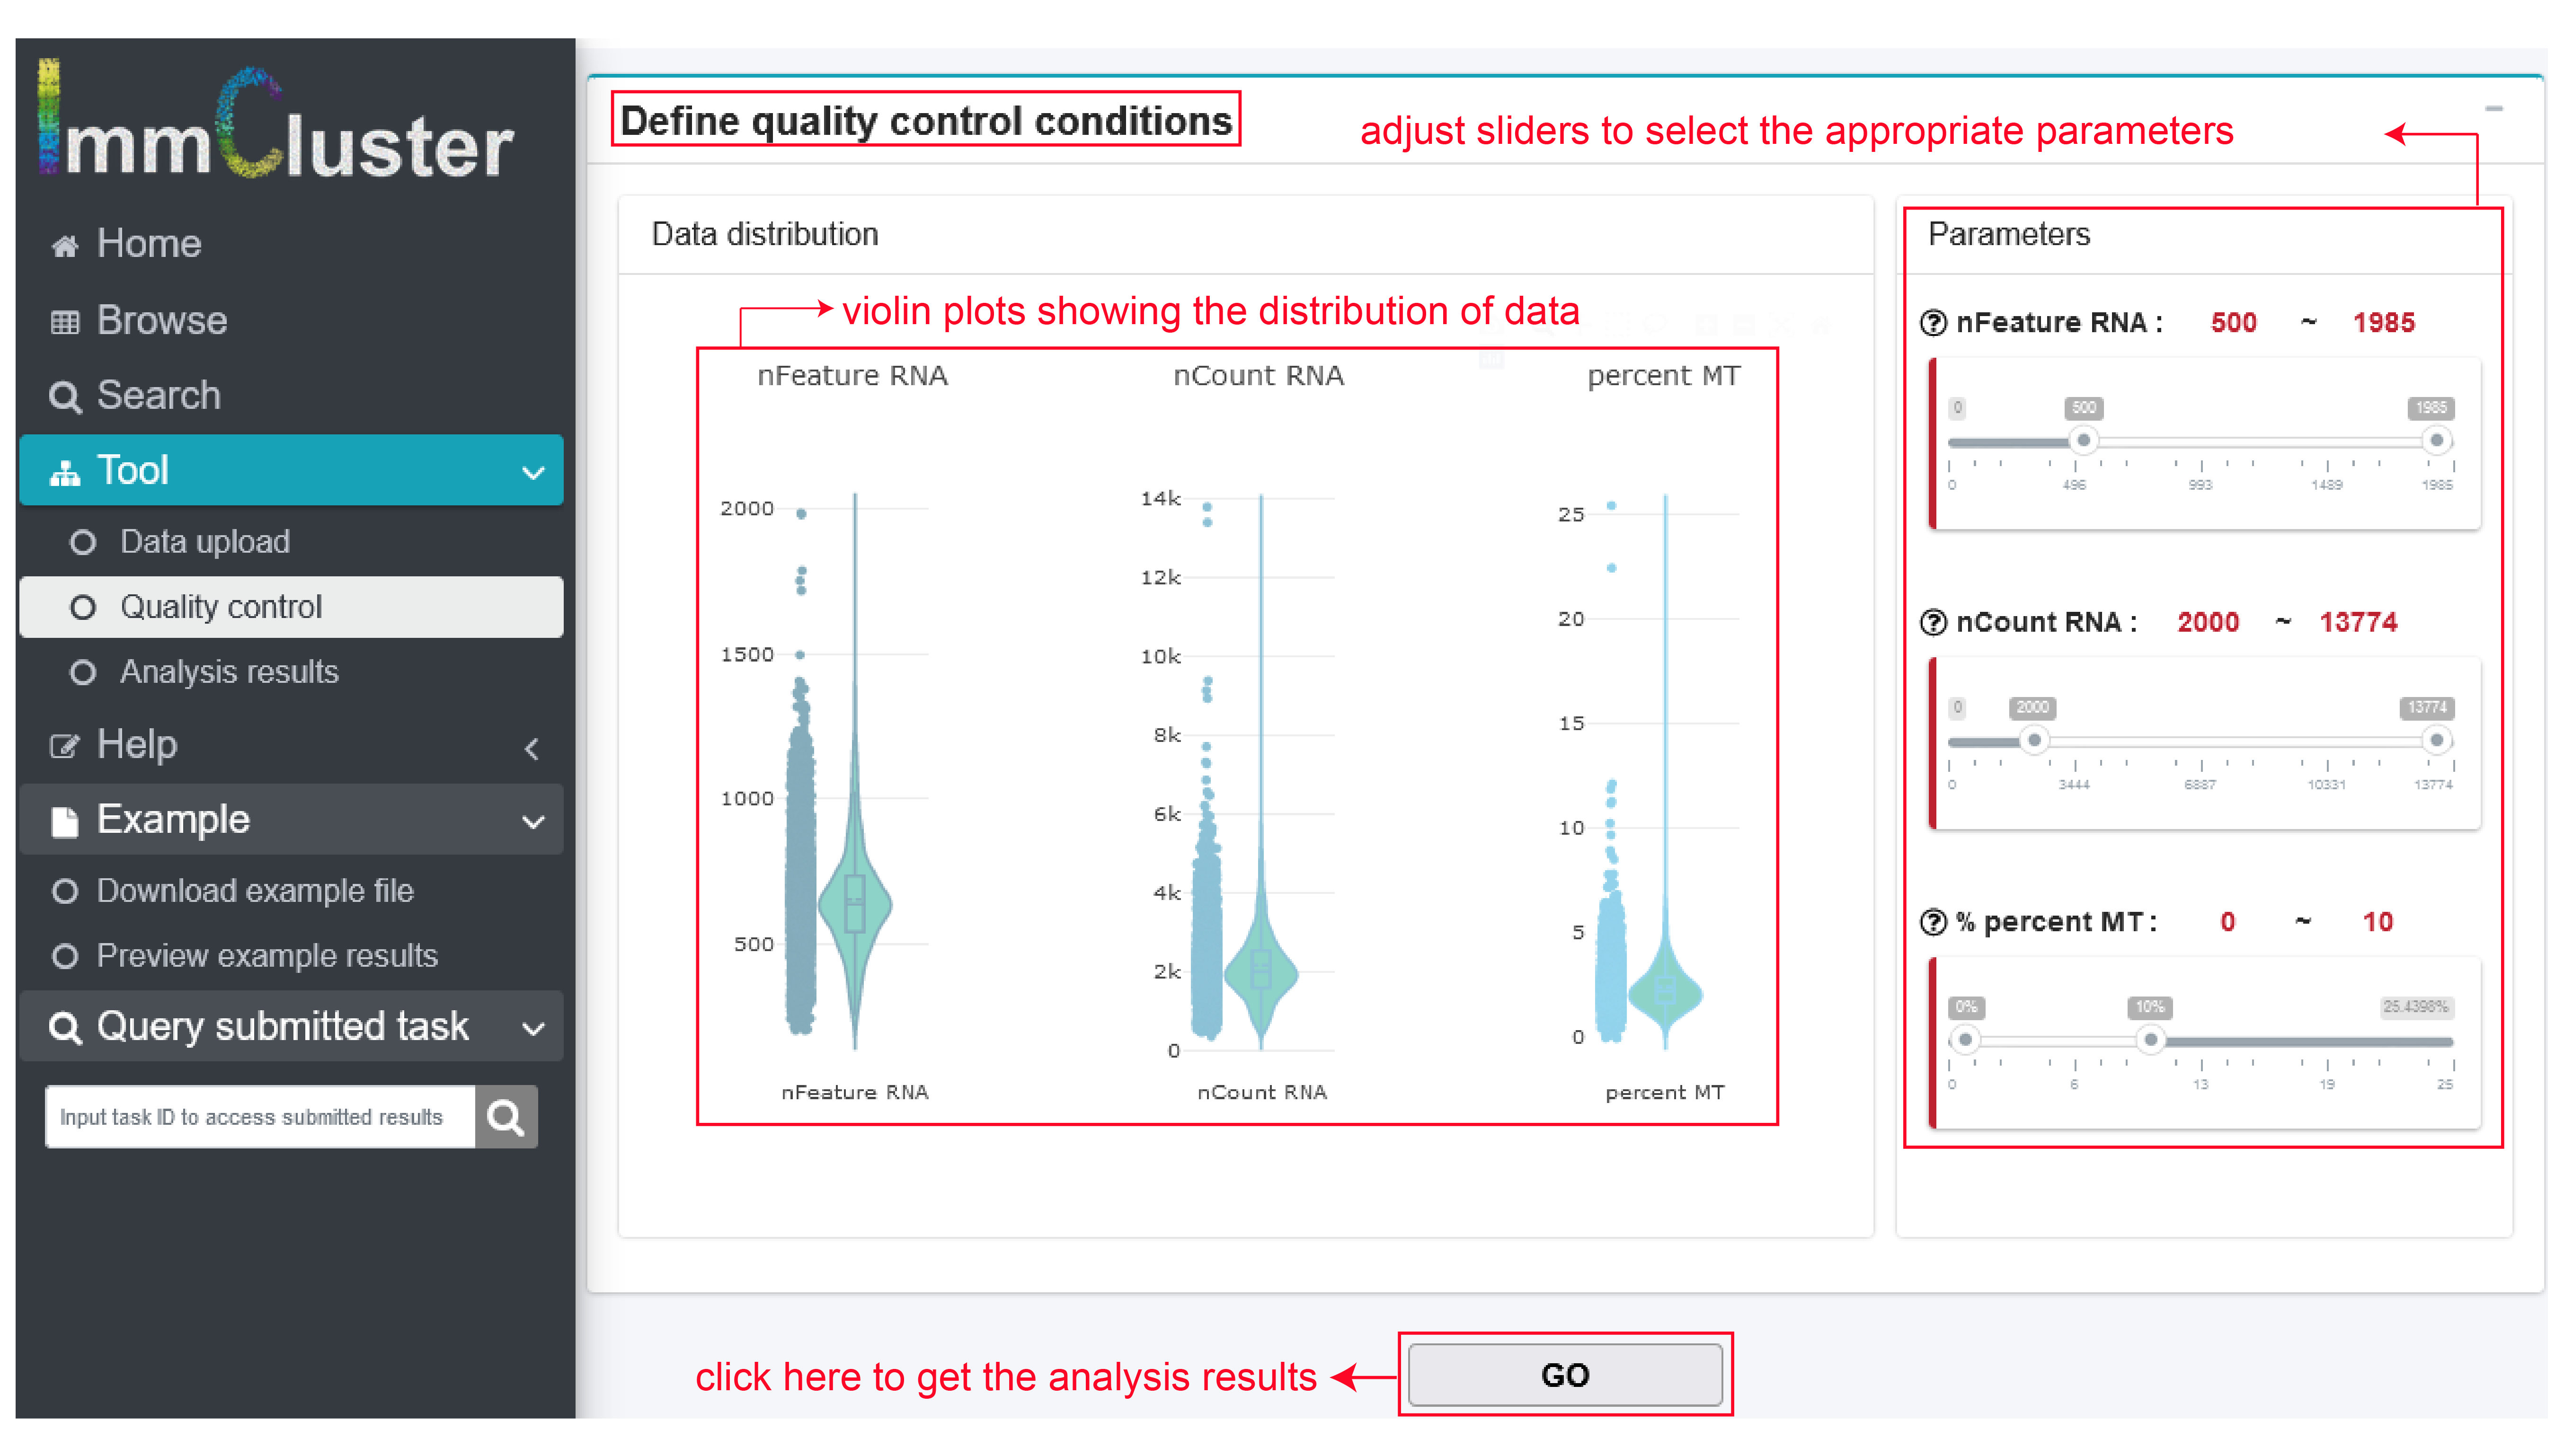
- Quality control. After data uploading and method selection, users can define quality control conditions according to data distribution by adjust the right sliders and GO.
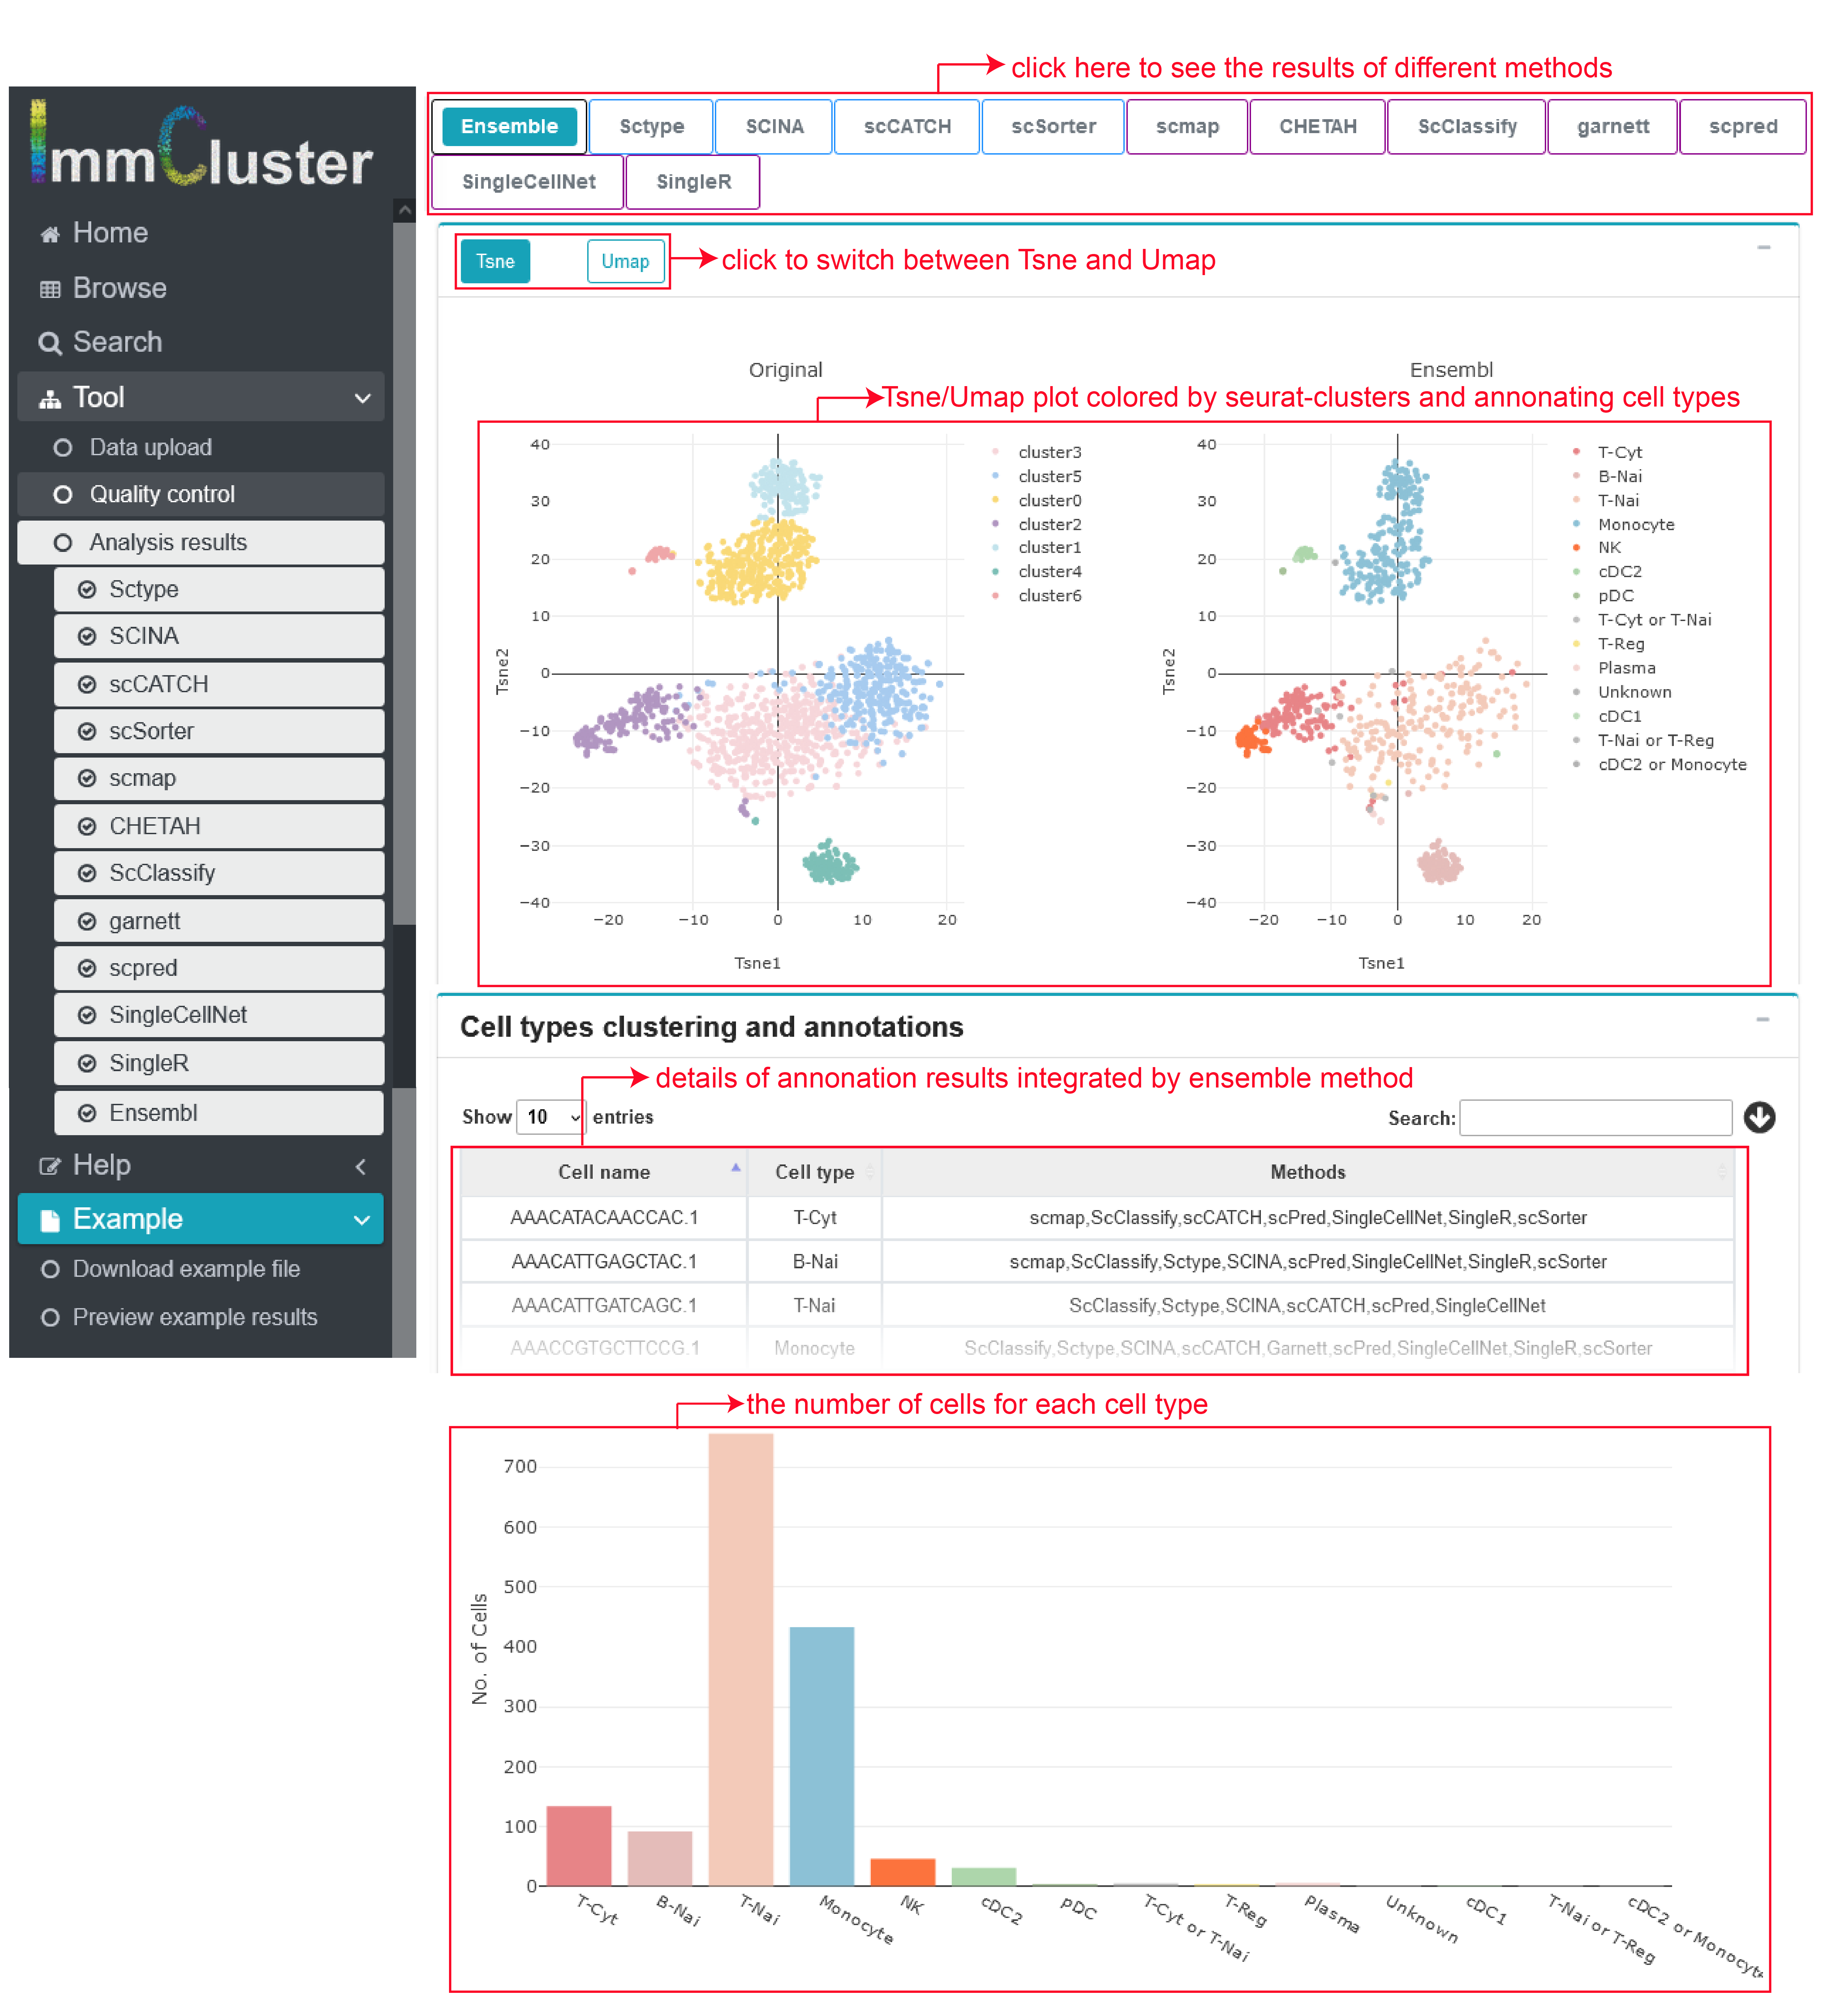
- Analysis results. Results of each method would be displayed in order and users can check them by clicking the button above. Only selected methods and the integrated results are available. Note that if different contexts are chosen, there would be two ensemble results.

Results of Annotation
ImmCluster provided four major analytic modules that allow users to interactively explore the annotations of immune cells.
I) Clustering and annotating the immune cell clusters
Firstly, two immune cell clustering plot, which represent clusters and annotated immune cell types of a certain method separately. Then, the annotating results for each cell can be check and downloaded in the following table and the barplot below gives the number of cells belonging to different cell types.
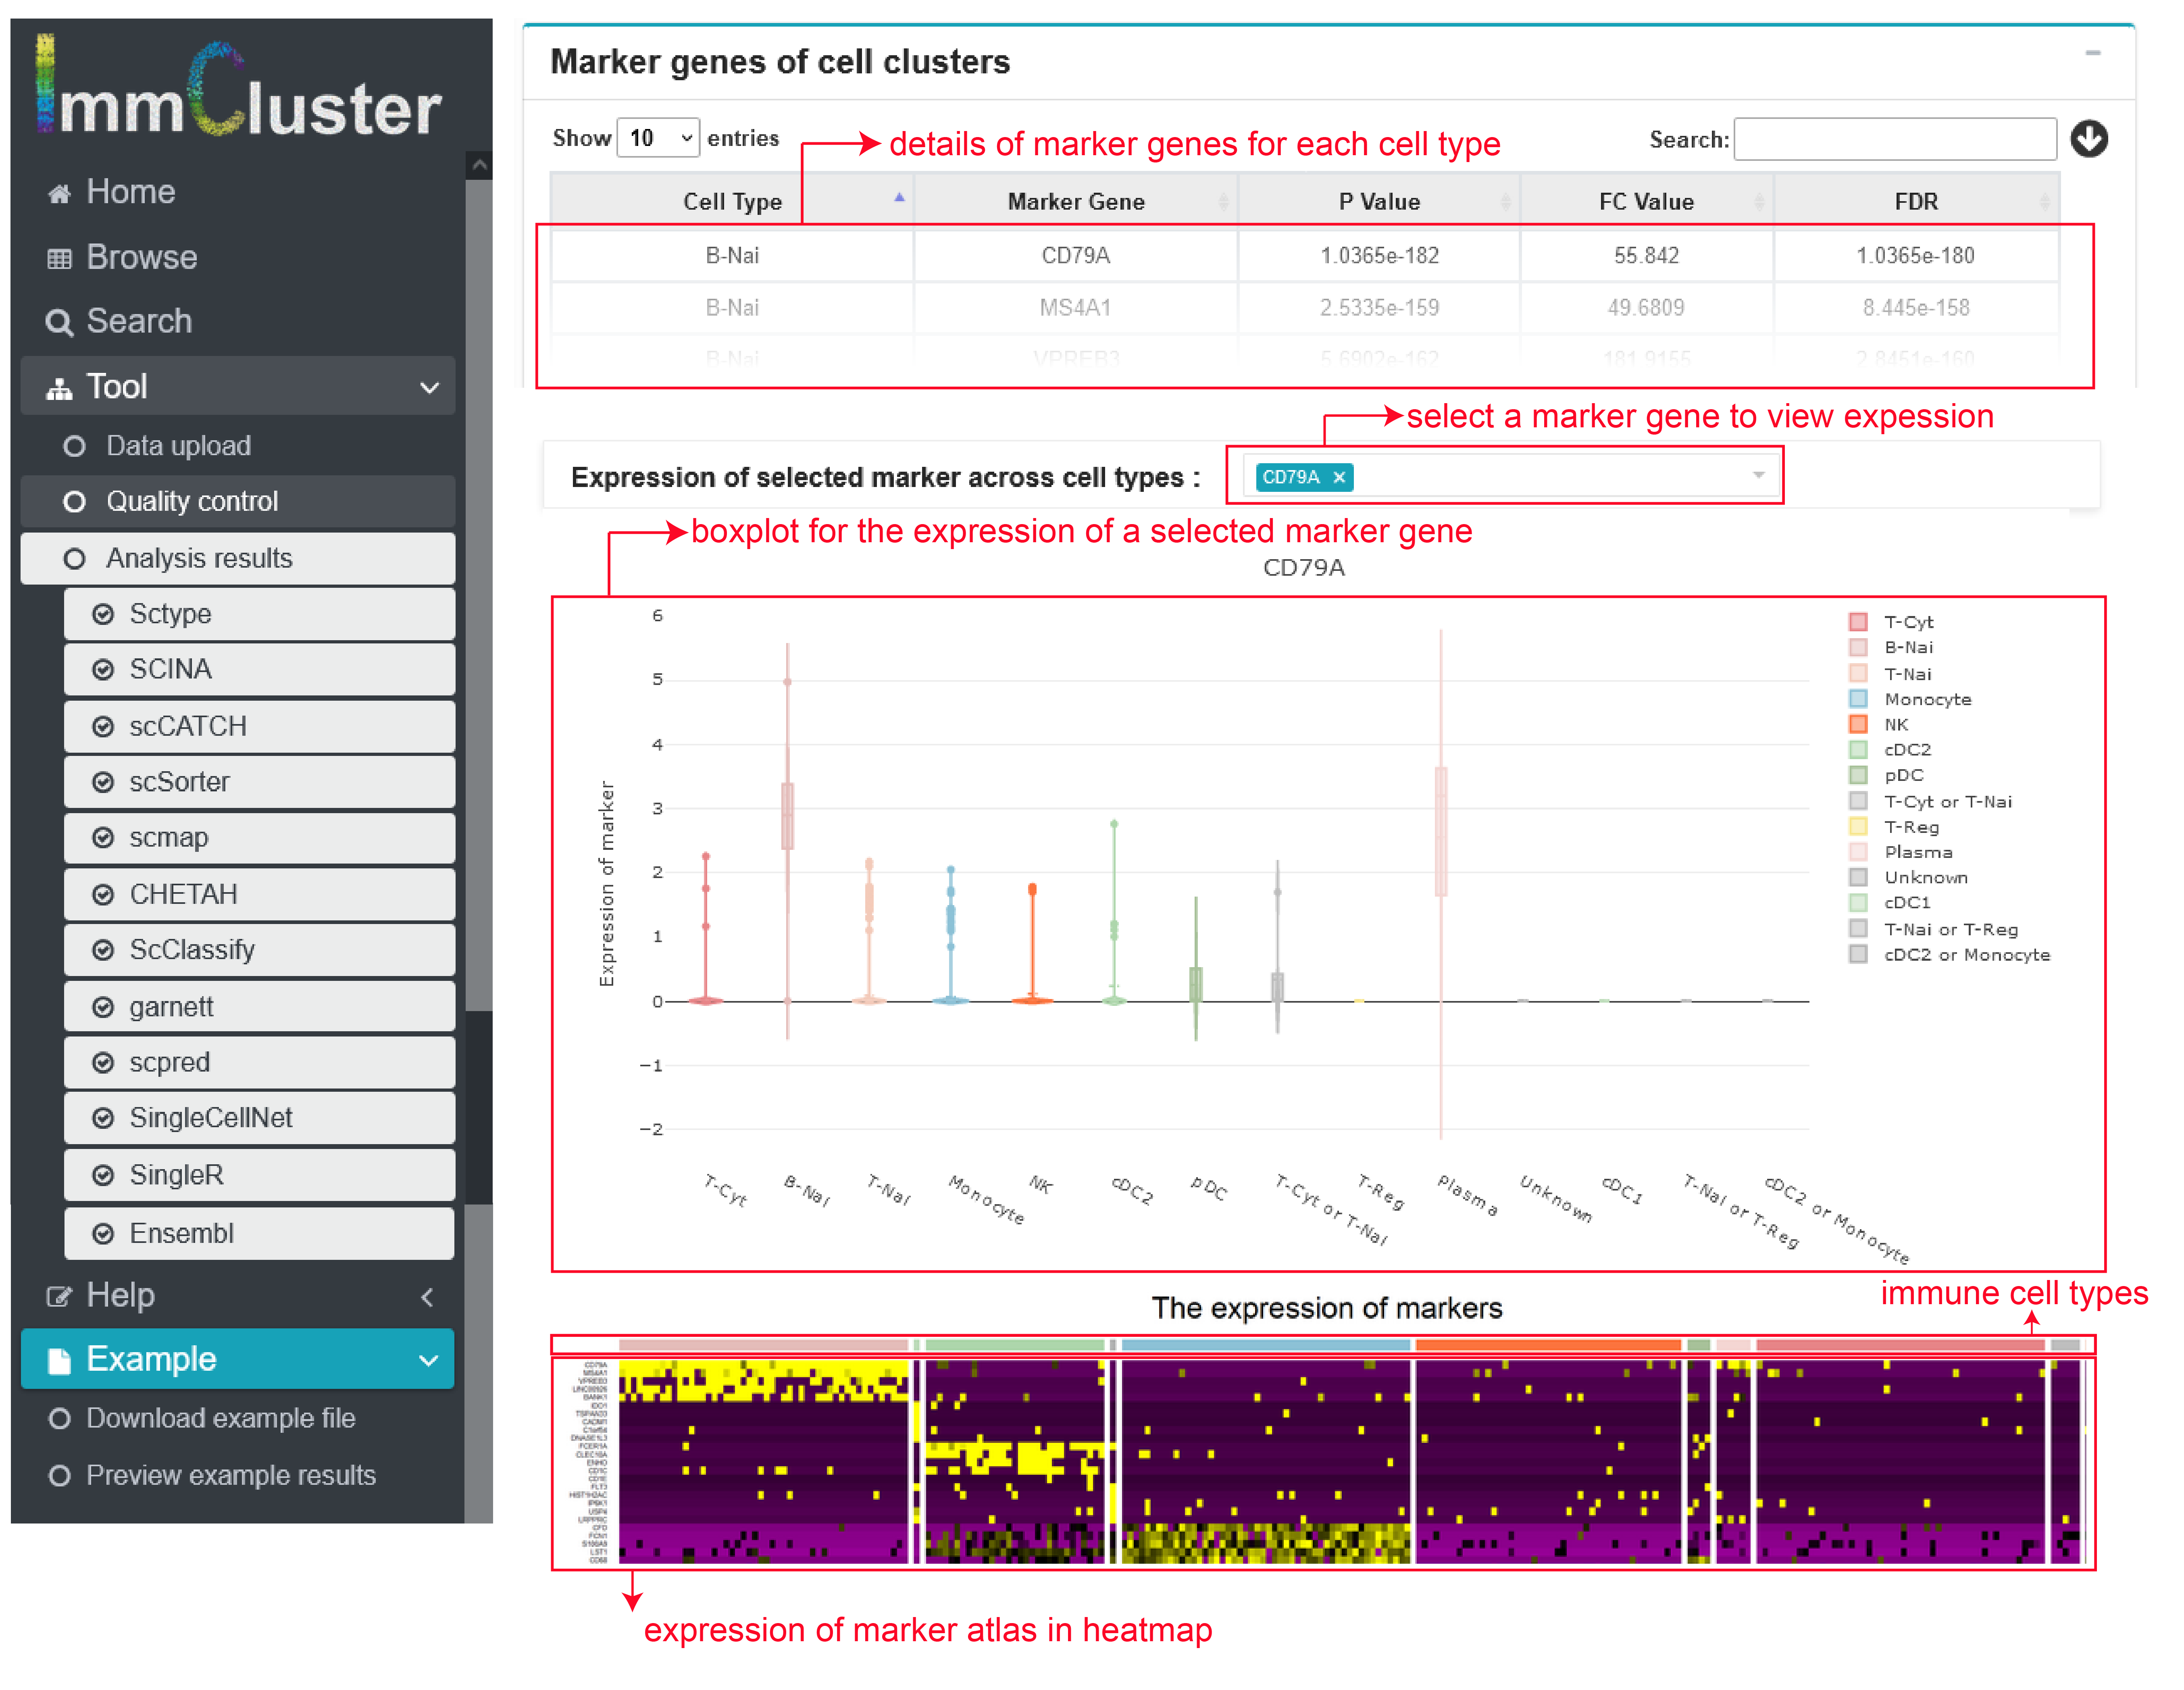
II) Gene expression of markers across cell clusters
Using COSGR, a method to rapidly identify highly expressed genes in single cell data, we provide a list of top 15 genes within each immune cell type ranked by the COSGR scores, which could also be downloaded. And the expression level of each gene can be selected to be shown in a violinplot. All top 15 genes’ expression were shown in a whole heatmap.
III) Functional assignment of the cell clusters
We calculate function scores of each immune clusters for cancer hallmarks, cell states and immune pathways through ssGSEA as shown in the heatmap plot. Asterisk indicates the significance of overlaps between the top 100 marker genes and the signatures of certain function, which would shown in the table.
IV) Cell-cell communications
We infer cell-cell communication based on the expression of ligands and their coupled receptors in scRNA-seq datasets by using three methods including iTALK, celltalker and ICELLNET. A table shows the communication score of each pair of ligand-receptor interactions occurred in two cell types. An overview of cell-cell communication and strong interactions ranked by the score will be displayed in a circle plot and a river plot, respectively.

Annotations of immune clusters from the page Browse


scRNA-seq data collection
We used a list of keywords ((scRNA seq OR single-cell RNA-seq) AND (cancer OR carcinoma OR adenocarcinoma)) to search datasets from GEO, 10X Genomics, and NGDC platform, and obtained 60 datasets of human single cell RNA-seq transcriptomes. In addition, for the datasets which were already annotated in the original publications, only cells identified as immune cell types were included. If the original publications not described, we only retain cells expressing PTPRC, a general marker of immune cells. Through literature review, the immune cell types in brain cancer are different from those of other solid tumors. After removing the data of glioma and following strict quality control, a total of 986,589 immune cells were remained, including 25 immune cell types from 17 cancer types and 49 immune cell types from 9 normal tissues.
scRNA-seq data filtering
After quality control of each scRNA-seq data, samples with the number of cells that were less than 50 or datasets with the number of cells that were less than 1000 were deleted. Besides, we filtered datasets or samples that seriously affect the effectiveness during data integration and batch effect correction.
Marker atlas developing *
1.Gene is detected in at least 3 cells at last 3 counts across all cells.
2.Gene in statistically significantly higher in expression in this cluster compared to the complement set. To establish significance, we used a two-tailed Mann-Whitney U test with multiple hypothesis correction,FDR < 5%.
3.Gene has maximal average expression in this cluster.
4.Gene satisfies the max-to-second-max ratio is at least 1.1x.
ensemble integration
We develop an integrating project to annotate immune cell types with a label matrix based on voting mechanism.
For each cell, the selected methods would give annotation results which are gathered and labeled. According to the frequency of immune cell types, we record the one which has the highest credibility with a 'real' label. When more than two label a cell hold, we define it as 'unknown'. Similarly, the cells with different immune lineages are also labeled as 'unknown'.
Cancer
| Short form | Full name |
|---|---|
| BCC | Basal cell carcinoma |
| BRCA | Breast invasive carcinoma |
| CHOL | Cholangiocarcinoma |
| CRC | Colorectal adenocarcinoma |
| CTCL | Cutaneous T cell lymphomas |
| HNSC | Head and Neck squamous cell carcinoma |
| KIRC | Kidney renal clear cell carcinoma |
| LIHC | Liver hepatocellular carcinoma |
| NSCLC | Non-small cell lung cancer |
| PAAD | Pancreatic ductal adenocarcinomas |
| SKCM | Melanoma |
| UVM | Uveal melanoma |
| MESO | Mesothelioma |
| HGSOC | high-grade serous ovarian cancer |
| PTC | papillary thyroid carcinoma |
| GC | gastric cancer |
| PCa | prostatic adenocarcinoma |
Tissue
| Short form | Full name |
|---|---|
| LNG | Lungs |
| LIV | Liver |
| OME | Omentum |
| SKM | Skeletal muscle |
| TCL | Transverse colon |
| DUO | Duodenum |
| JEJ | Jejunum |
| CAE | Caecum |
| ILE | Ileum |
| SCL | Sigmoid colon |
| BLD | Blood |
| THY | Thymus |
| JEJEPI | Jejunum-epithelial |
| JEJLP | Jejunum-lamina propria |
| PBMC | Peripheral blood mononuclear cells |
| LLN | Lung-draining lymph nodes |
| MLN | Mesenteric lymph nodes |
| SPL | Spleen |
| BMA | Bone marrow |
Cell type
| Short form | Full name |
|---|---|
| B-Lym | B lymphocyte |
| Plasma | plasma cell |
| B-Nai | naive B cell |
| B-Reg | regulatory B cell |
| B-Mem | memory B cell |
| B-Fol | follicular B cell |
| GC B | germinal center B cell |
| GC B-DZ | germinal center B cell in the dark zone |
| GC B-LZ | germinal center B cell in the light zone |
| NK | natural killer cell |
| T-Lym | T lymphocyte |
| T-Nai | naive T cell |
| T-Pro | proliferative T cell |
| T-TRM | tissue-resident memory T cell |
| T-EM | effect memory T cell |
| NKT | natural killer T cell |
| T-gd | gamma delta T cell |
| CD4+ T | CD4+ T cell |
| CD4+ T-Nai | naive CD4+ T cell |
| CD4+ T-Mem | memory CD4+ T cell |
| Th1 | T helper type 1 cell |
| Th2 | T helper type 2 cell |
| Th17 | T helper type 17 cell |
| T-FH | follicular T helper cell |
| T-Reg | regulatory T cell |
| CD8+ T | CD8+ T cell |
| CD8+ T-Nai | naive CD8+ T cell |
| T-Cyt | cytotoxic T cell |
| CD8+ T-Eff | effector CD8+ T cell |
| CD8+ T-Mem | memory CD8+ T cell |
| T-Exh | exhausted T cell |
| Myeloid | myeloid cell |
| Monocyte | monocyte |
| Macrophage | macrophage |
| Mac-M1 | M1-type macrophage |
| Mac-M2 | M2-type macrophage |
| DC | dendritic cell |
| cDC1 | conventional type 1 dendritic cell |
| cDC2 | conventional type 2 dendritic cell |
| aDC | active dendritic cell |
| pDC | plasmacytoid dendritic cell |
| Neutrophils | neutrophil |
| MAST | mast cell |
| Progenitor | progenitor |
| Erythroid | erythroid |
| Cycling | cycling cell |
| Pre-B | precursor B cell |
| Pro-B | progenitor B cell |
| GC B-I | GC B-I |
| GC B-II | GC B-II |
| Plasmablasts | plasmablast |
| ABC | age-associated B cell |
| NK-CD16+ | CD16+ natural killer cell |
| NK-CD56bright-CD16- | CD56bright CD16- natural killer cell |
| T&NK-Cyc | Cycling T&natural killer cell |
| T-CD4;CD8 | CD4+ T cell;CD8+ T cell |
| T-Eff;EM-CD4 | effector T cell;effect memory CD4+ T cell |
| T-EM;EMRA-CD8 | effect memory T cell;EMRA CD8+ T cell |
| T-Nai;CM-CD4 | naive T cell;center memory CD4+ T cell |
| T-Nai;CM-CD4-Act | naive T cell;activated center memory CD4+ T cell |
| T-Nai;CM-CD8 | naive T cell;center memory CD8+ T cell |
| T-RM;EM-CD8 | tissue-resident memory T cell;effect memory CD8+ T cell |
| TRM-gut-CD8 | tissue-resident memory_gut_CD8 T cell |
| TRM-Tgd | tissue-resident memory_gamma delta T cell |
| TRM-Th1;Th17 | tissue-resident memory_T helper type 1 cell;T helper type 17 cell |
| Tgd-CRTAM+ | CRTAM+ gamma delta T cell |
| MAIT | mucosal associated invariant T cell |
| T;B | T lymphocyte;B lymphocyte |
| MNP;B | MNP;B lymphocyte |
| MNP;T | MNP;T lymphocyte |
| Megakaryocytes | megakaryocyte |
| Mon-Cls | classical monocyte |
| Mon-nonCls | non-classical monocyte |
| Mac-Ery | erythrophagocytic macrophage |
| Mac-Alv | alveolar macrophage |
| Mac-IntMed | intermediate macrophage |
| Mac-Int | intestinal macrophage |
| DC1 | conventional type 1 dendritic cell |
| DC2 | conventional type 2 dendritic cell |
| migDC | migratory dendritic cell |
| ILC3 | type 3 innate lymphoid cell |
Methods link
1.Normal tissues from healthy donor
1.1 No. of immune cells
1.2 No. of samples
1.3 No. of marker genes
2.Cancer types
2.1 No. of immune cells
2.2 No. of samples
3.3 No. of marker genes
II. Q & A
Users can get a tSNE and UMAP plot for visualizing clustering results of normal cells or cancer cells by clicking on any cancers and tissues in Browse.
As we known,a comprehensive annotation for immune cell types after clustering are often elusive and inaccurate. What calls for special attention is that the canonical marker genes for each immune cell type are limited. Here, we collected multiple sets of cancer and normal single-cell RNA-seq transcriptome from different tissues and organs and identified multiple cell types through clustering and manual inspection. Through integrating a variety of calculation methods based on reference or marker genes for annotating the cell types of the data uploaded by users, we will map them to the most likely cell types.
After uploading a scRNA-seq expression profile and defining the parameters , users can check and download all the annotation results as long as subsequent analysis in Annotation-Analysis results.
Users can specify one or more interested calculation methods based on reference or marker genes by choosing them in Annotation-Data upload-Choose method . When the computations have been done, the results of most suitable prediction method for the uploaded data according to the annotation results could be chosen.
Considering the heterogeneity of tumor microenvironment and normal tissue, we characterized multiple independent reference profiles and identified specific marker atlas of immune cell types for different context.
ImmCluster is a annotation tools for single-cell RNA-seq data, users can not provide a bulk RNA-seq expression data to ensure the accuracy of the results.
If Users have other question, email bioinformatics2021@163.com We will give an answer as soon as we can.