Basics
-
Background of LncACTdb 3.0
LncACTdb, with the first version released in 2015, and the second version released in 2019, is a continually updated database that is used specifically to store experimentally validated ceRNA interactions manually curated from different species and disease states. Two versions of LncACTdb were both published on Nucleic Acids Research. Up to now the two papers have been cited 207 times (Google Scholar), and have been selected as ESI Highly Cited Papers in Web of Science. LncACTdb database is visited about 10,000 times from 73 countries(before Sep 2021). Emerging evidence suggests that microRNA (miRNAs) are themselves regulated by endogenous molecules carrying miRNA binding sites, such as lncRNAs, pseudogenes and circular RNAs. These competitive inhibitors bind miRNAs and competitively sequester them from their natural targets. The kind of competing endogenous RNAs (ceRNAs), act to dynamically buffer the expression of each other in different physiological and pathological processes. Previously, we developed LncACTdb database, which can serve as a tool for dissecting the ceRNA regulation in various cancers and identifying novel cancer biomarkers. Since its first release in 2015, more ceRNA interactions have been published, especially experimentally validated ceRNAs in various disease states, and a public resource of high-quality curated experimentally validated ceRNA interactions and personalized ceRNA networks remains unavailable. There is a great need to update LncACTdb with more resources and improved tools.
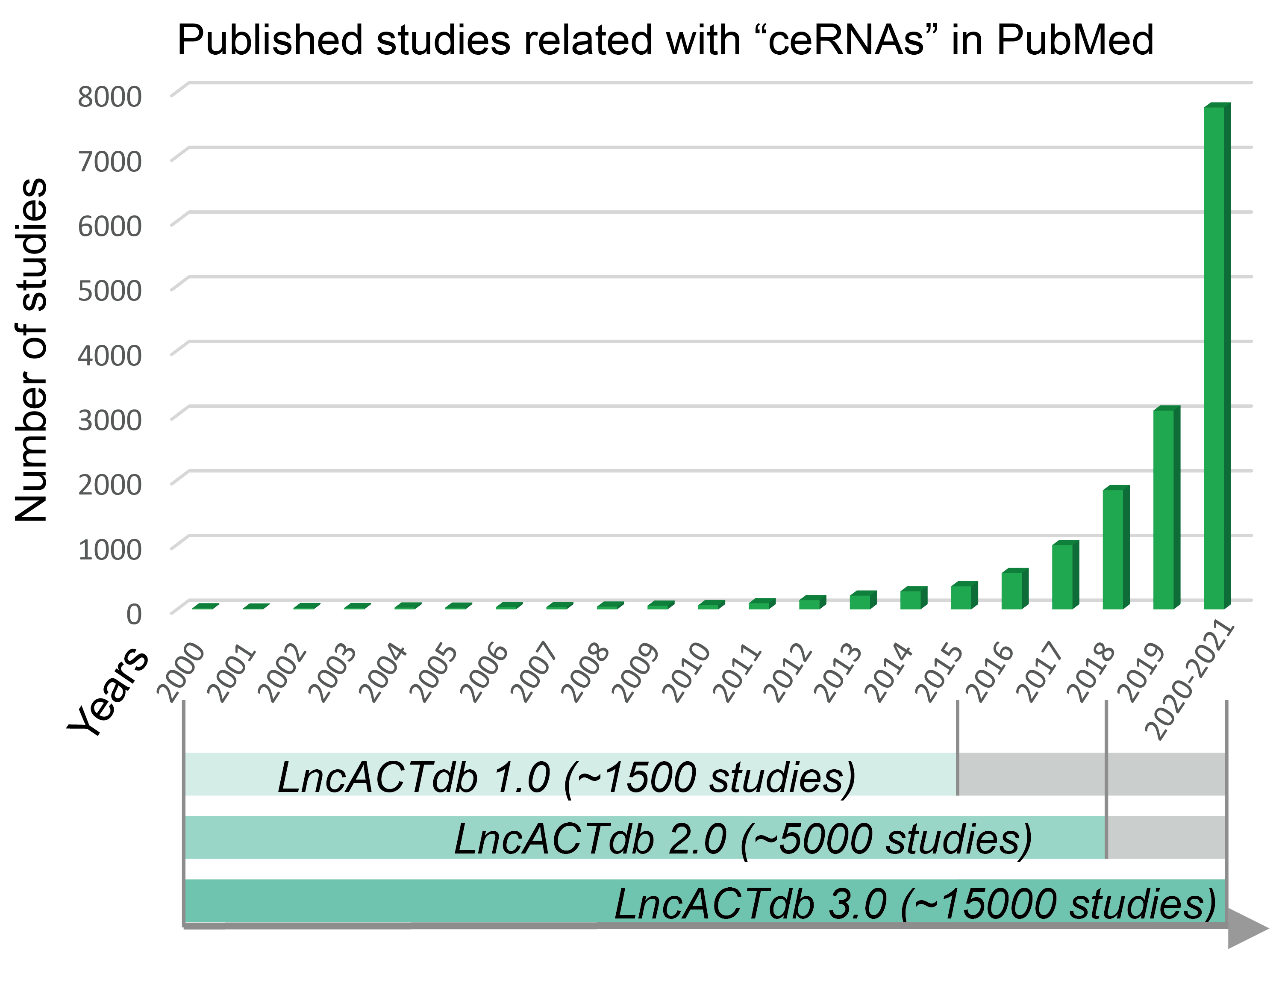
Figure 1. The development of LncACTdb database and collection of ceRNA related studies in recent years.
LncACTdb 3.0 is a comprehensive database of experimentally supported competing endogenous RNA (ceRNA) interactions and personalized networks contributing to precision medicine. LncACTdb 3.0 is freely available at http://bio-bigdata.hrbmu.edu.cn/LncACTdb or http://www.bio-bigdata.net/LncACTdb. We have updated LncACTdb 3.0 database with several new data and features, including: (i) more than 5,667 experimentally validated ceRNA interactions across 24 species and 536 diseases/phenotypes through manually curating of published literature; (ii) personalized ceRNA interactions and networks for 16,228 patients from 62 datasets in TCGA and GEO; (iii) manual curation of ceRNA sub-cellular and extracellular vesicle locations from literatures and related data sources; (iv) more than 10,000 experimentally supported lncRNA biomarkers associating with tumor diagnosis and therapy; (v) curation of lncRNA\mRNA\miRNA expression profiles with clinical and pathological information of thousands of cancer patients. Under the complex disease pathology and patient-specific background, a panel of improved tools have been developed to explore ceRNA effectson individuals. For example, the Network tool provides global view of lncRNA related ceRNA networks, patient-specific ceRNA networks, and customize designed ceRNA networks. Collectively, we believe that LncACTdb 3.0 will provide novel insights into the studying of disease pathology on individual level and further contribute to precision medicine.
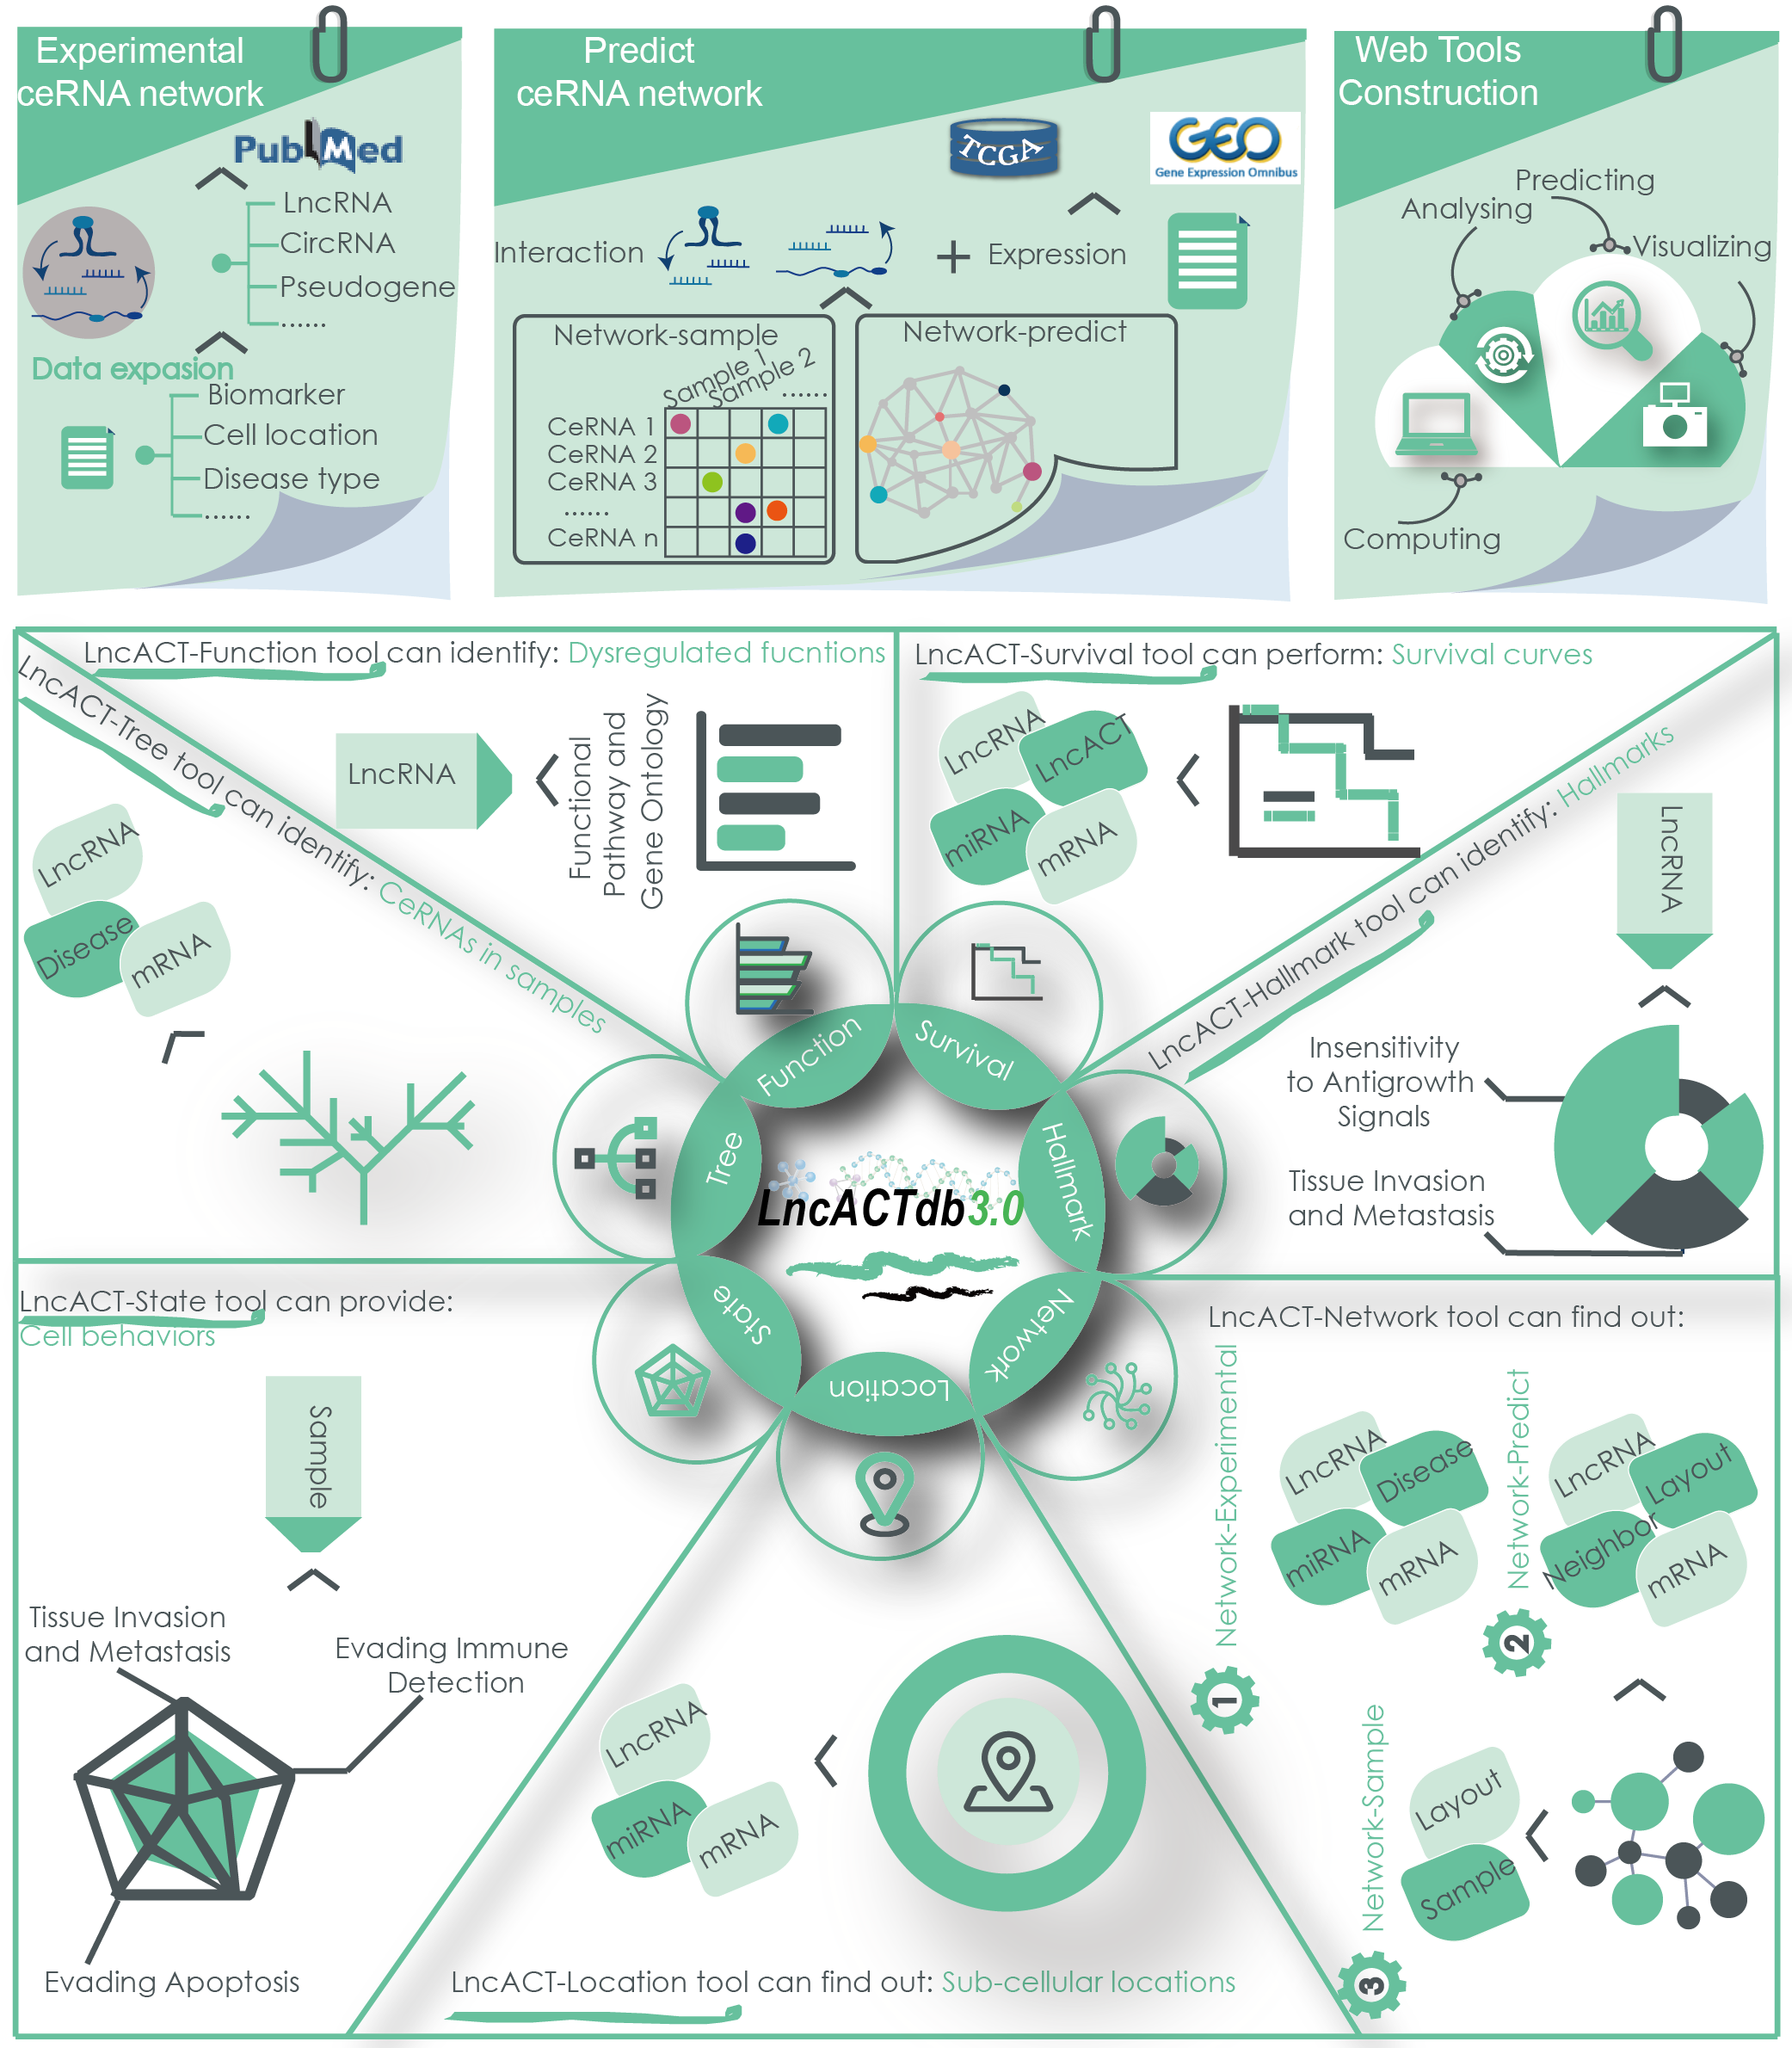
Figure 2. The data expansion and featuresof LncACTdb 3.0.
-
Manual curation of high-confidence experimentally verified ceRNAs
We performed manually curation of experimentally verified ceRNA interactions from published articles. In this update, we retrieved published literatures from PubMed database by employing combination of key words including "(lncrna OR lincrna OR long non-coding) AND (miRNA OR microrna OR mir) AND (sponge OR ceRNA OR competing OR compet OR competence OR mediate OR mediated OR interaction) OR (ceRNA) OR (miRNAs sponge) OR (miRNA decoy) OR (miRNA target lncRNA)" and found more than 15,000 relevant articles (before Sep2021). These candidate articles were reviewed by at least two researchers. In this step, the searchers will confirm that if the regulation relationship between each competing RNA members were verified by one of the high-confidence experimental methods, including qRT-PCR, western blot, luciferase reporter assay, RNAi, in vitro knockdown, RNA immunoprecipitation or other reliable experiments. Our researchers filter the ceRNA associations based on following criteria: (i) if the RNAs within a ceRNA interaction act to dynamically regulate the expression of each other, (ii) if the RNAs within a ceRNA interaction share the same miRNA binding site and (iii) ceRNA entries that were simultaneously confirmed by at least two researchers were retained. We retrieved more ceRNA types such as lncRNAs,coding-mRNAs, pseudogenes, lncRNAs, circular RNAs, intruded viral RNAs and technically engineered RNAs.For each ceRNA interaction, detail information including members of ceRNAs, species, tissues/cell lines, disease/phenotype, experimental methods, PubMed ID, article title, citation and a functional description from the original studies were collected. Currently, LncACTdb 3.0 documents a numberof 5,667 high-confidence experimentally verified ceRNAs interactions. The scope of LncACTdb 3.0 is expanded to 24 species and 536 associating diseases/phenotypes.The full list of experimentally verified ceRNA interactions can be downloaded at http://bio-bigdata.hrbmu.edu.cn/LncACTdb/Lncact_down.jsp.
-
Manual curation of lncRNA biomarkers
In LncACTdb 3.0, we performed manual curation of experimentally supported lncRNA biomarkers to provide new insight into tumor diagnosis and therapy.We used the following combination of key words “(circulating OR drug-resistant OR prognostic OR immune OR metastasis OR recurrence OR cell growth OR EMT OR apoptosis OR autophagy) AND (lncRNA)” to collect diagnostic and therapeutic biomarkers. A biomarker was selected if the lncRNA wasassociating with this processes by over-expression, RNA knockdown or other functional experiments. Finally, a total of 10,084 experimentally supported lncRNA biomarkers associated with drug resistance, circulation, survival, immunity, metastasis, recurrence, cell growth, EMT, apoptosis, and autophagy were manually curated from literature, and integrated into the LncACTdb 3.0 database.
-
Curation of functional annotations and functional analysis
LncACTdb 3.0 provides the Function tool to perform functional analysis of lncRNAs based on 'guilt-by-association' strategy. For a lncRNA, its downstream mRNAs were used to performed function enrichment analysis. LncACTdb 3.0 curated thousands of pathways and biological terms as functional background. For biological pathway andGene Ontology (GO) annotation, a total number of 1,329 pathways including KEGG (1), BioCarta (https://cgap.nci.nih.gov/Pathways), Reactome (2), PID (3) , STKE (http://stke.sciencemag.org/), SIG (http://www.signaling-gateway.org/), andatotal number of 5,917 gene sets representing functional GOtermswere collected were collected from MSigDB (4). Gene sets of cancer hallmark processes, which have been determined to promote tumor growth and metastasis (5),including Evading Apoptosis, Evading Immune Detection, Genome Instability and Mutation, Insensitivity to Antigrowth Signals, Limitless Replicative Potential, Reprogramming Energy Metabolism, Self-Sufficiency in Growth Signals, Sustained Angiogenesis, Tissue Invasion and Metastasis and Tumour Promoting Inflammation have been downloaded from our previous study(6).To study the ceRNA effects on tumor cell states, we downloaded the characteristic gene sets corresponding to the 14 functional states from CancerSEA, including angiogenesis, apoptosis, cell cycle, differentiation, DNA damage, DNA repair, EMT, hypoxia, inflammation, invasion, metastasis, proliferation,quiescence and stemness(7). We performed Hypergeometric test calculate the enrichment significance based on different pathway and GO gene sets. We used N indicates the number of genes in functional context, Sindicates the number of genesinvolved in the function set under investigation, Mindicates the number of interesting target genes for analysis, and x indicates the number of genes were involved in the same function gene set, then the P value can be calculated as:
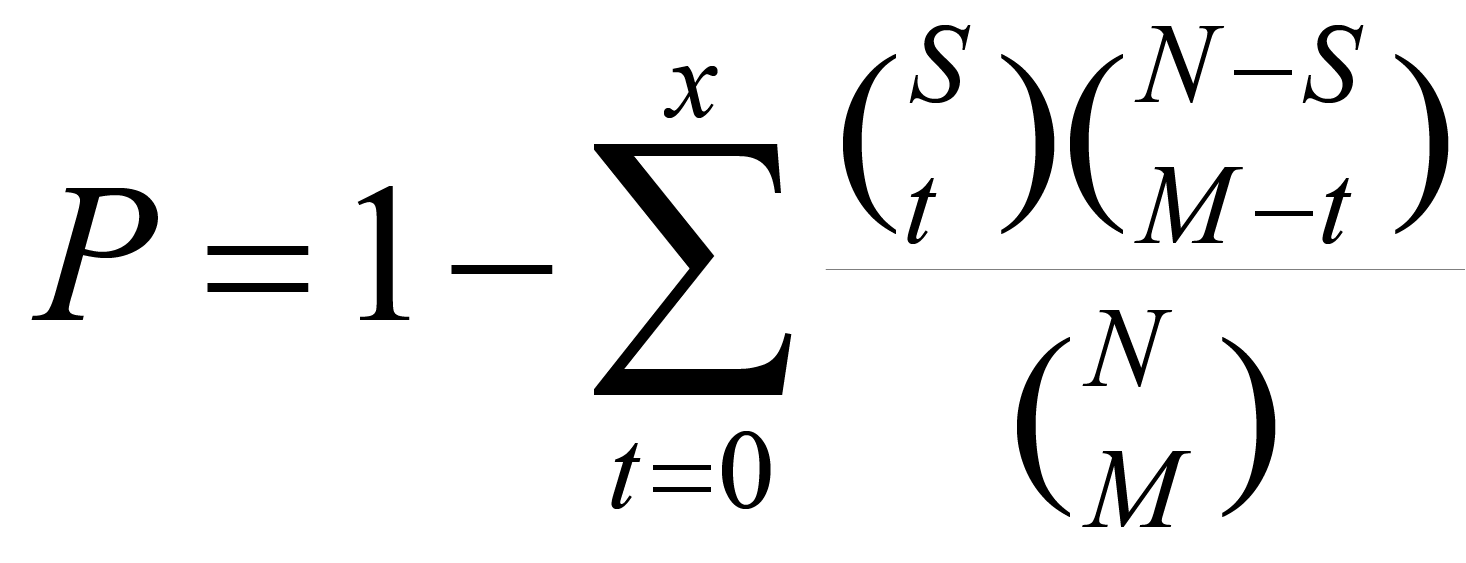
Significantly enriched functions was defined at P<0.05 threshold and further illustrated as bar graph based on –log 10 transformed P values.For individual function analysis, the R package GSVA was used to evaluate the functional state of each patient based on cancer hallmark and cell state gene sets(8). -
Identification of sample-specific ceRNAs and construction of networks
First,candidate ceRNA pairs were collected from two databases: starBase v2.0(9) and LncACTdb 2.0(6). A total of 108,668 candidate ceRNA regulations were collected. To verify whether these ceRNA pairs were associated with each other in a specificsample we used a published method for sample-specific network construction based on probability theory to identify ceRNA networks for the sample(10). We assume that each ceRNA pair may have an association in some samples but not in other samples due to differences in sample types.
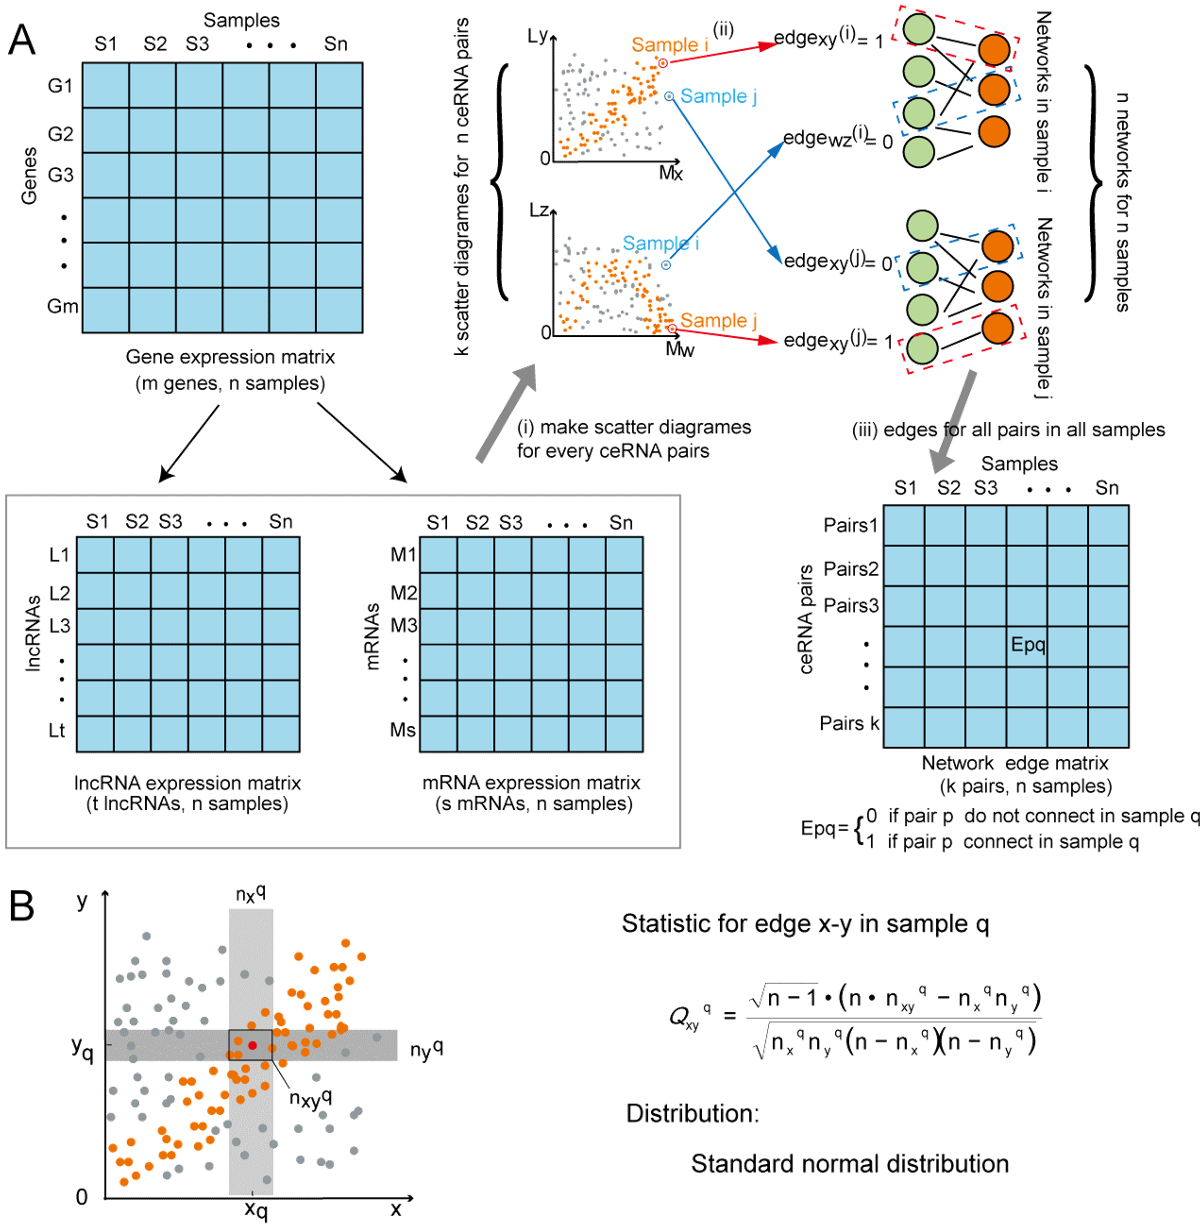
Figure 3. Sample-specific ceRNA networks construction and our statistical model.
We determined whether lncRNAs and mRNAs were related in a specific sample by testing the statistical independence of the candidate ceRNA expression values in the same sample. For a ceRNA pair of x(mRNA) and y(lncRNA) in sample q, we calculated the following statistic:
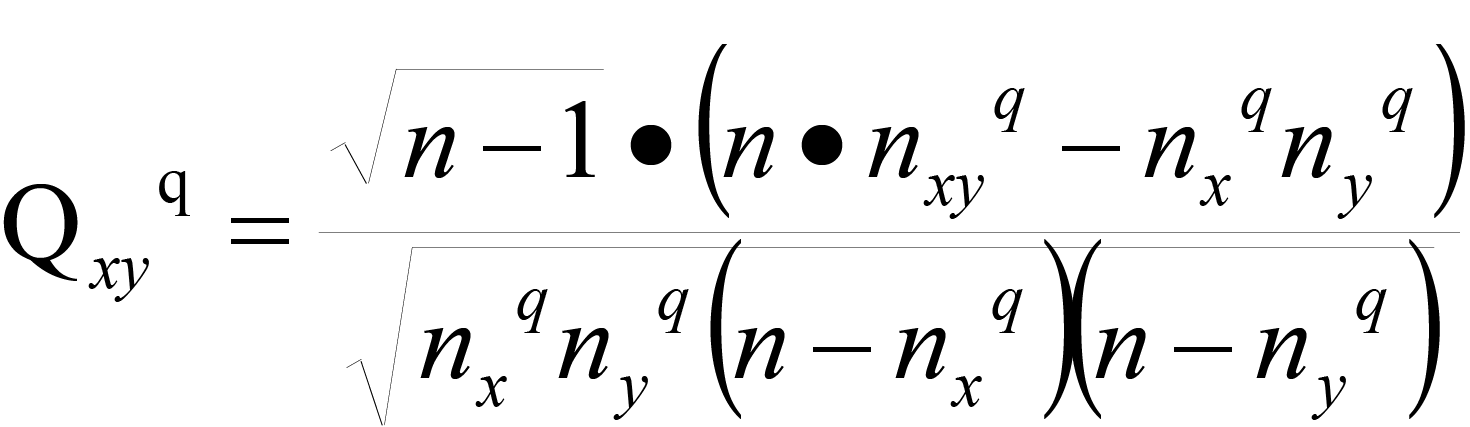
Where n is the total number of samples. nxqand nyq are predetermined integers. We set nxq= nyq = 0.1n . We draw the first two boxes near nxq and nyq , based on the predetermined nxq and nyq , and then we have the third box, which is simply the intersection of the previous two boxes. Thus, we can obtain the value of nxyq by counting the plots in the third box. If x and y are independent of each other, this statistic follows a standard normal distribution and the mean value and variance for the n samples are 0 and 1, respectively. Therefore, we can determine the significance of the x, y correlation with this statistic. edgexyq is set to 1 in the network of sample q with a false discovery rate (FDR) < 0.05. We retained pairs that meet FDR <0.05 for network construction in a specific sample. The algorithm requires that expression data set must include both mRNA and lncRNA expression and it works better when the number of samples is greater than 100.This method is not sensitive to the normalisation method for gene expression matrices. In RNA-seq data, the statistic may result in zero due to experimental errors, which is meaningless in biology and may produce errors in the data analysis. Hence, we treat the zeros in the following way (10): (1) If we cannot distinguish whether or not the zeros result from zero expression or the experimental errors, edgexyq is set to 0 when xq = 0 or yq = 0 without the consideration of the statistic. (2) If we know that the zeros result from the zero expression, edgexyq is determined by the statistic.
-
Identification of cancer-specific ceRNAs
Based on the above pipeline, we purified ceRNA pairs in a cancer-specific way. The specificity of the ceRNAs was characterized quantitatively by calculating the specificity score using a previously described method (11-13). For a ceRNA, the specificity score was calculated as:
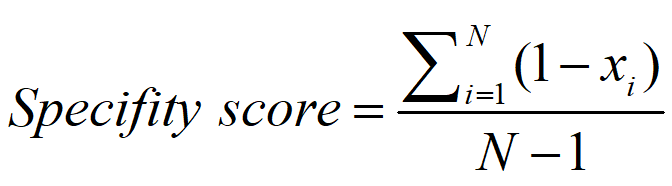
Where N is the number of cancers and xi is the percentage of samples in which the ceRNA can be found in a cancer. The value of xi is normalized to the maximum percentage values of cancers. For example, the specificity score for a ceRNA with percentage profile of ‘0 0 0.2 0 0 0 0 0.2 0 0 0.8 0’ is calculated as 0.9545. The range of specificity scores is between 0 and 1, while a perfect specific pattern would be scored as 1.According to an earlier study(1), an specificity score<0.15 indicates a housekeeping gene. We used the specificity score>0.5 as threshold to purified cancer-specific ceRNAs.
-
Survival analysis
LncACTdb 3.0 performs COX survival analysis and Kaplan-Meier survival curves for ceRNAs, lncRNAs, miRNAs and mRNAs. The clinical follow-up information of patients from TCGA and GEO were collected. A univariate COX regression model was built to evaluate the association between survival and expression level of each lncRNA-miRNA-mRNA member in a ceRNA interaction. A risk score formula was developed to evaluate the association between survival time, living status and expressions, which takes into account both the strength and positive/negative association between each gene and probability of survival. The integrated risk score for each patient was calculated based on the linear combination of ceRNAs expression values weighted by the Cox regression coefficients:
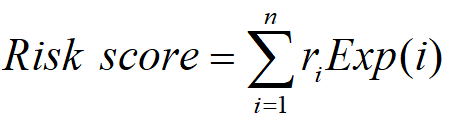
In which ri is the COX regression coefficients for lncRNA, miRNA and mRNA, n is the number of genes, and Exp(i) is the expression value of gene in patient i . We used the median and mean risk score as cut-off to classify patients into different risk groups.
-
Network construction and illustration
In LncACTdb 3.0, the Network tool constructs and illustrates ceRNA network in the following ways:
(i) Gene-centric
For a lncRNA or mRNA, LncACTdb 3.0 provides a global view of all possible related ceRNAs relationships. A network consisting of this lncRNA or mRNA and its associated competing neighbors was constructed and illustrated by a Java script plugin ECharts (V4.0). The ceRNA network scale can be reset by selecting different steps of neighbours. In the one-step-neighbours scale, the top 20 competing mRNA partners (ordered by activity score) of the lncRNA were illustrated. In the two-step-neighbours and three-step-neighbours scale, this network will expand to another 20 and 40 competing lncRNAs and mRNAs.
(ii) Patient-centric
For a cancer sample, LncACTdb 3.0 provides a patient-specific ceRNA network. In this section, users can input the sample name to obtain a patient-specific ceRNA network. In the network, ceRNA interactions were determined to be specifically active a sample by testing the statistical independence of the candidate ceRNA expression values. When users move the cursor over a node in the network, all edges and nodes connected to it are highlighted. Different network layouts, such as the circular layout and force layout can be used to illustrate the network.
(iii) User-designed
For user selected data, LncACTdb 3.0 provides a user-designed ceRNA network in which lncRNAs, miRNAs, mRNAs and diseases were determined by users. This network were constructed based on the experimentally validated ceRNA relations in LncACTdb 3.0. The network degree of ceRNAs was list in a data table. Users can starts a new search of experimentally validated ceRNA relations by clicking an interesting gene in the network. -
The BLAST method
As described in LncACTdb 2.0, the current database also allows users to query dataset by inputting custom sequences. The Basic Local Alignment Search Tool (BLAST, https://blast.ncbi.nlm.nih.gov/Blast.cgi) were integrated into LncACTdb 3.0 to compare inputting sequence to our database and calculates the statistical significance of matches. The parameters for running BLAST were set as -perc_identity 80 -outfmt "7 qacc sacc evalue length pident". To filter results, we used “>80% identity” as the threshold to identify had high similarity sequences.
-
References
1* Kanehisa, M., Goto, S., Sato, Y., Furumichi, M. and Tanabe, M. (2012) KEGG for integration and interpretation of large-scale molecular data sets. Nucleic acids research, 40, D109-114.
2* Croft, D., Mundo, A.F., Haw, R., Milacic, M., Weiser, J., Wu, G., Caudy, M., Garapati, P., Gillespie, M., Kamdar, M.R. et al. (2014) The Reactome pathway knowledgebase. Nucleic acids research, 42, D472-477.
3* Schaefer, C.F., Anthony, K., Krupa, S., Buchoff, J., Day, M., Hannay, T. and Buetow, K.H. (2009) PID: the Pathway Interaction Database. Nucleic acids research, 37, D674-679.
4* Liberzon, A., Birger, C., Thorvaldsdottir, H., Ghandi, M., Mesirov, J.P. and Tamayo, P. (2015) The Molecular Signatures Database (MSigDB) hallmark gene set collection. Cell systems, 1, 417-425.
5* Hanahan, D. and Weinberg, R.A. (2011) Hallmarks of cancer: the next generation. Cell, 144, 646-674.
6* Wang, P., Li, X., Gao, Y., Guo, Q., Wang, Y., Fang, Y., Ma, X., Zhi, H., Zhou, D., Shen, W. et al. (2019) LncACTdb 2.0: an updated database of experimentally supported ceRNA interactions curated from low- and high-throughput experiments. Nucleic Acids Res, 47, D121-D127.
7* Yuan, H., Yan, M., Zhang, G., Liu, W., Deng, C., Liao, G., Xu, L., Luo, T., Yan, H., Long, Z. et al. (2019) CancerSEA: a cancer single-cell state atlas. Nucleic Acids Res, 47, D900-d908.
8* Hanzelmann, S., Castelo, R. and Guinney, J. (2013) GSVA: gene set variation analysis for microarray and RNA-seq data. BMC bioinformatics, 14, 7.
9* Li, J.H., Liu, S., Zhou, H., Qu, L.H. and Yang, J.H. (2014) starBase v2.0: decoding miRNA-ceRNA, miRNA-ncRNA and protein-RNA interaction networks from large-scale CLIP-Seq data. Nucleic Acids Res, 42, D92-97.
10* Dai, H., Li, L., Zeng, T. and Chen, L. (2019) Cell-specific network constructed by single-cell RNA sequencing data. Nucleic Acids Res, 47, e62.
11* Yanai, I., Benjamin, H., Shmoish, M., Chalifa-Caspi, V., Shklar, M., Ophir, R., Bar-Even, A., Horn-Saban, S., Safran, M., Domany, E. et al. (2005) Genome-wide midrange transcription profiles reveal expression level relationships in human tissue specification. Bioinformatics, 21, 650-659.
12* Wang, P., Ning, S., Zhang, Y., Li, R., Ye, J., Zhao, Z., Zhi, H., Wang, T., Guo, Z. and Li, X. (2015) Identification of lncRNA-associated competing triplets reveals global patterns and prognostic markers for cancer. Nucleic Acids Res, 43, 3478-3489.
13* Guo, Q., Wang, J., Gao, Y., Li, X., Hao, Y., Ning, S. and Wang, P. (2020) Dynamic TF-lncRNA Regulatory Networks Revealed Prognostic Signatures in the Development of Ovarian Cancer. Front Bioeng Biotechnol, 8, 460.
-
Quick start in LncACTdb 3.0
A. Main functions of the database are provided in menu bar form (boxed in green).
B. Use the Quick Search toolbar for quick searches.
C. Click "QUICK SEARCH" button to start a quick search.
D. Click on the scrolling toolbar to use other features of LncACTdb 3.0.
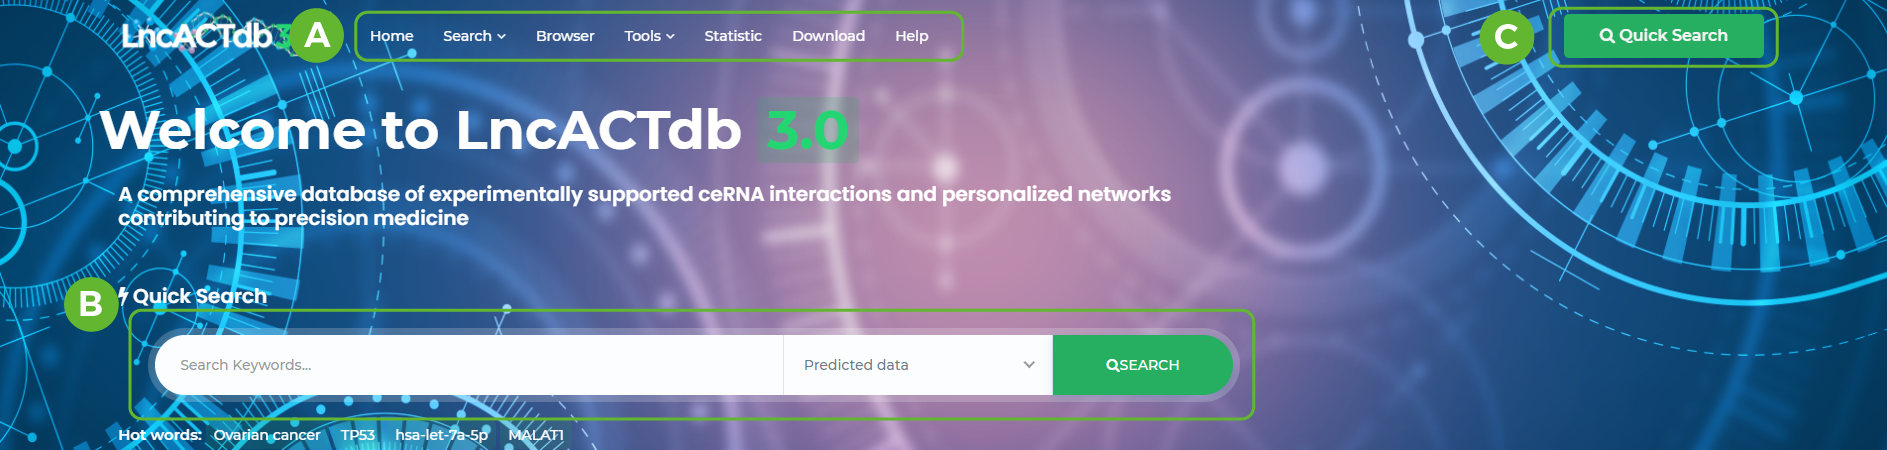
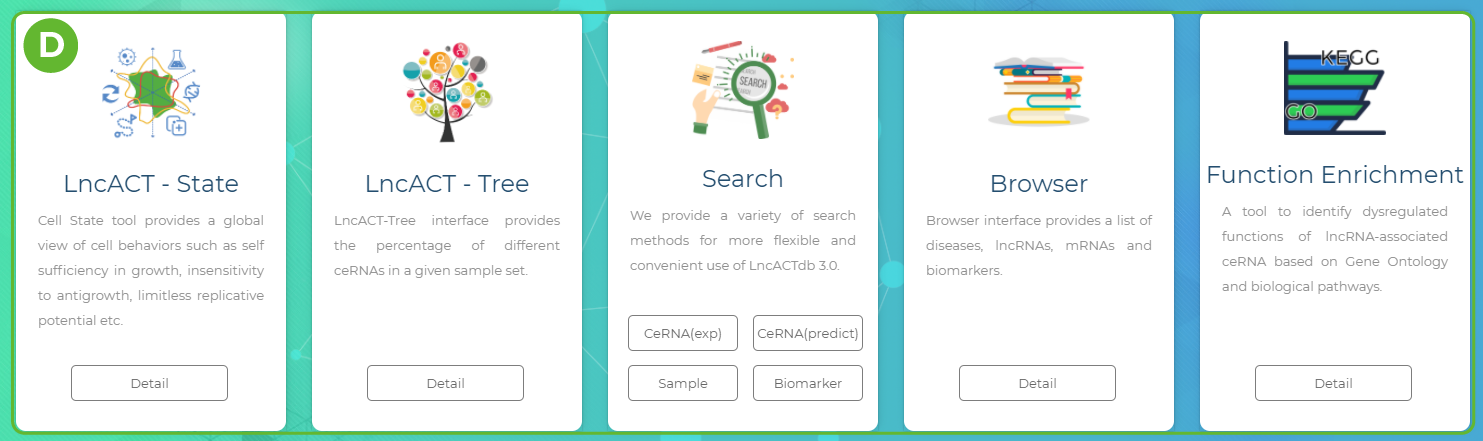
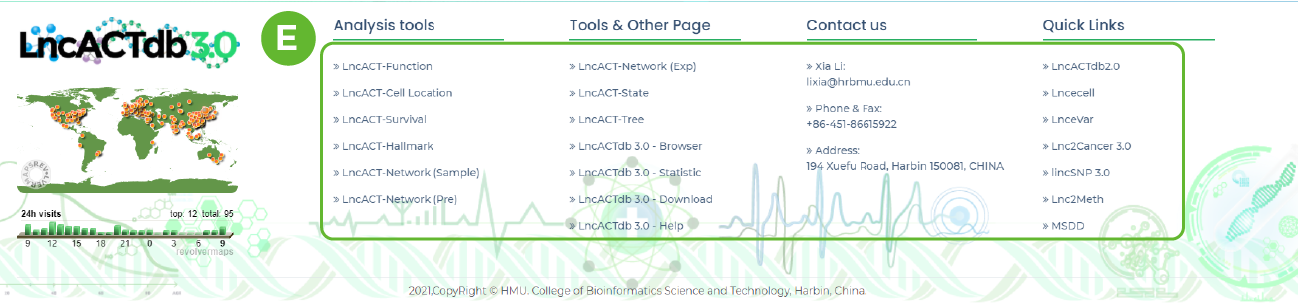
E. Users can quickly access other pages and visit our other online tools by following the links below
Search various datasets in LncACTdb 3.0
-
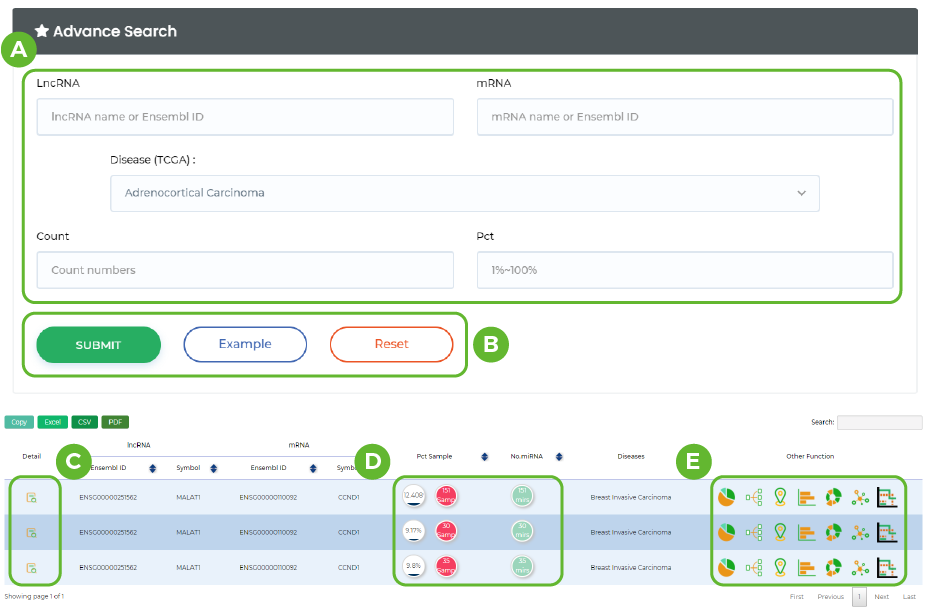
Prediction of patient-specific ceRNAs
A. Input lncRNA ID or name / Input mRNA ID or name / Disease / CeRNA Counts / Pct .
B. Click the button to submit.
C. Click the "Detail" button for more information.
D. The number of miRNAs shared by ceRNA and the number of samples containing the ceRNA.
E. Click on the corresponding icon to go to the corresponding function location.
-
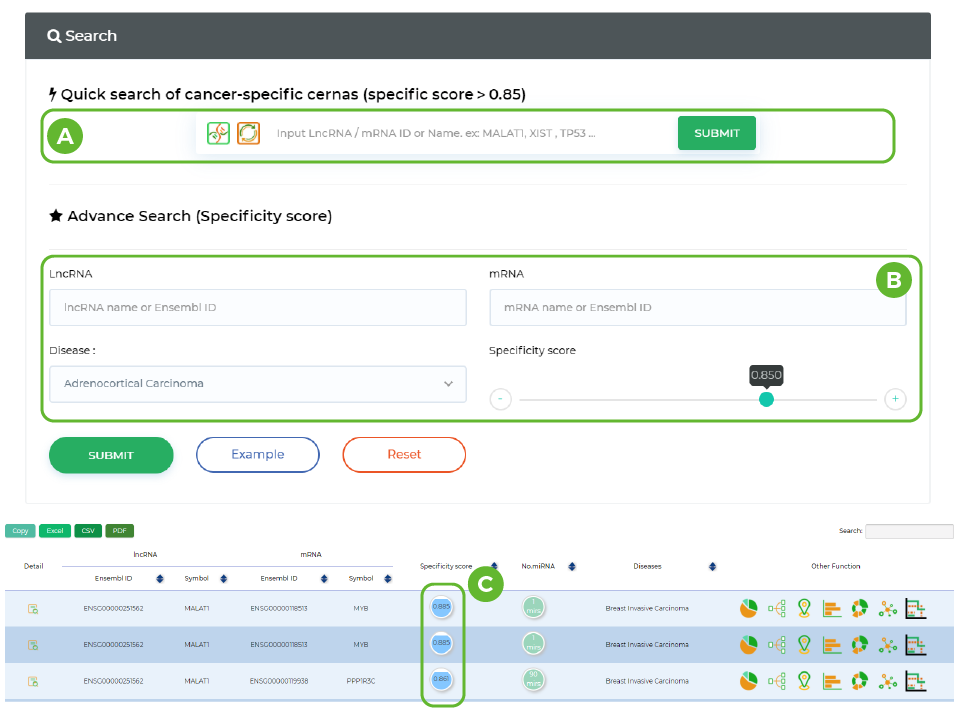
Prediction of Cancer-specific ceRNAs
A. Enter the name/ID of mRNA/LncRNA.
B. Enter ceRNA and disease information and drag the input field below to select the cancer specificity threshold for ceRNA.
C. This column shows the cancer specificity score for the same row of ceRNA.
-
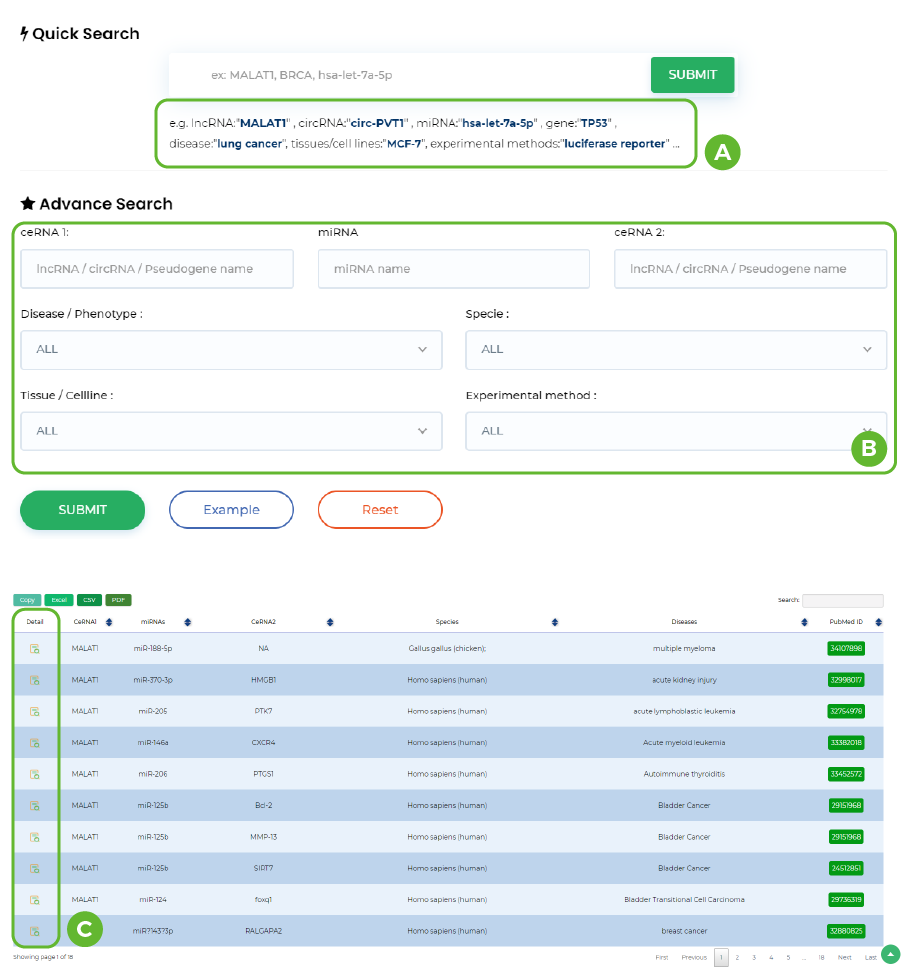
Manual curation of experimental ceRNAs
A. Click on the link below to enter the preset options.
B. Input ceRNA ID or name / miRNA name / Disease / Specie / Tissue/Cell line/ method
C. Click "QUICK SEARCH" button to start a quick search.In addition, the results also include CeRNA and miRNA information, as well as information on the pubmed ID of the involved literature, sample race, etc.
-
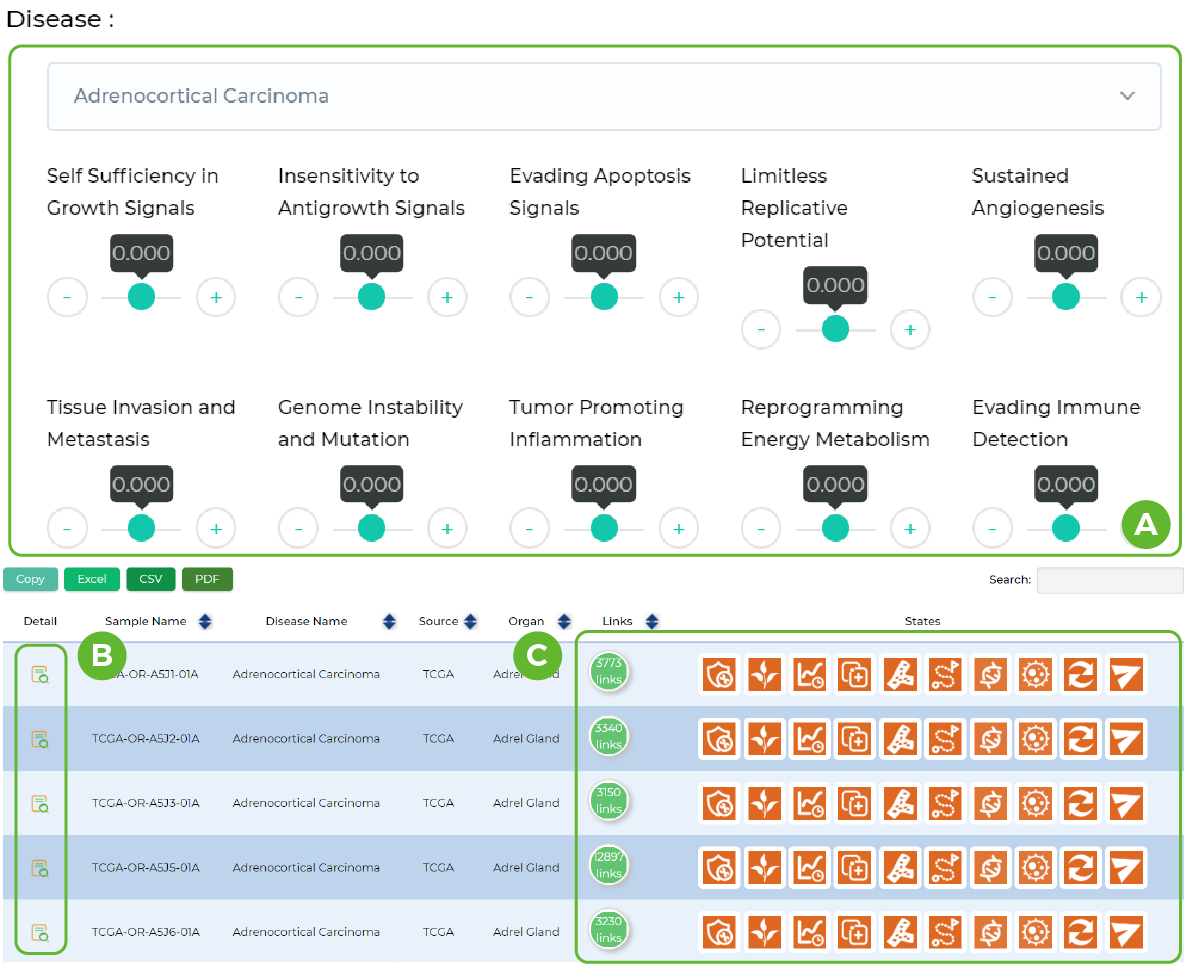
Patients with specific ceRNA networks
A. Select the data set and set the signal pathway score.
B. View sample details.
C. Total number of ceRNAs possessed by the sample and the pathway score.
-
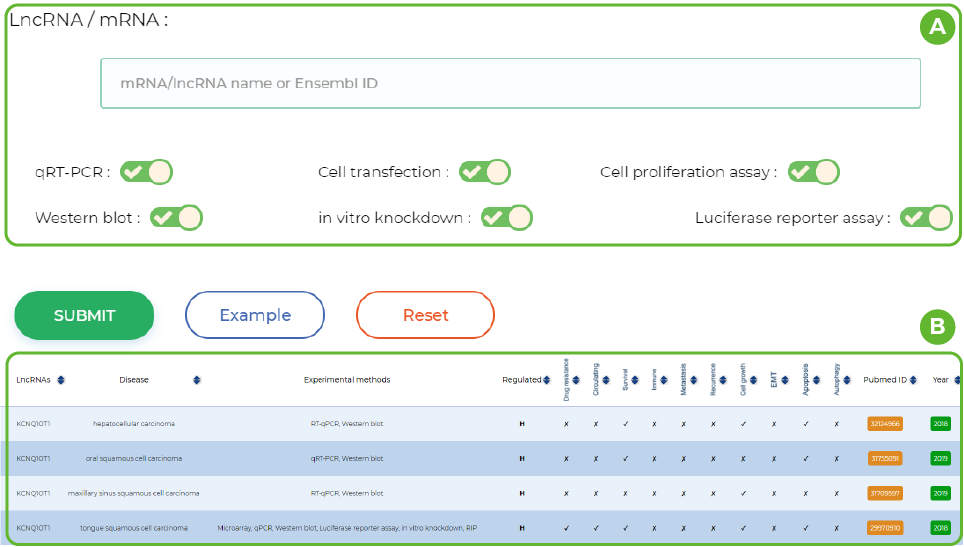
Diagnostic and therapeutic biomarkers
A. Enter the lncRNA ID or name and select the experiment method.
B. Details of lncRNA in different articles.This includes information on the lncRNA Sybmol, disease name, experimental method, direction of regulation (upregulation/downregulation), and the biomarkers involved in it.
Browse various datasets in LncACTdb 3.0.
-
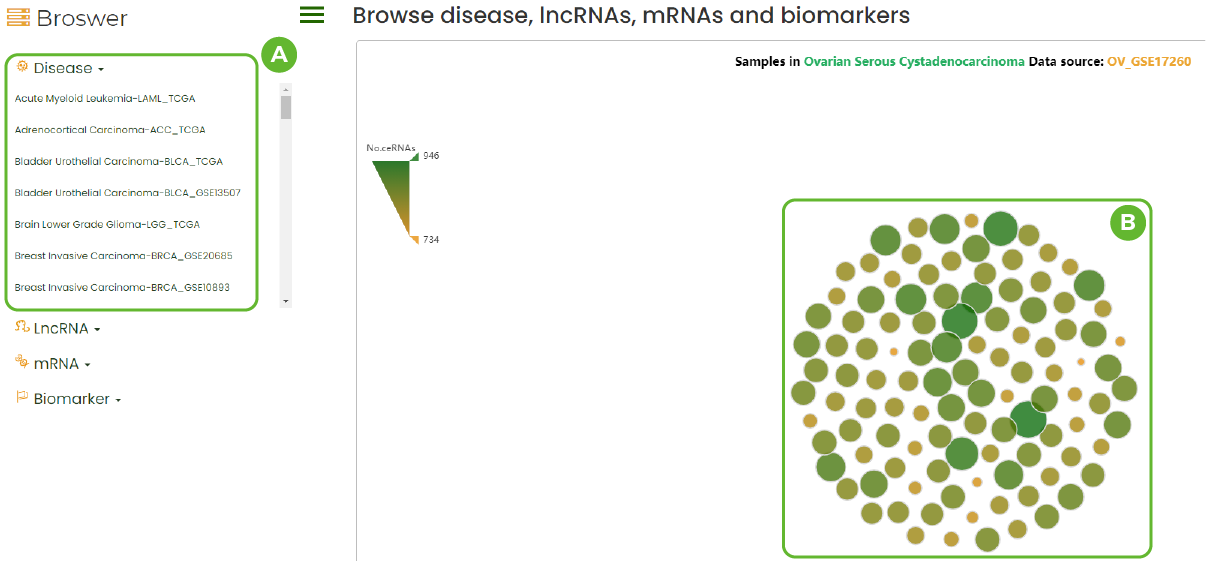
Dataset Browser
A. All disease datasets included in LncACTdb 3.0.
B. The ceRNA network diagram in this dataset.
-
RNA Browser
A. All lncRNAs / mRNAs contained in LncACTdb3.0.
B. Distribution of tissues in which this RNA appears
-
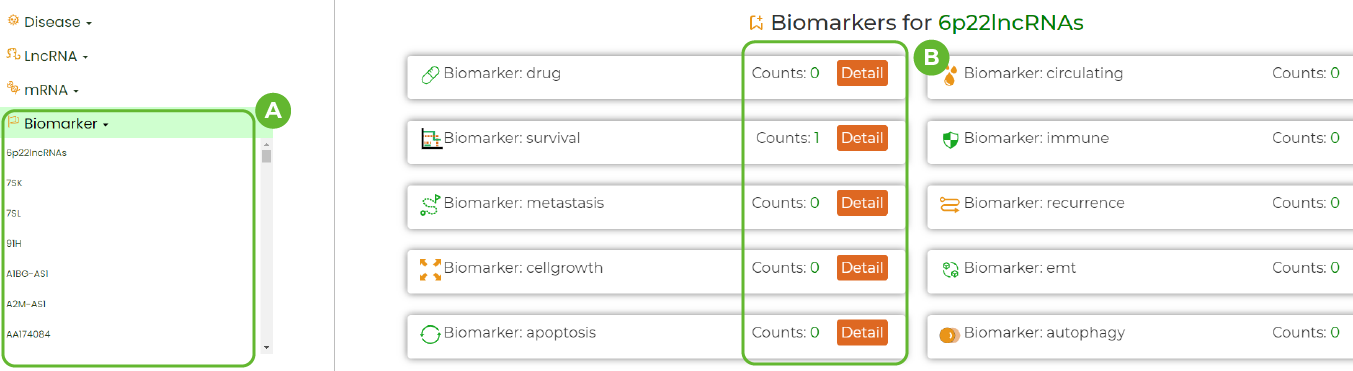
Biomarker Browse
A. All biomarker information contained in LncACTdb3.0.
B. Details of this biomarker.
Tools
-
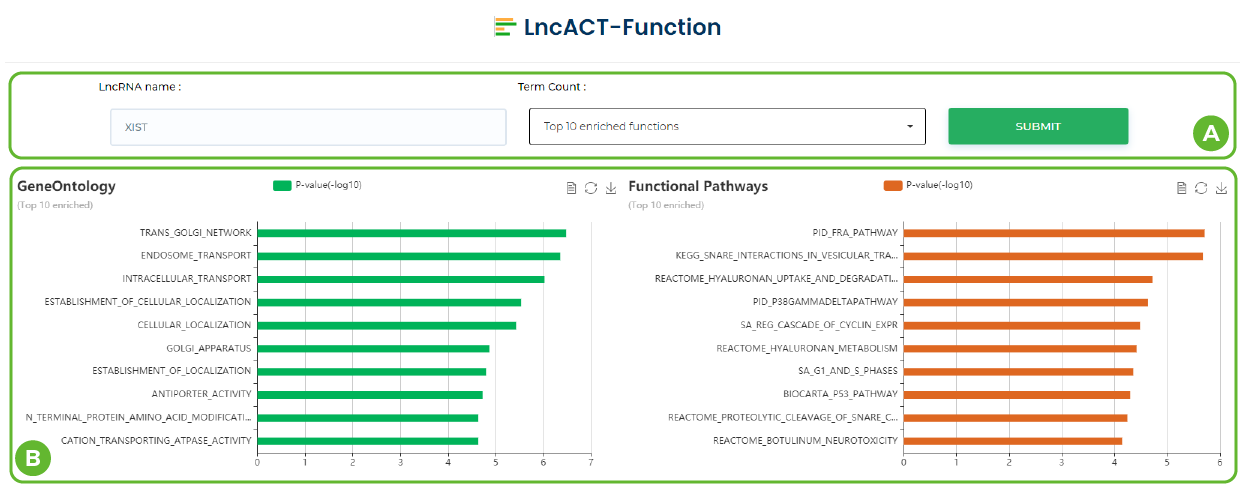
Functional annotation in LncACTdb 3.0.
A. Click and select 5/10/20/30 top enriched functions.
B. The enriched pathways of hit downstream genes. / The enriched GO terms of hit downstream genes.
-
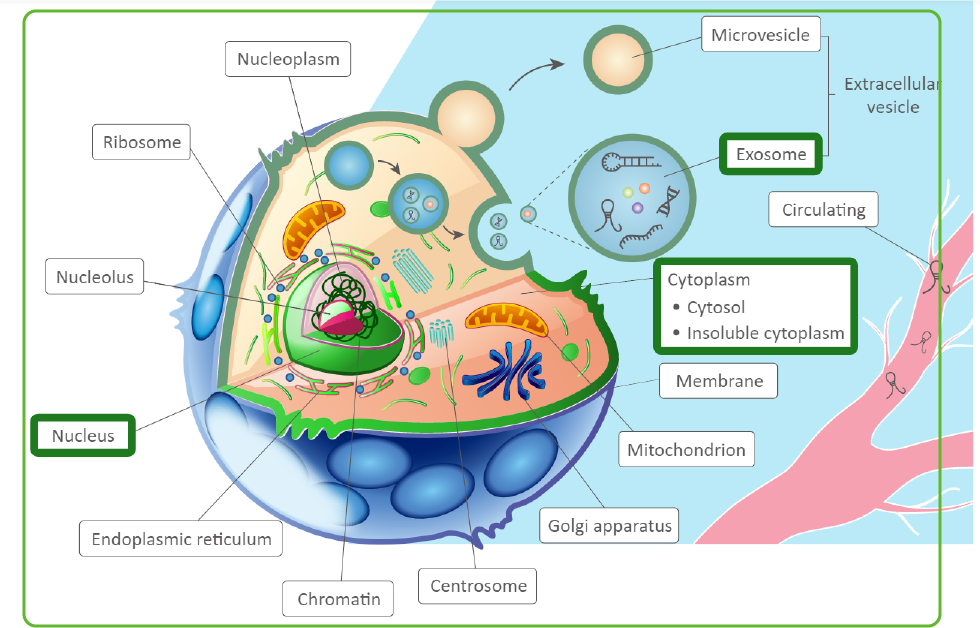
Cell location in LncACTdb 3.0.
Find out the sub-cellular locations for a ceRNA.(Example for ceRNA)
This section shows the specific organelles located.
-
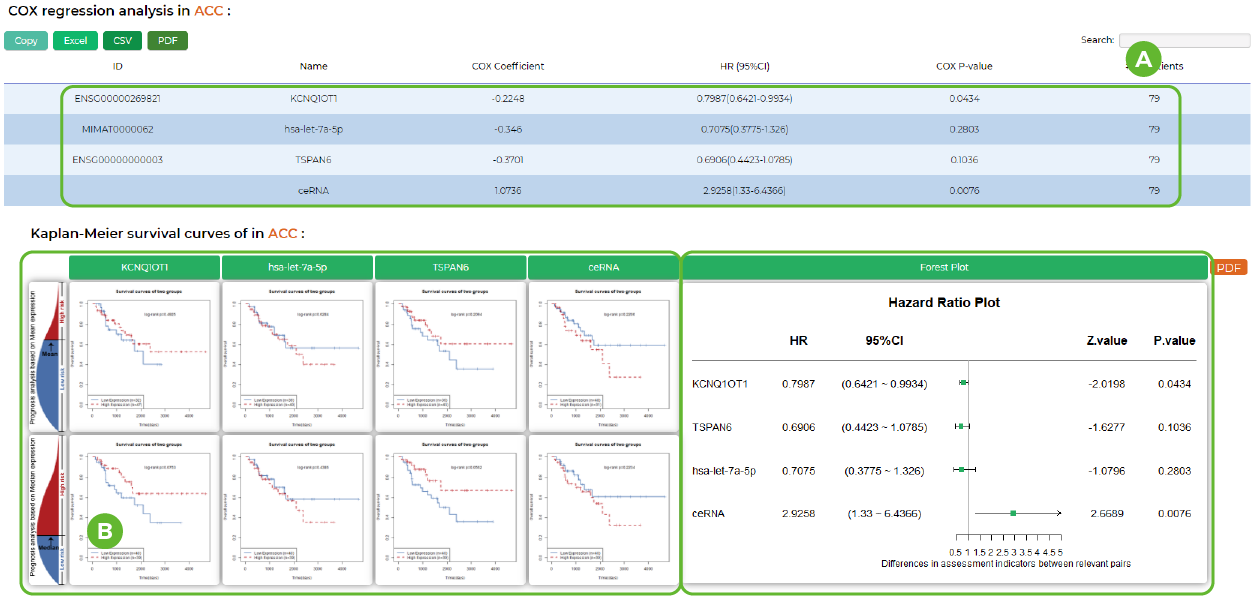
Survival analysis in LncACTdb 3.0.
A. The COX regression analysis result of the hit completing triplet.
B. Survival curves based on mean/median expression and forest plot.
-
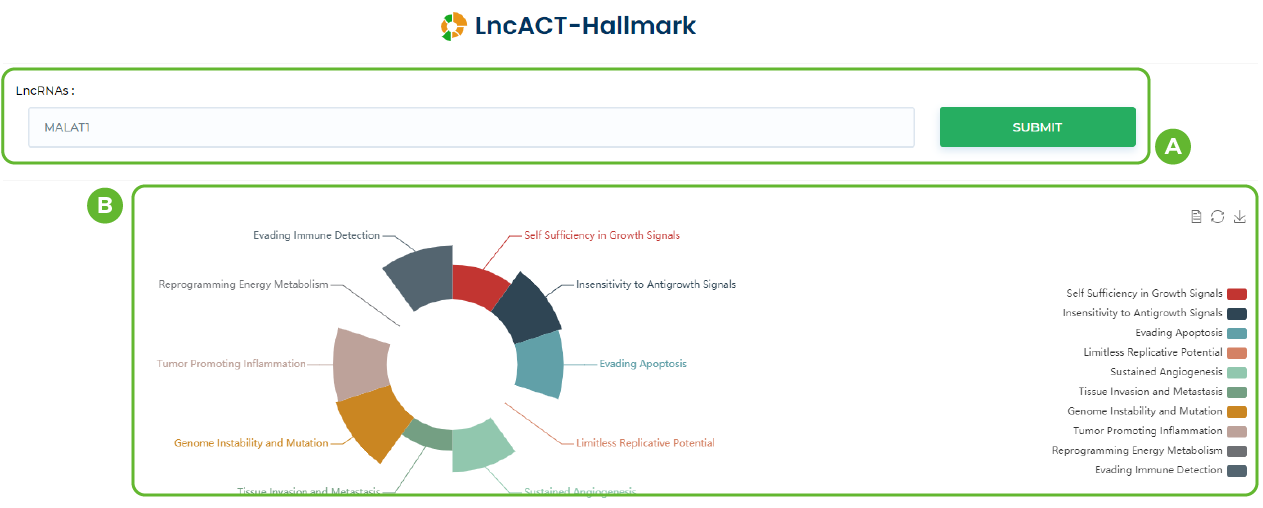
Hallmark annotation in LncACTdb 3.0.
A. Input lncRNA ID or name
B. Dysregulated hallmarks of ceRNA event.
-
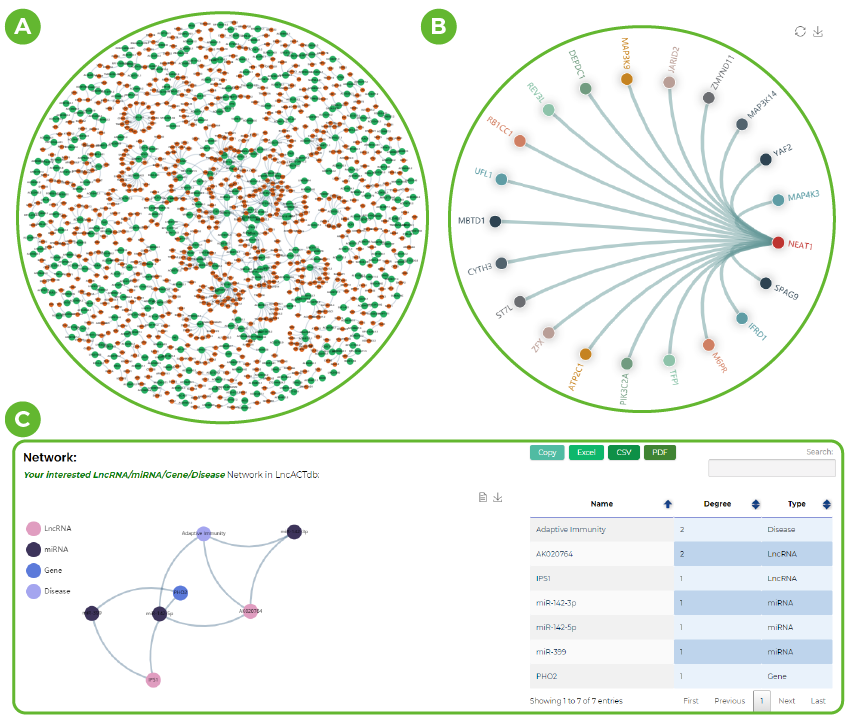
Network visualization in LncACTdb 3.0.
A. CeRNA networks in different samples.
B. The hit lncRNA-cenrtic ceRNA network.
C. Experimental confirmation of the ceRNA network obtained from the data.
-
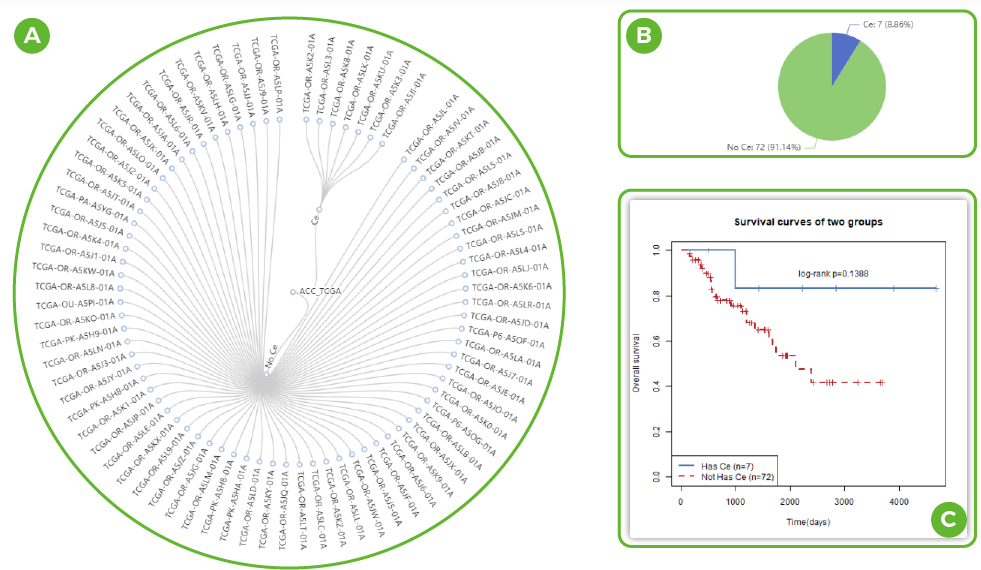
Tree visualization in LncACTdb 3.0.
A. Information about all samples in the dataset. (Click on the sample name for more information)
B. Pie chart of ceRNA content.
C. KM curves of the prognostic effect of ceRNA on samples.
-
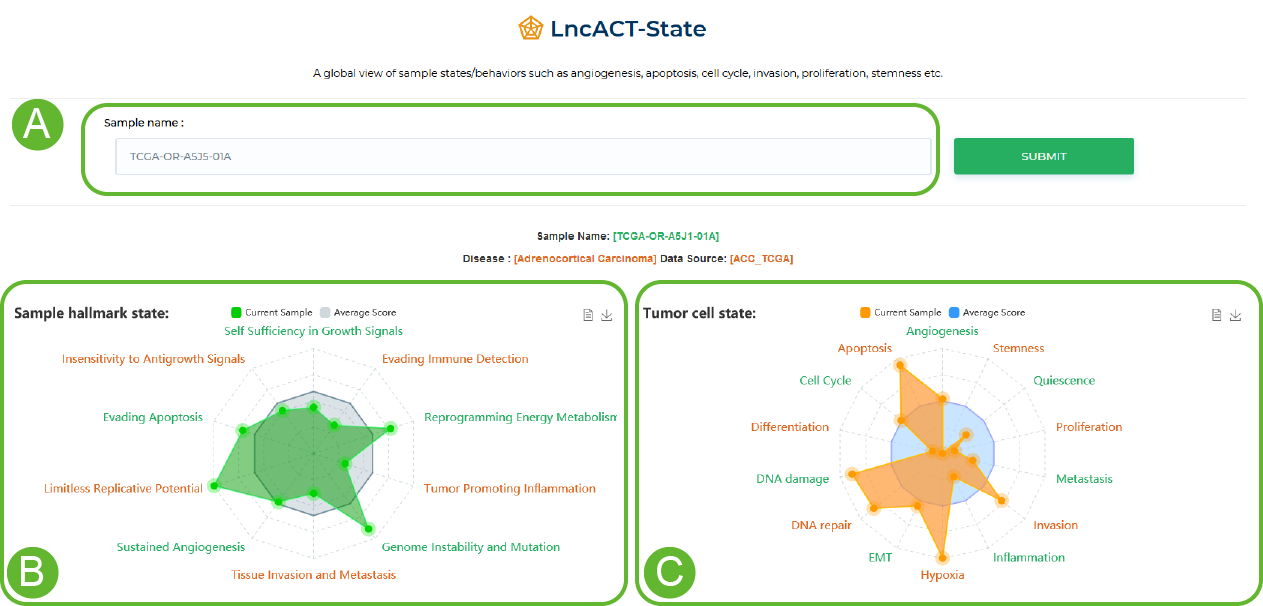
State visualization in LncACTdb 3.0.
A global view of sample states/behaviors such as angiogenesis, apoptosis, cell cycle, invasion, proliferation, stemness etc.
A. Enter the sample ID
B. 10 sample state scores
C. Tumor cell score
-
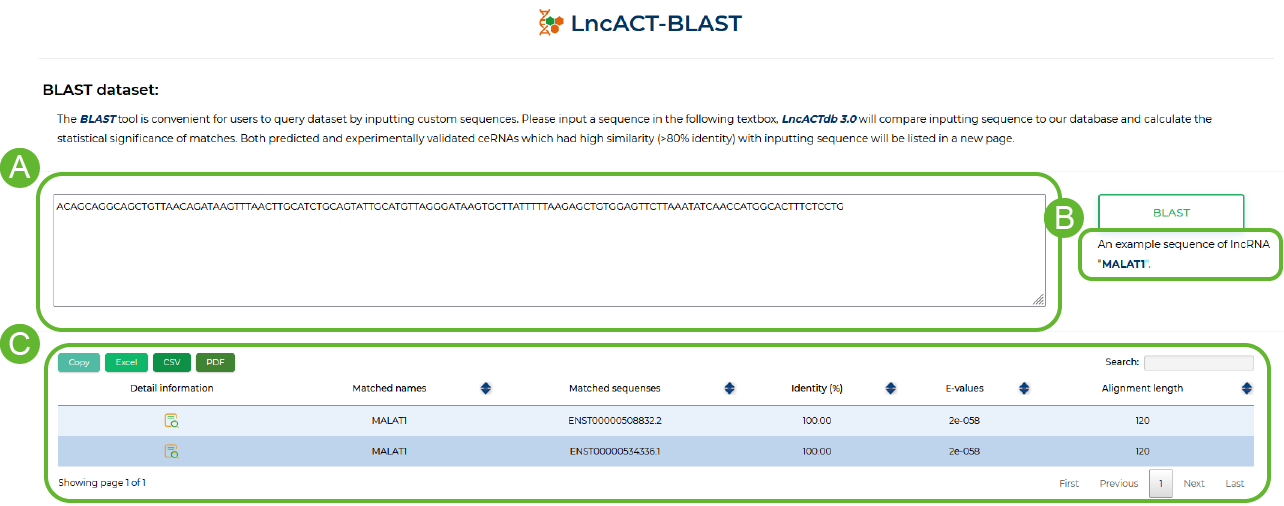
Blast tool in LncACTdb 3.0.
LncACTdb 3.0 provides BLAST function to allow users to query genes of interest based on sequence
A. Enter the sequence to be blast
B. Preset Sequence
C. BLAST comparison results
Statistic
-
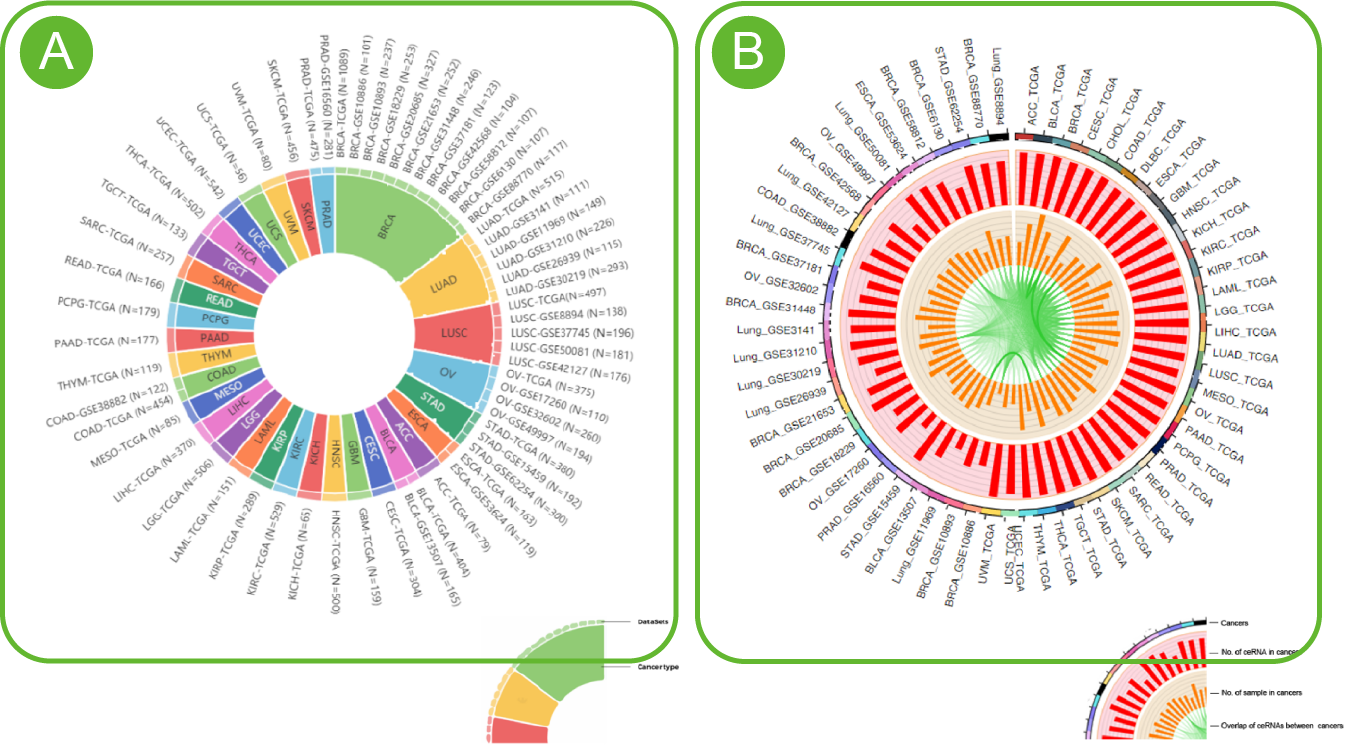
Pan-cancer Statistics of LncACTdb 3.0
A. Statistics on the number of all data sets and disease types in LncACTdb 3.0 .
B. Similarity statistics between data parameters and data in LncACTdb3.0.
-
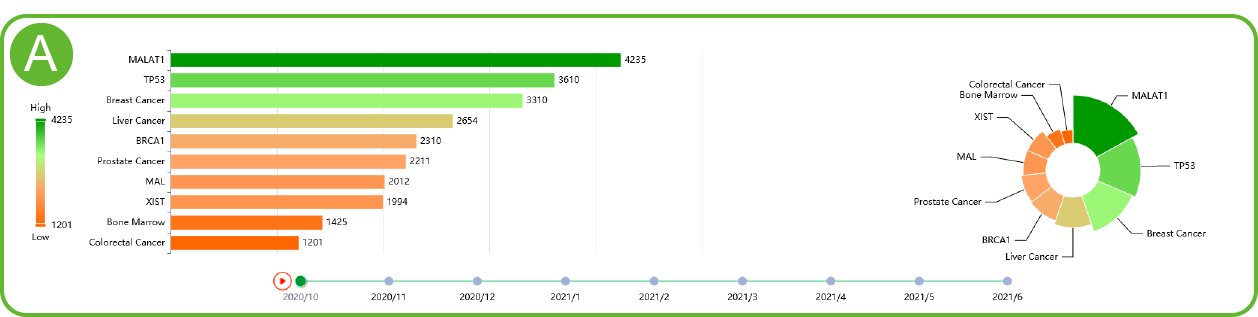
Hotpoints of LncACTdb 3.0
A. LncACTdb 3.0 and hot words from previous work. (Changes over time) .
-
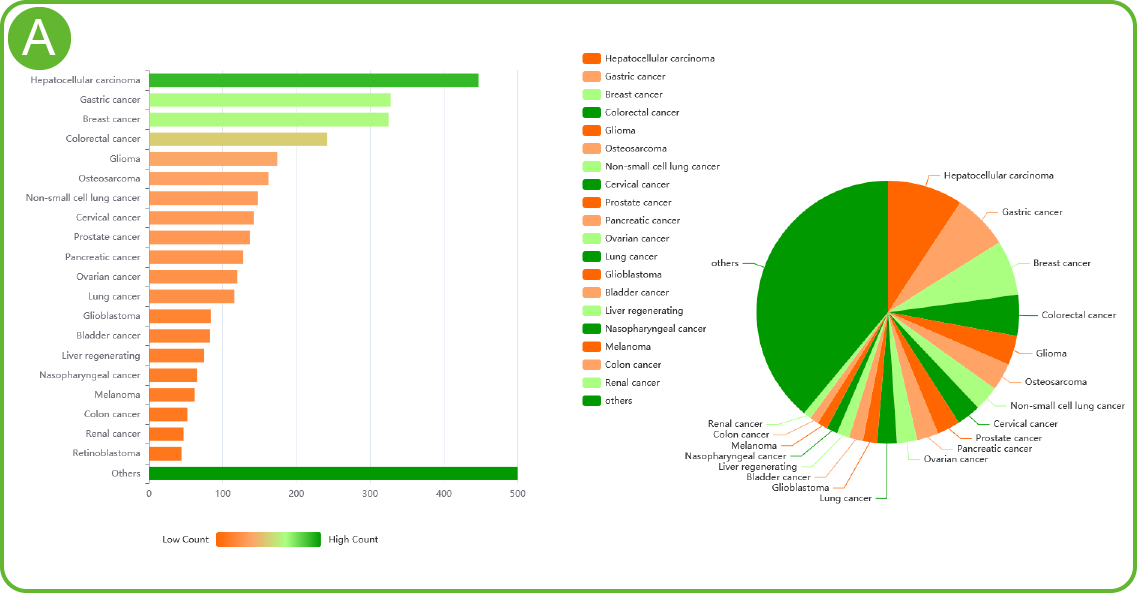
LncACTdb 3.0 disease type and data quantity statistics
A. LncACTdb3.0 disease type and data quantity statistics (left: bar chart; right: pie chart) .
-
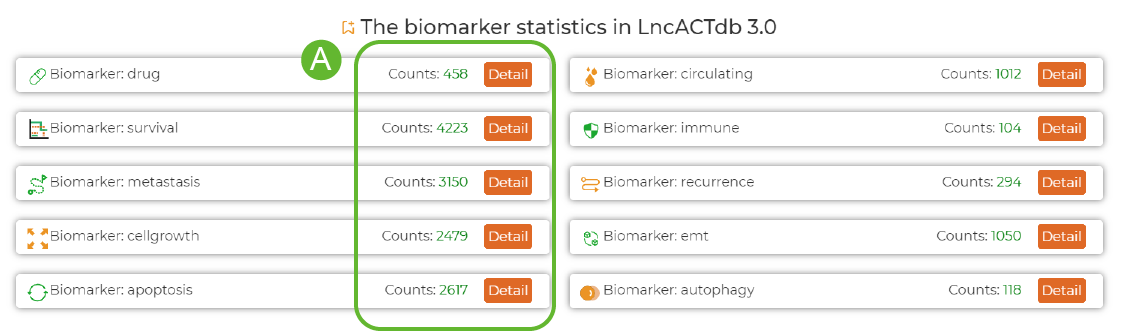
Biomarkers Statistics of LncACTdb 3.0
A. Click the Detail button for more information .
-
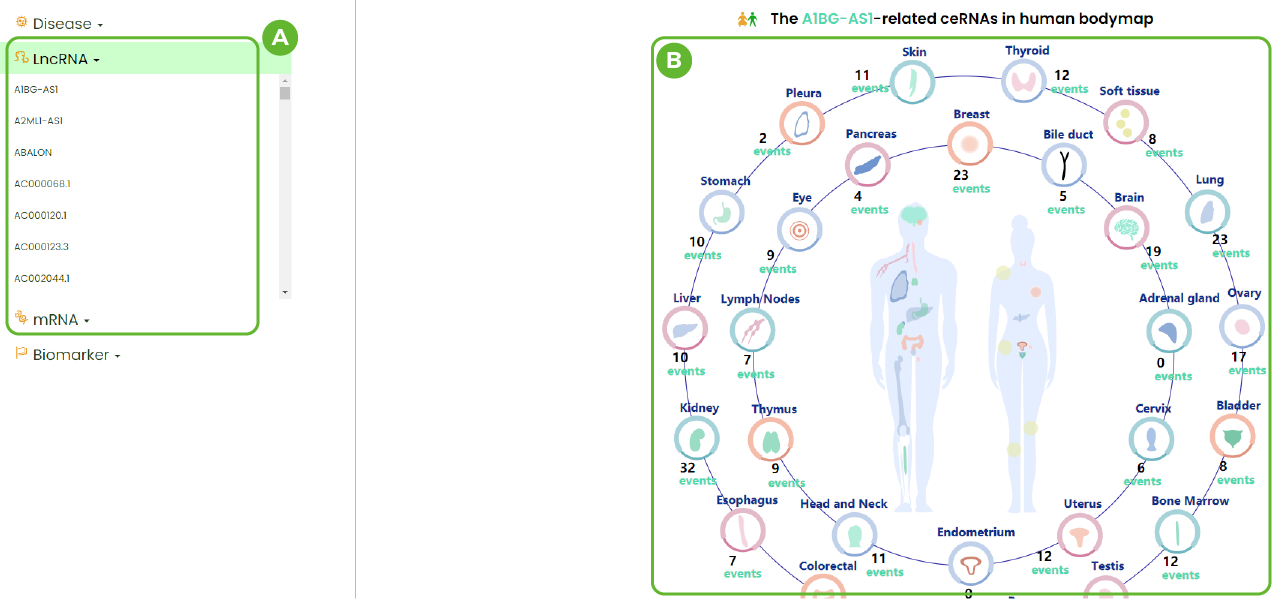
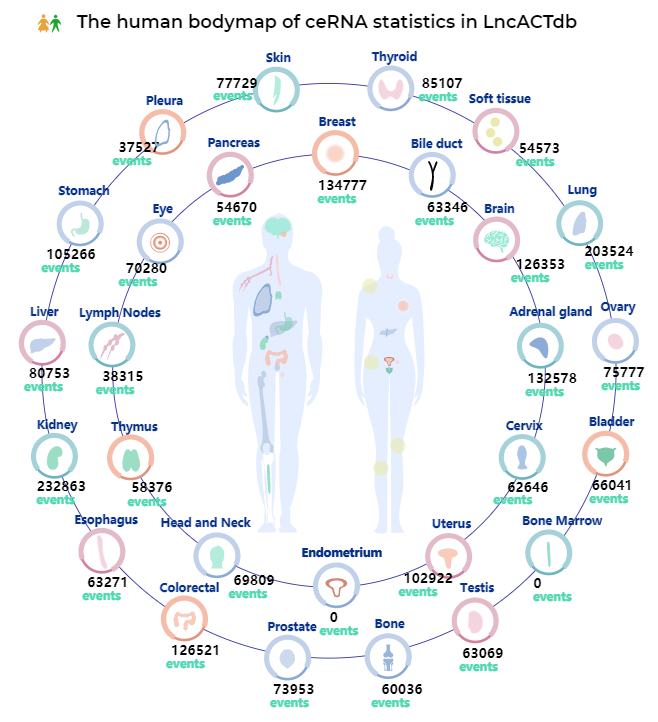
Bodymap of LncACTdb 3.0
The graph shows the total number of ceRNAs distributed in different tissues/organ.
Download
-
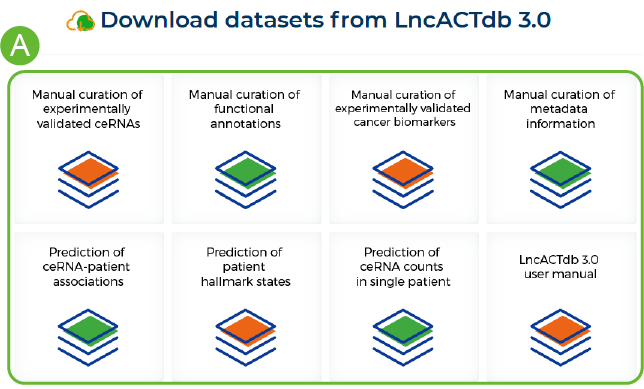
How to download data from LncACTdb 3.0
A. Click on the file name to get the corresponding file .
Submit & Contact
-
Submit your data
A. Upload your files .
B. Click the submit button.

-
Submit your question
A. Please describe your problem in detail .
B. Our contact information and address.
Tutorials