Help
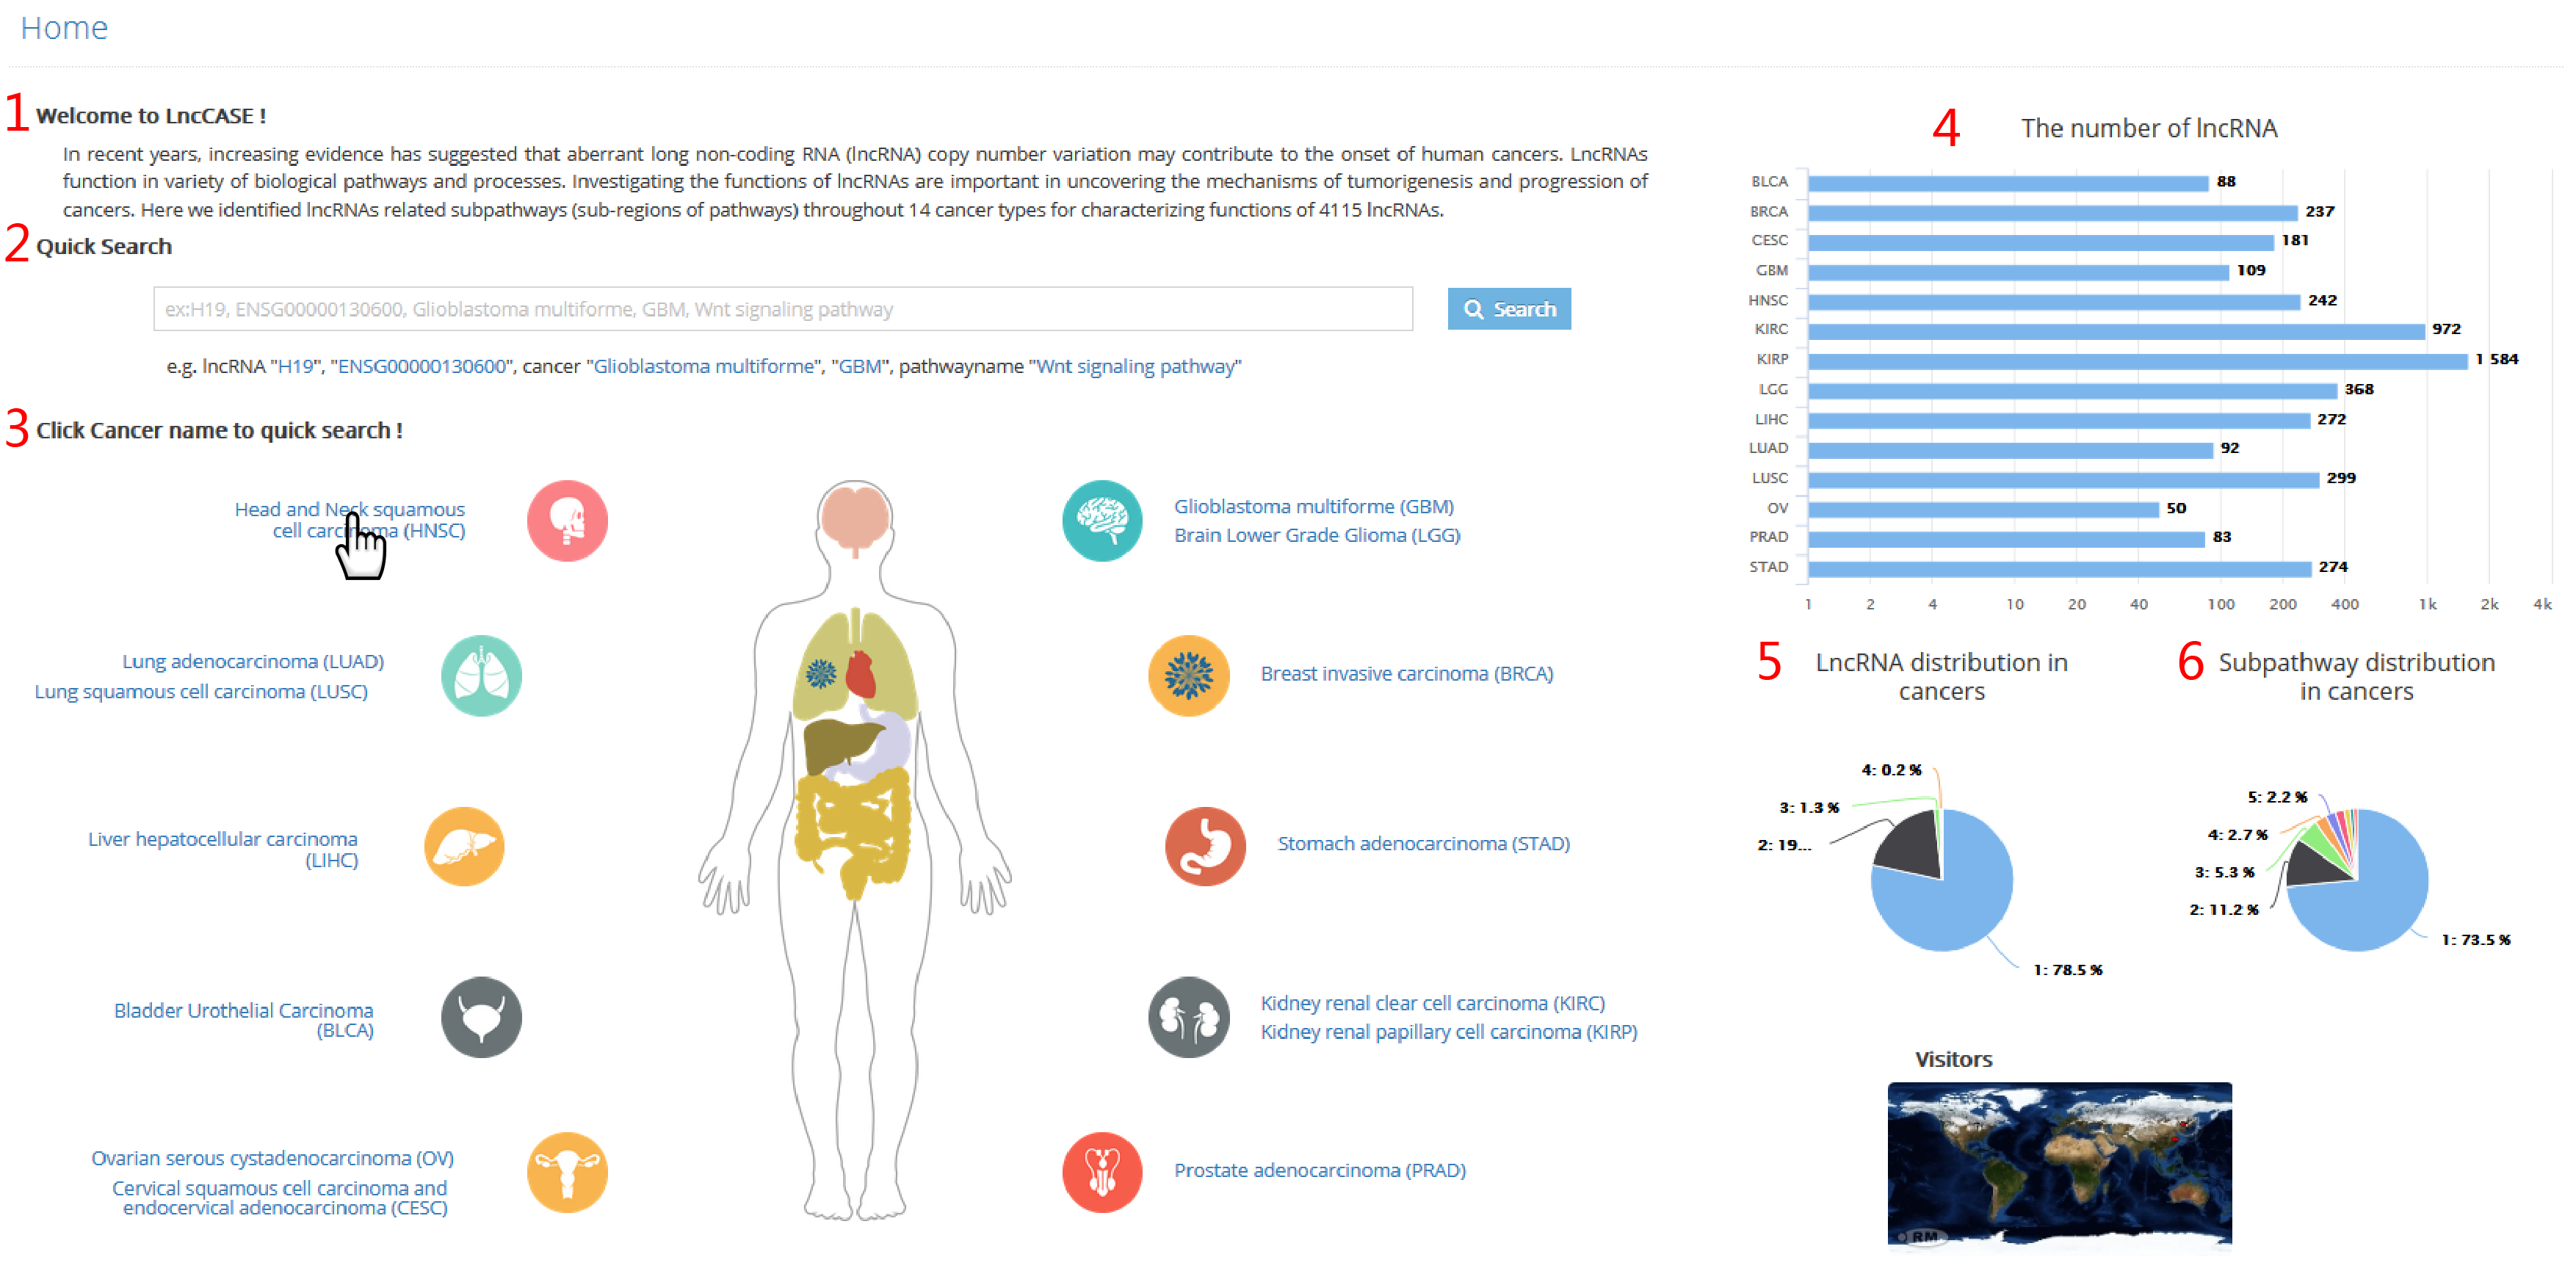
1. The introduction of LncCASE.
2. A quick search for filtering entries. Users can input lncRNA, cancer type, or pathway name of interest.
3. A global view of human organ maps to quickly explore lncRNA-related subpathways in corresponding cancer types.
4. The number of lncRNAs identified in 14 cancer types.
5. LncRNA distribution in cancers. (eg. "1:78.5%" represents that 78.5% lncRNAs were identified in 1 cancer type.)
6. Subpathway distribution in cancers. (eg. "1:73.5%" represents that 73.5% subpathways were identified in 1 cancer type.)
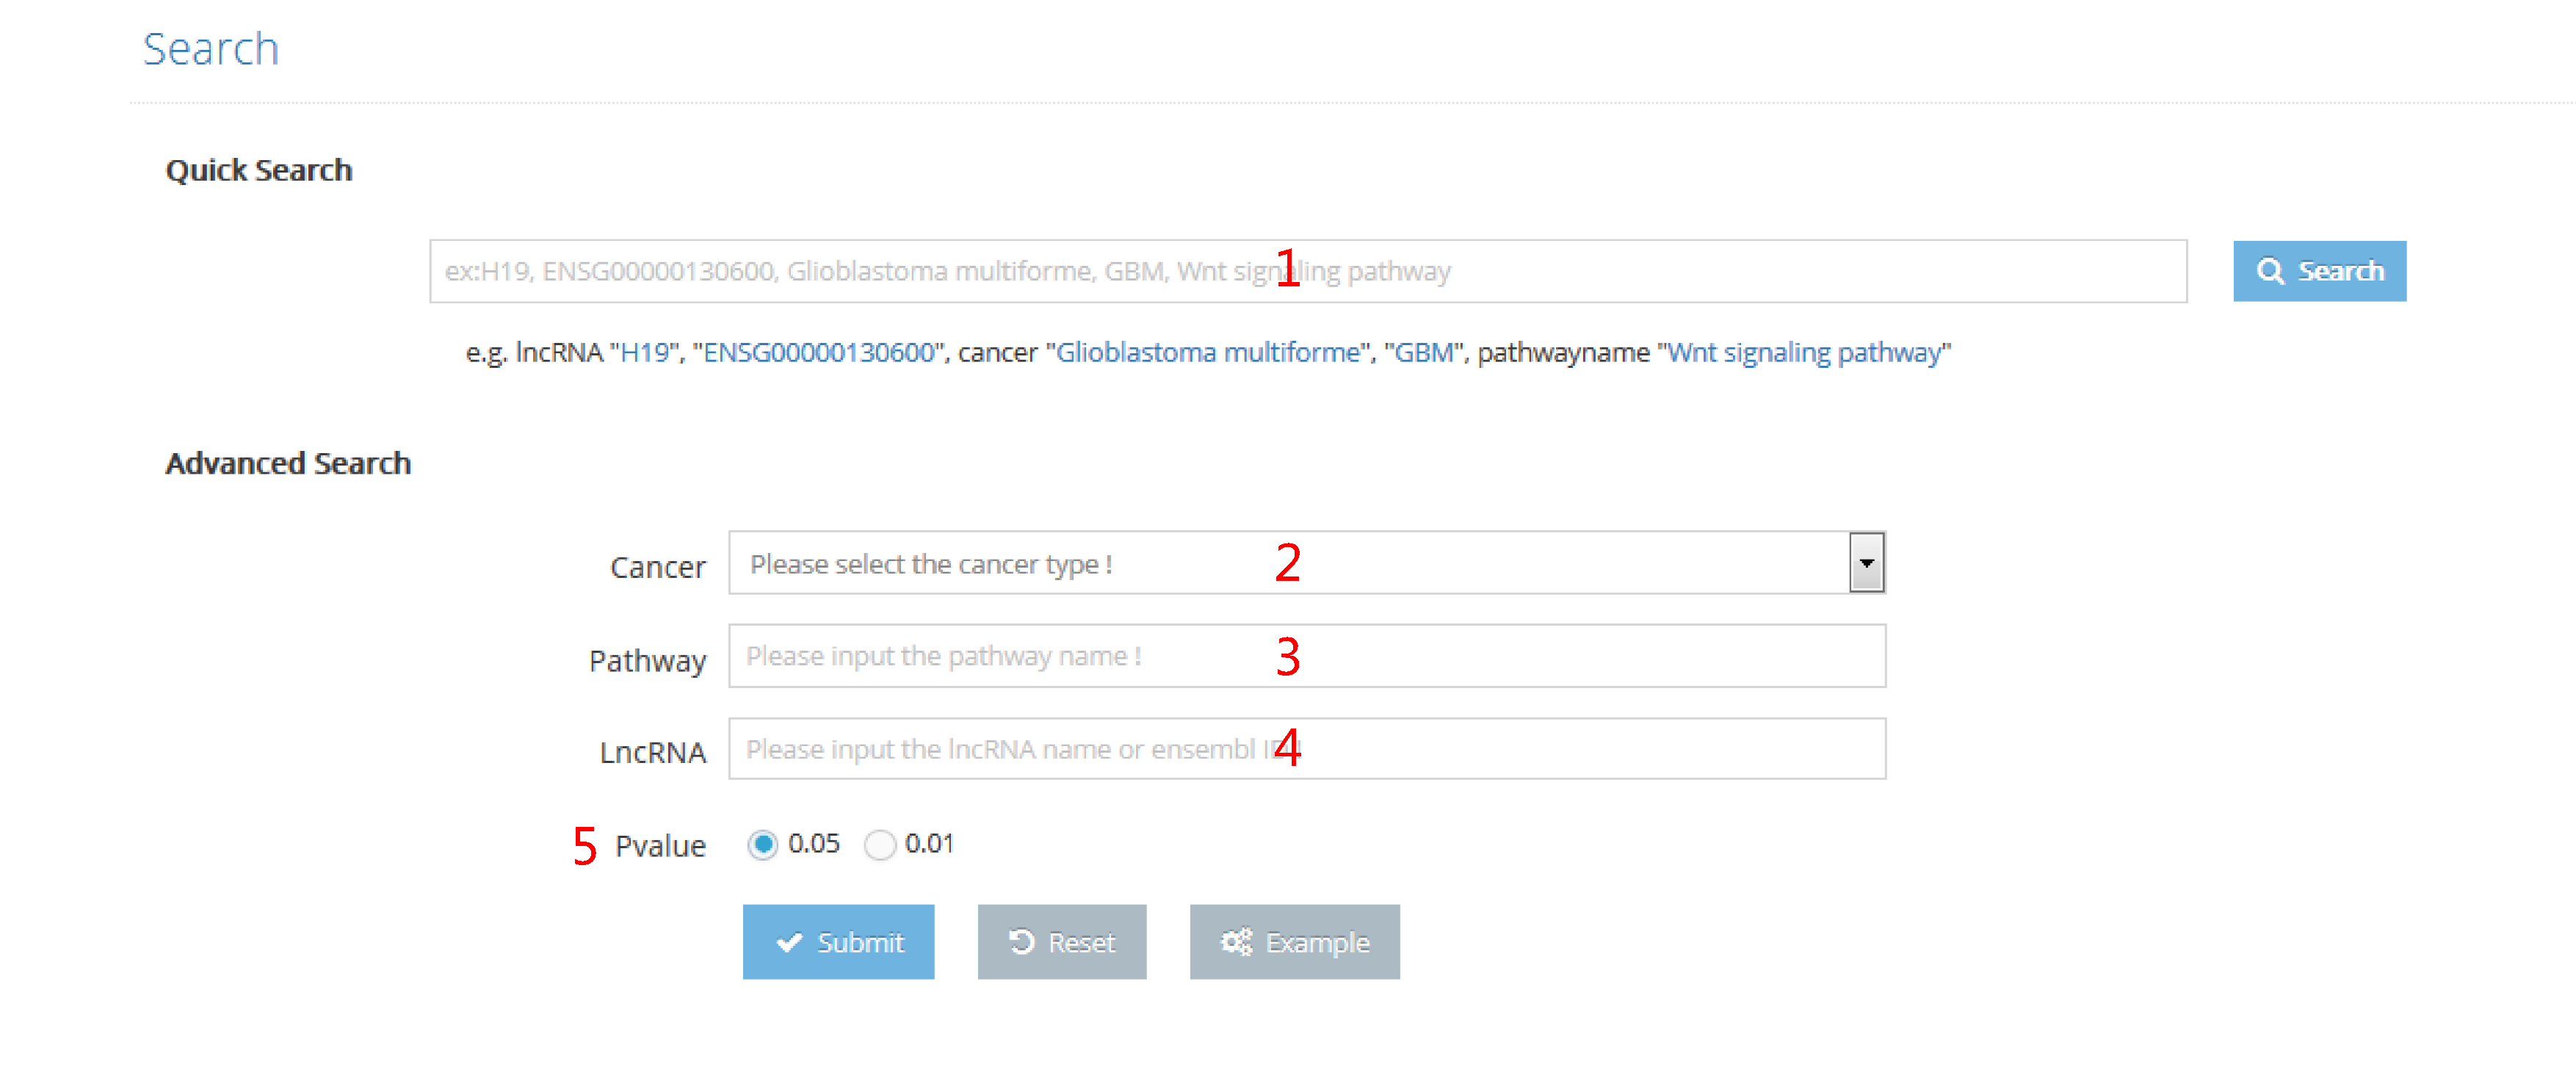
LncCASE provide both quick search and advanced search.
The quick search is convenient for users who focus on one of following issues, lncRNA, cancer type and pathway.
The advanced search enable users to input multiple keywords at the same time.
1. Input lncRNA name, lncRNA ensemble ID, cancer full name, cancer name abbreviation or pathway name to start the search.
2. Select cancer type to start the research.
3. Input pathway name to start the research.
4. Input lncRNA name or lncRNA ensemble ID to start the research.
5. Select threshold of P value to filter subpathways.
Hierarchical classifications of lncRNAs and pathway are presented in the browse page. The matching records will show by clicking name of interest.
1. LncRNA names are ranked by their initial letters. By clicking on lncRNA name, records that contain this lncRNA will be returned.
2. Subpathways are ranked by their original pathways. By clicking on subpathway ID, records that contain this subpathway will be returned.
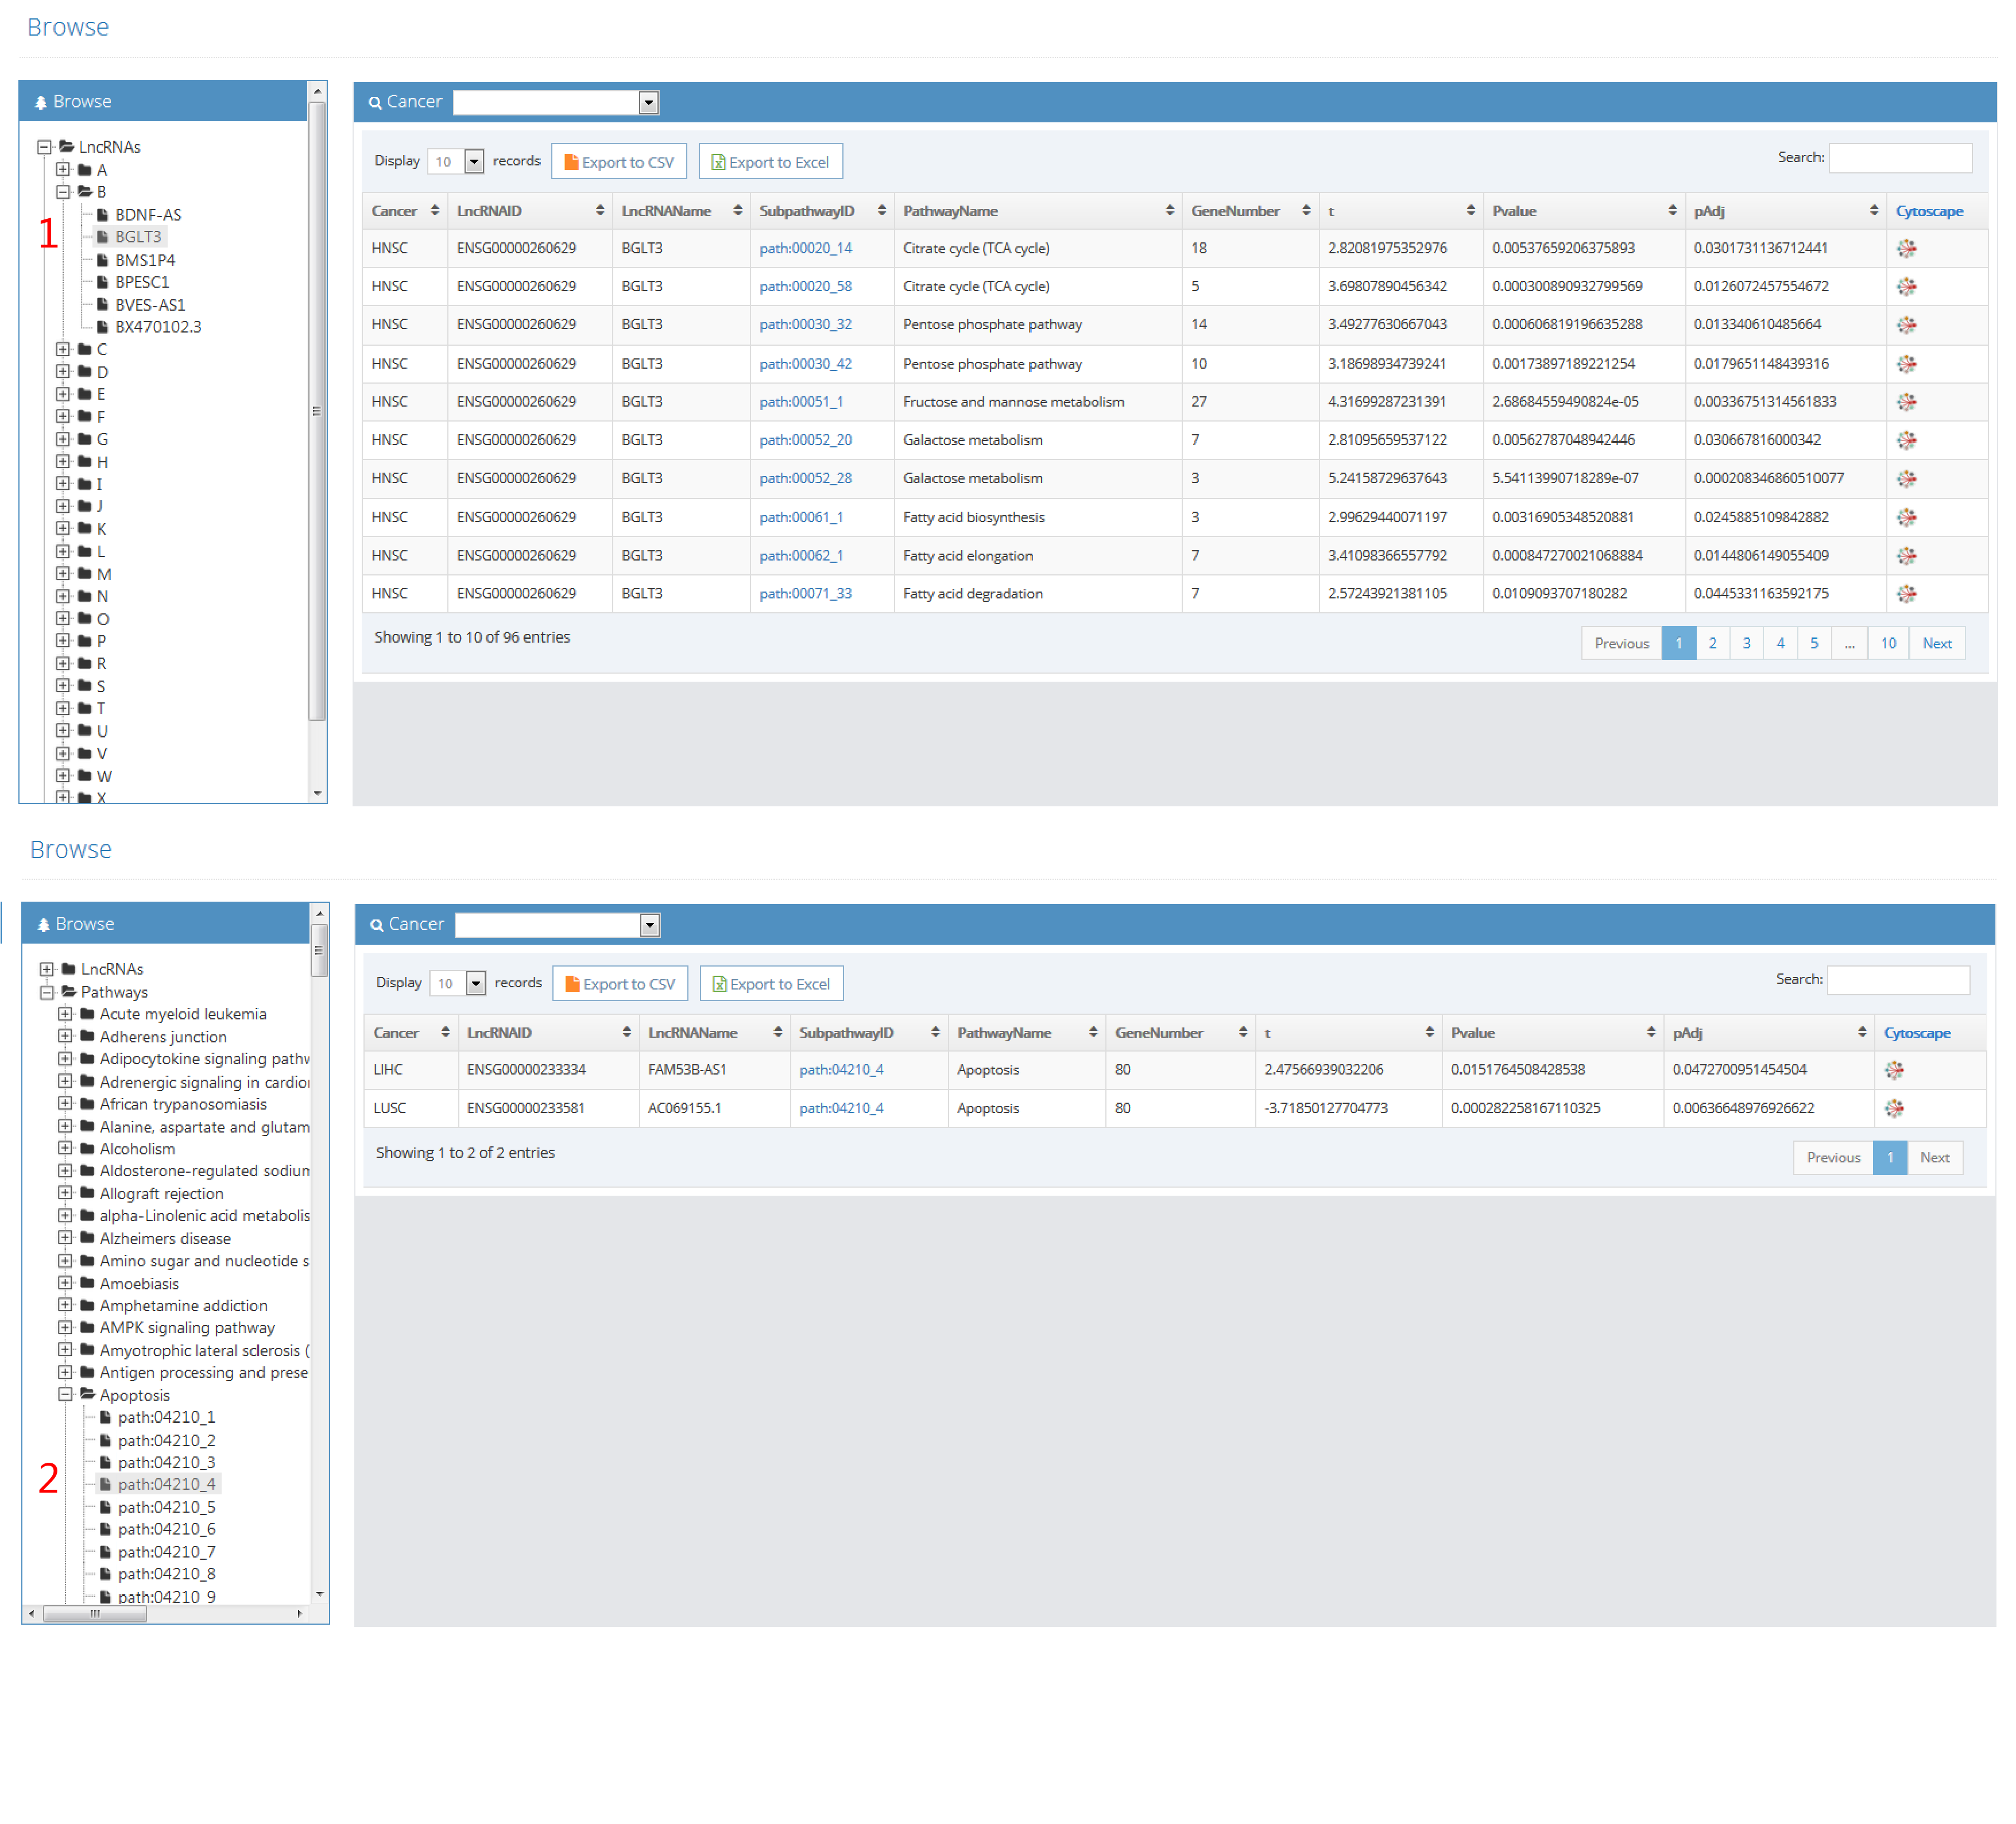
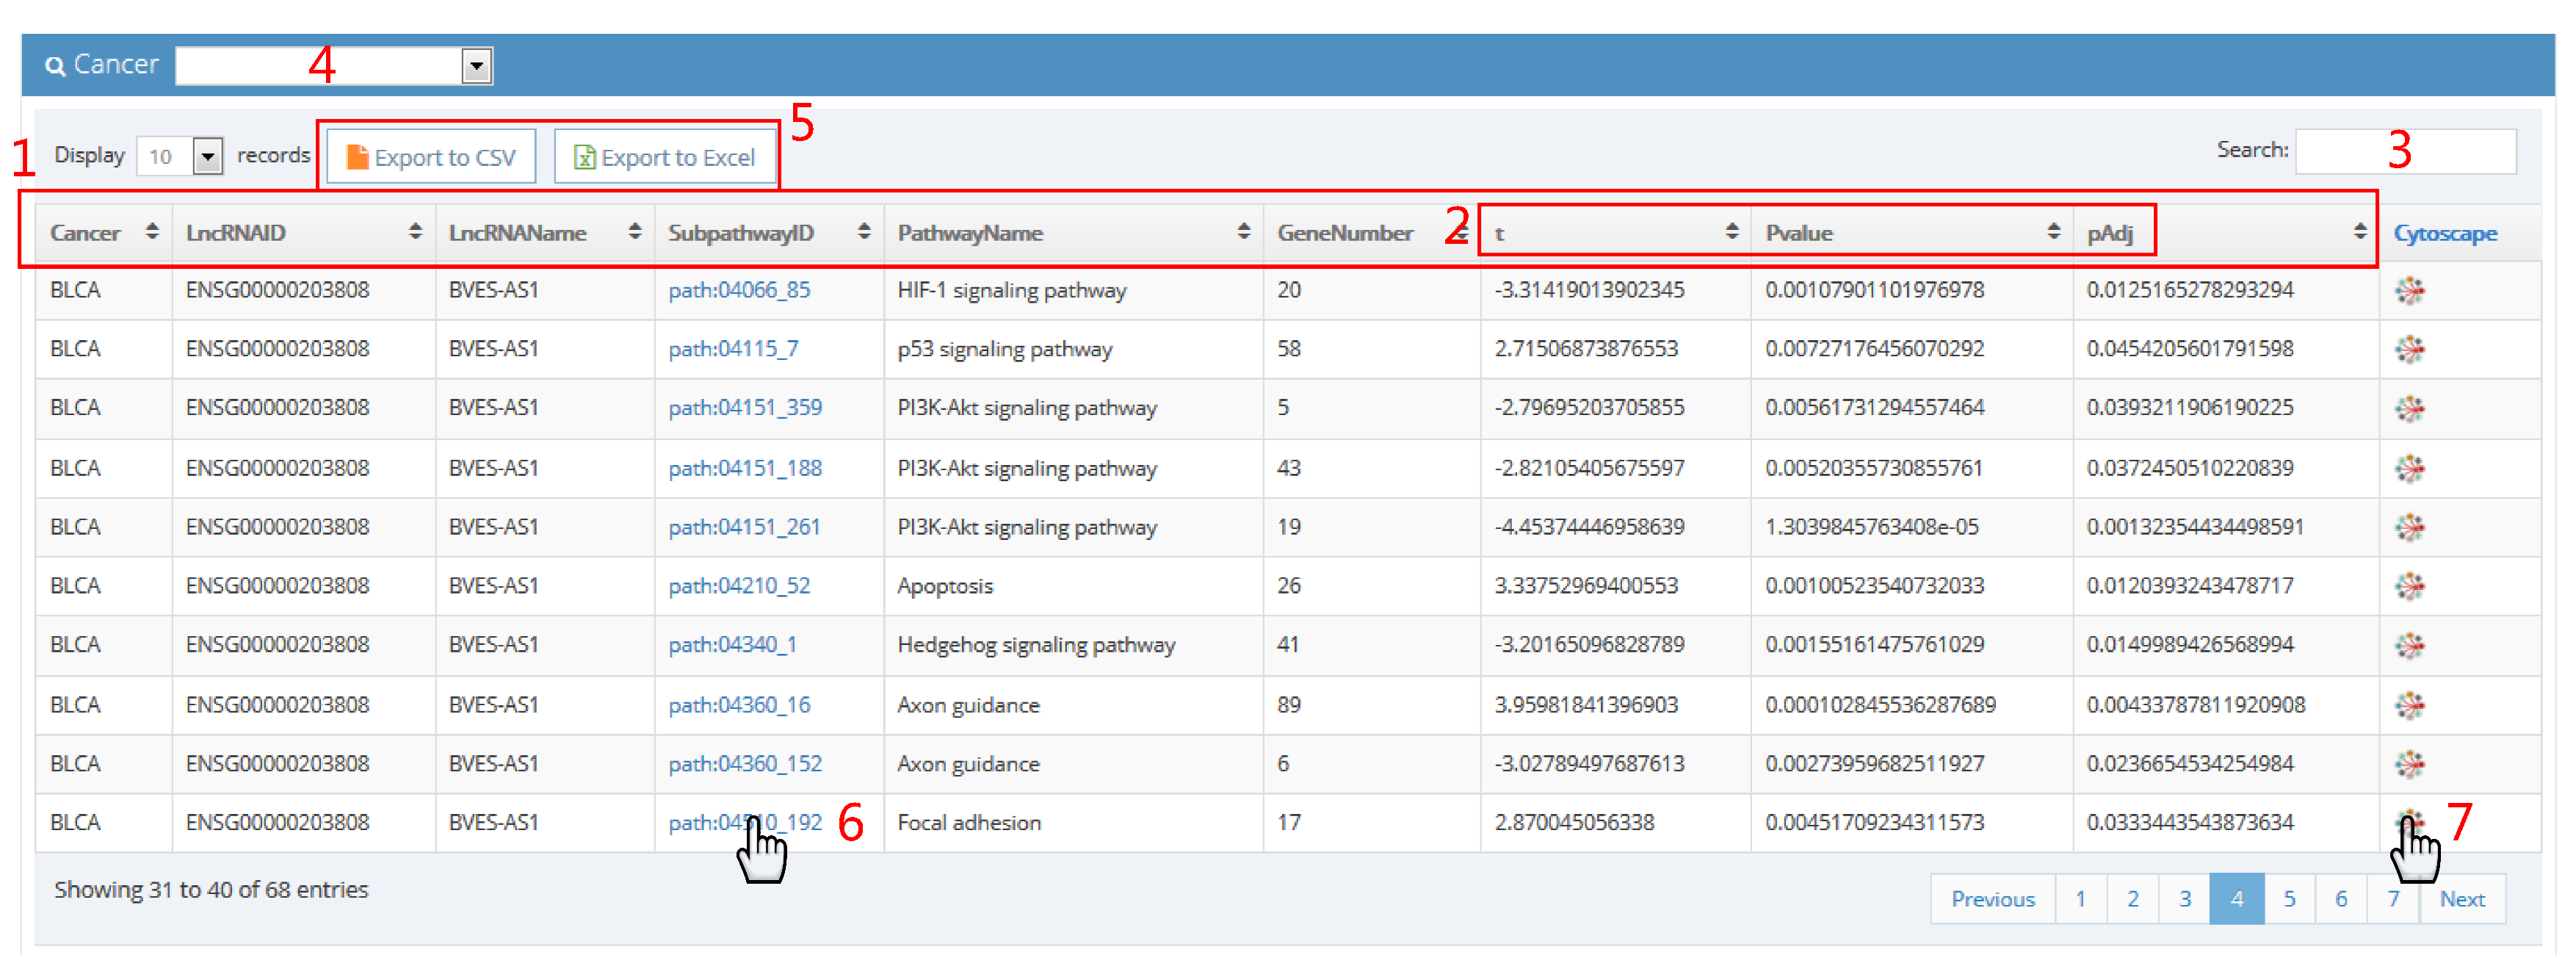
1. The column headers are:
Cancer (abbreviation of cancer name)
LncRNAID (ensembl ID of lncRNA)
LncRNAName (name of lncRNA)
SubpathwayID (ID of subpathway)
PathwayName (name of pathway)
GeneNumber (the number of genes included in subpathway)
t (t statistic)
Pvalue (P value)
pAdj (adjusted p value)
2. T-test was performed to assess difference of subpathway activities between patients with lncRNA copy number alteration and patients with lncRNA wild type. "t" represents t statistic of t test. "Pvalue" represents P value of t test. "pAdj" represents adjusted p value of t test using method of Benjamini.
3. Input issues in table of interest.
4. Select cancer type of interest in browse page.
5. Click to export result table.
6. Click on subpathway ID to visualize subpathway in KEGG website.
7. Click on network sign to visualize subpathway in cytoscape.
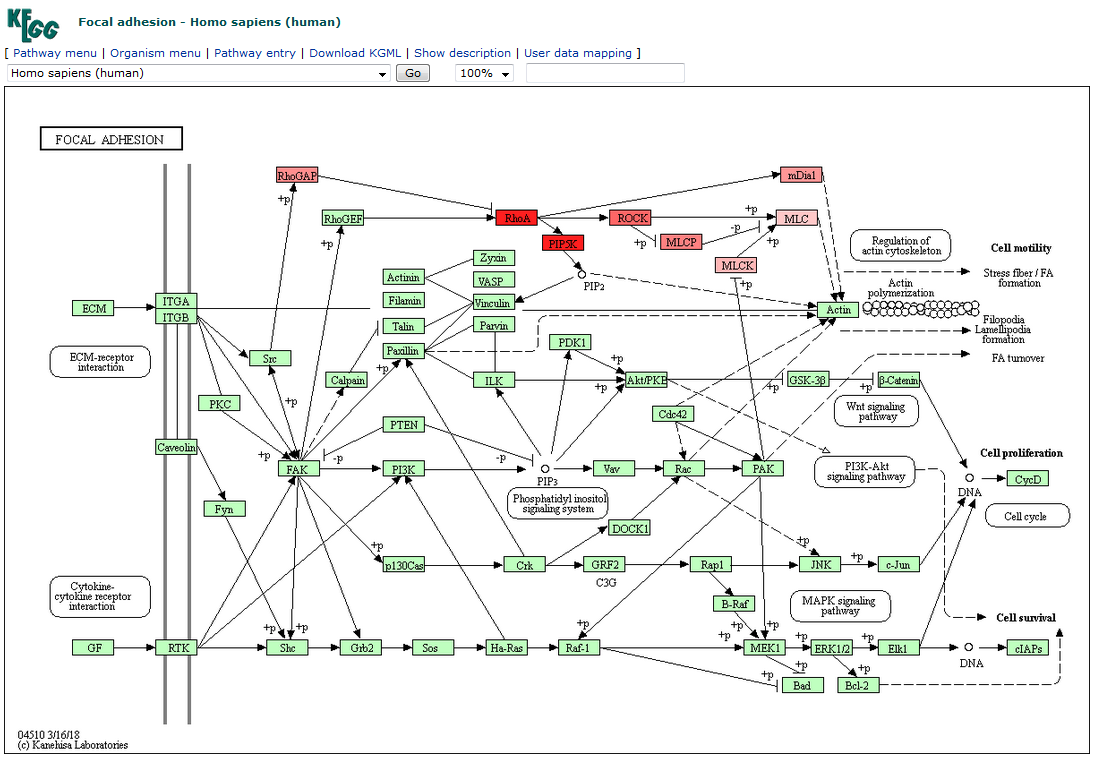
Visualization in KEGG website
Genes in subpathway are colored in red. The deeper the color, the more related with lncRNA it is.
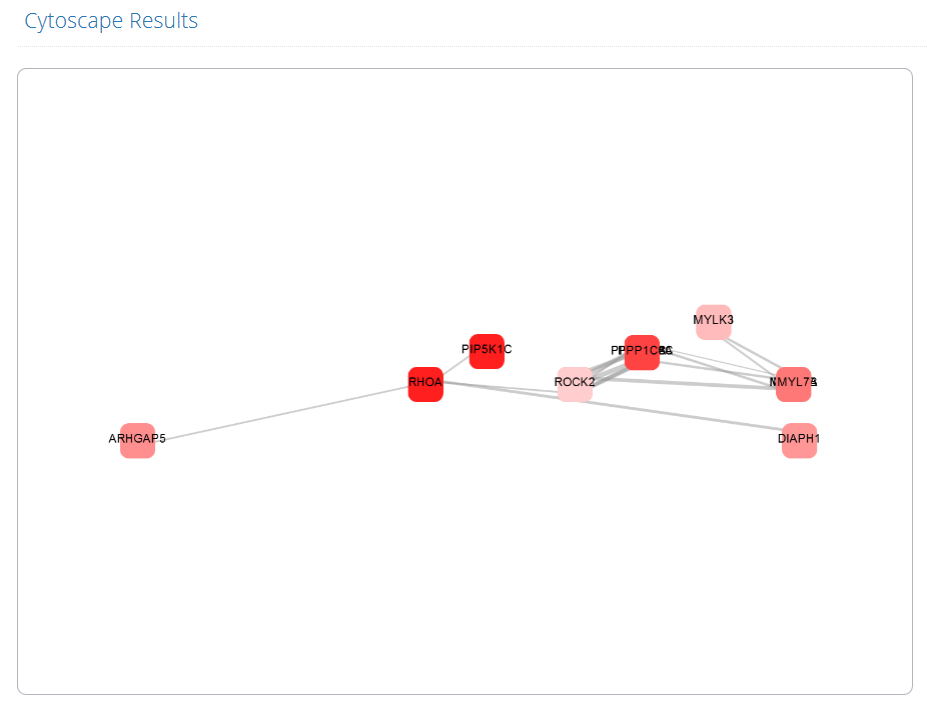
Visualization in cytoscape
Genes in subpathway are shown and colored in red. The deeper the color, the more related with lncRNA it is. The edge widths are coordinated with expression correlation between two genes. The layout of subpathway in cytoscape is consistent with its layout in KEGG website. All genes can be relocated with some Click-and-Drag mouse operations.