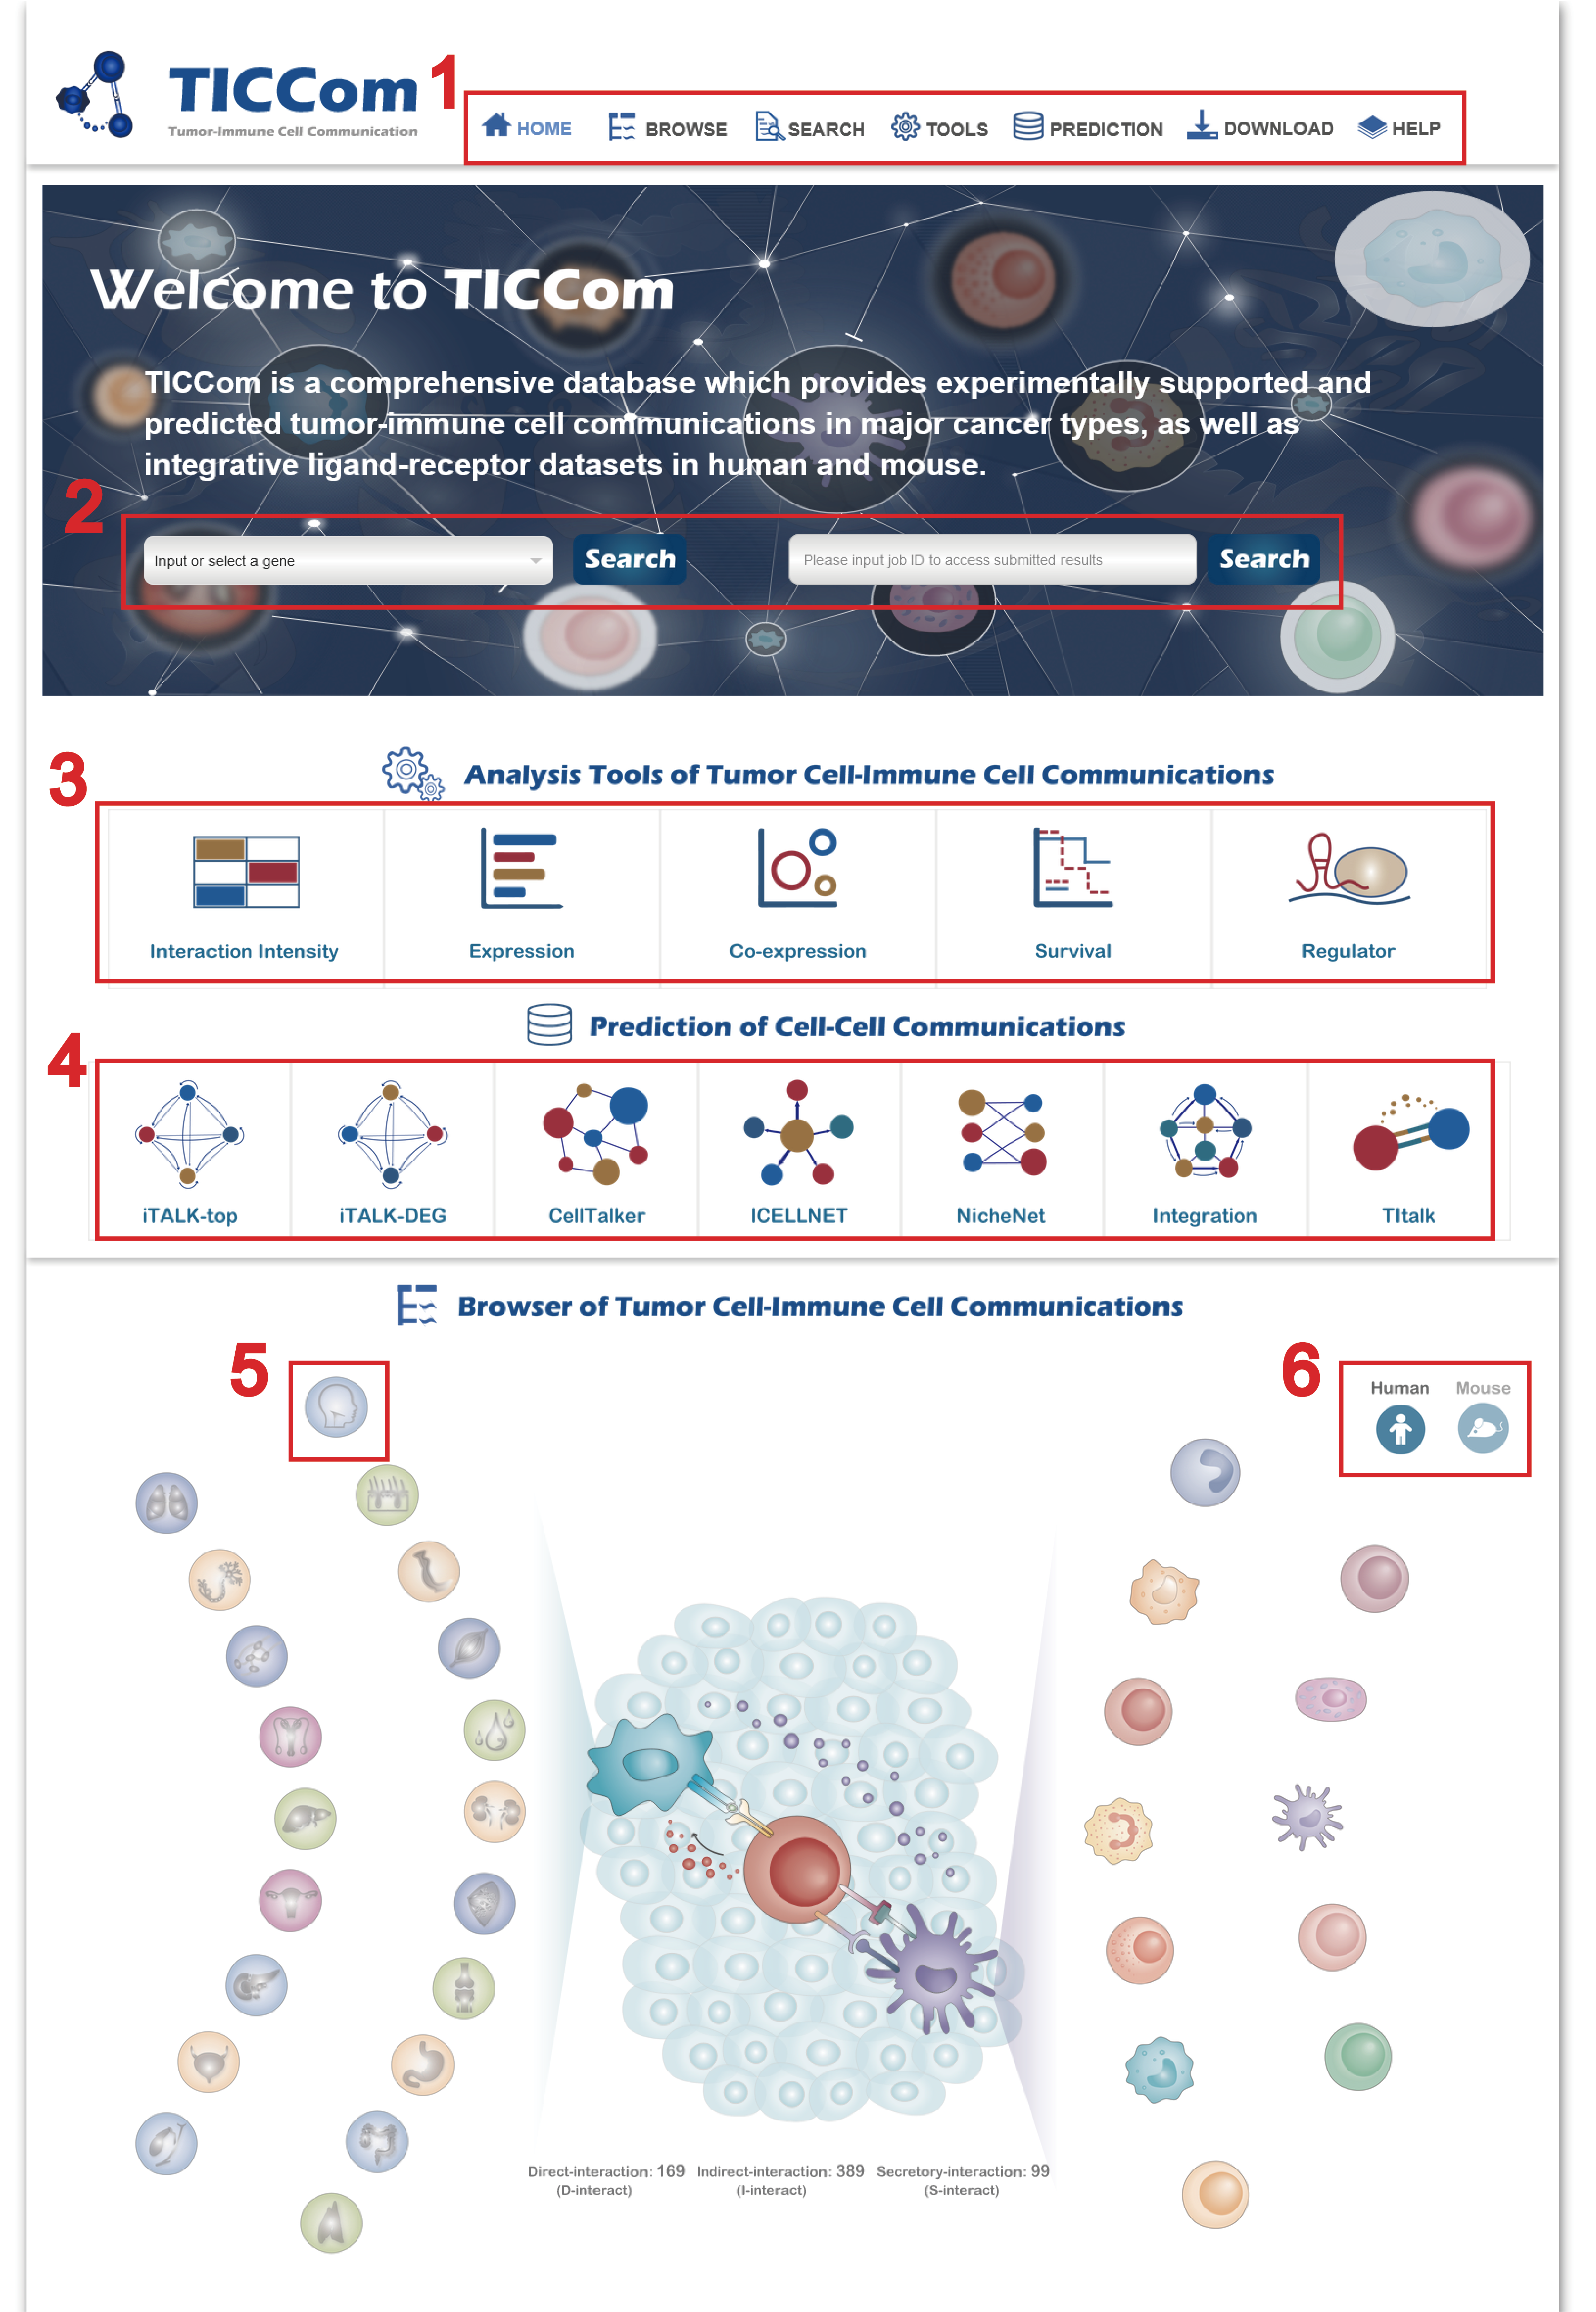
1. The main functions of TICCom are provided in menu bar form (boxed in red).
2. For the interested ligand-receptor pairs (from bulk, single cell or verified tumor and immune cell interactions), you can input/select a gene and click “Search” on the left to get detailed information. If you have submitted the job of analysis or predict work, input the job id on the right side to retrieve the results.
3. Click the buttons to search and get the detail results of analyzing the verified Tumor-Immune cell interaction genes and gene pairs.
4. Click the buttons to search and get the detail results of predicted cell-cell communications.
5. The mouse tumor-immune interaction map can be switched by clicking the icon at right.
6. Click each organ and immune cell to obtain the detailed information of certain tumor-immune cell interaction pairs.
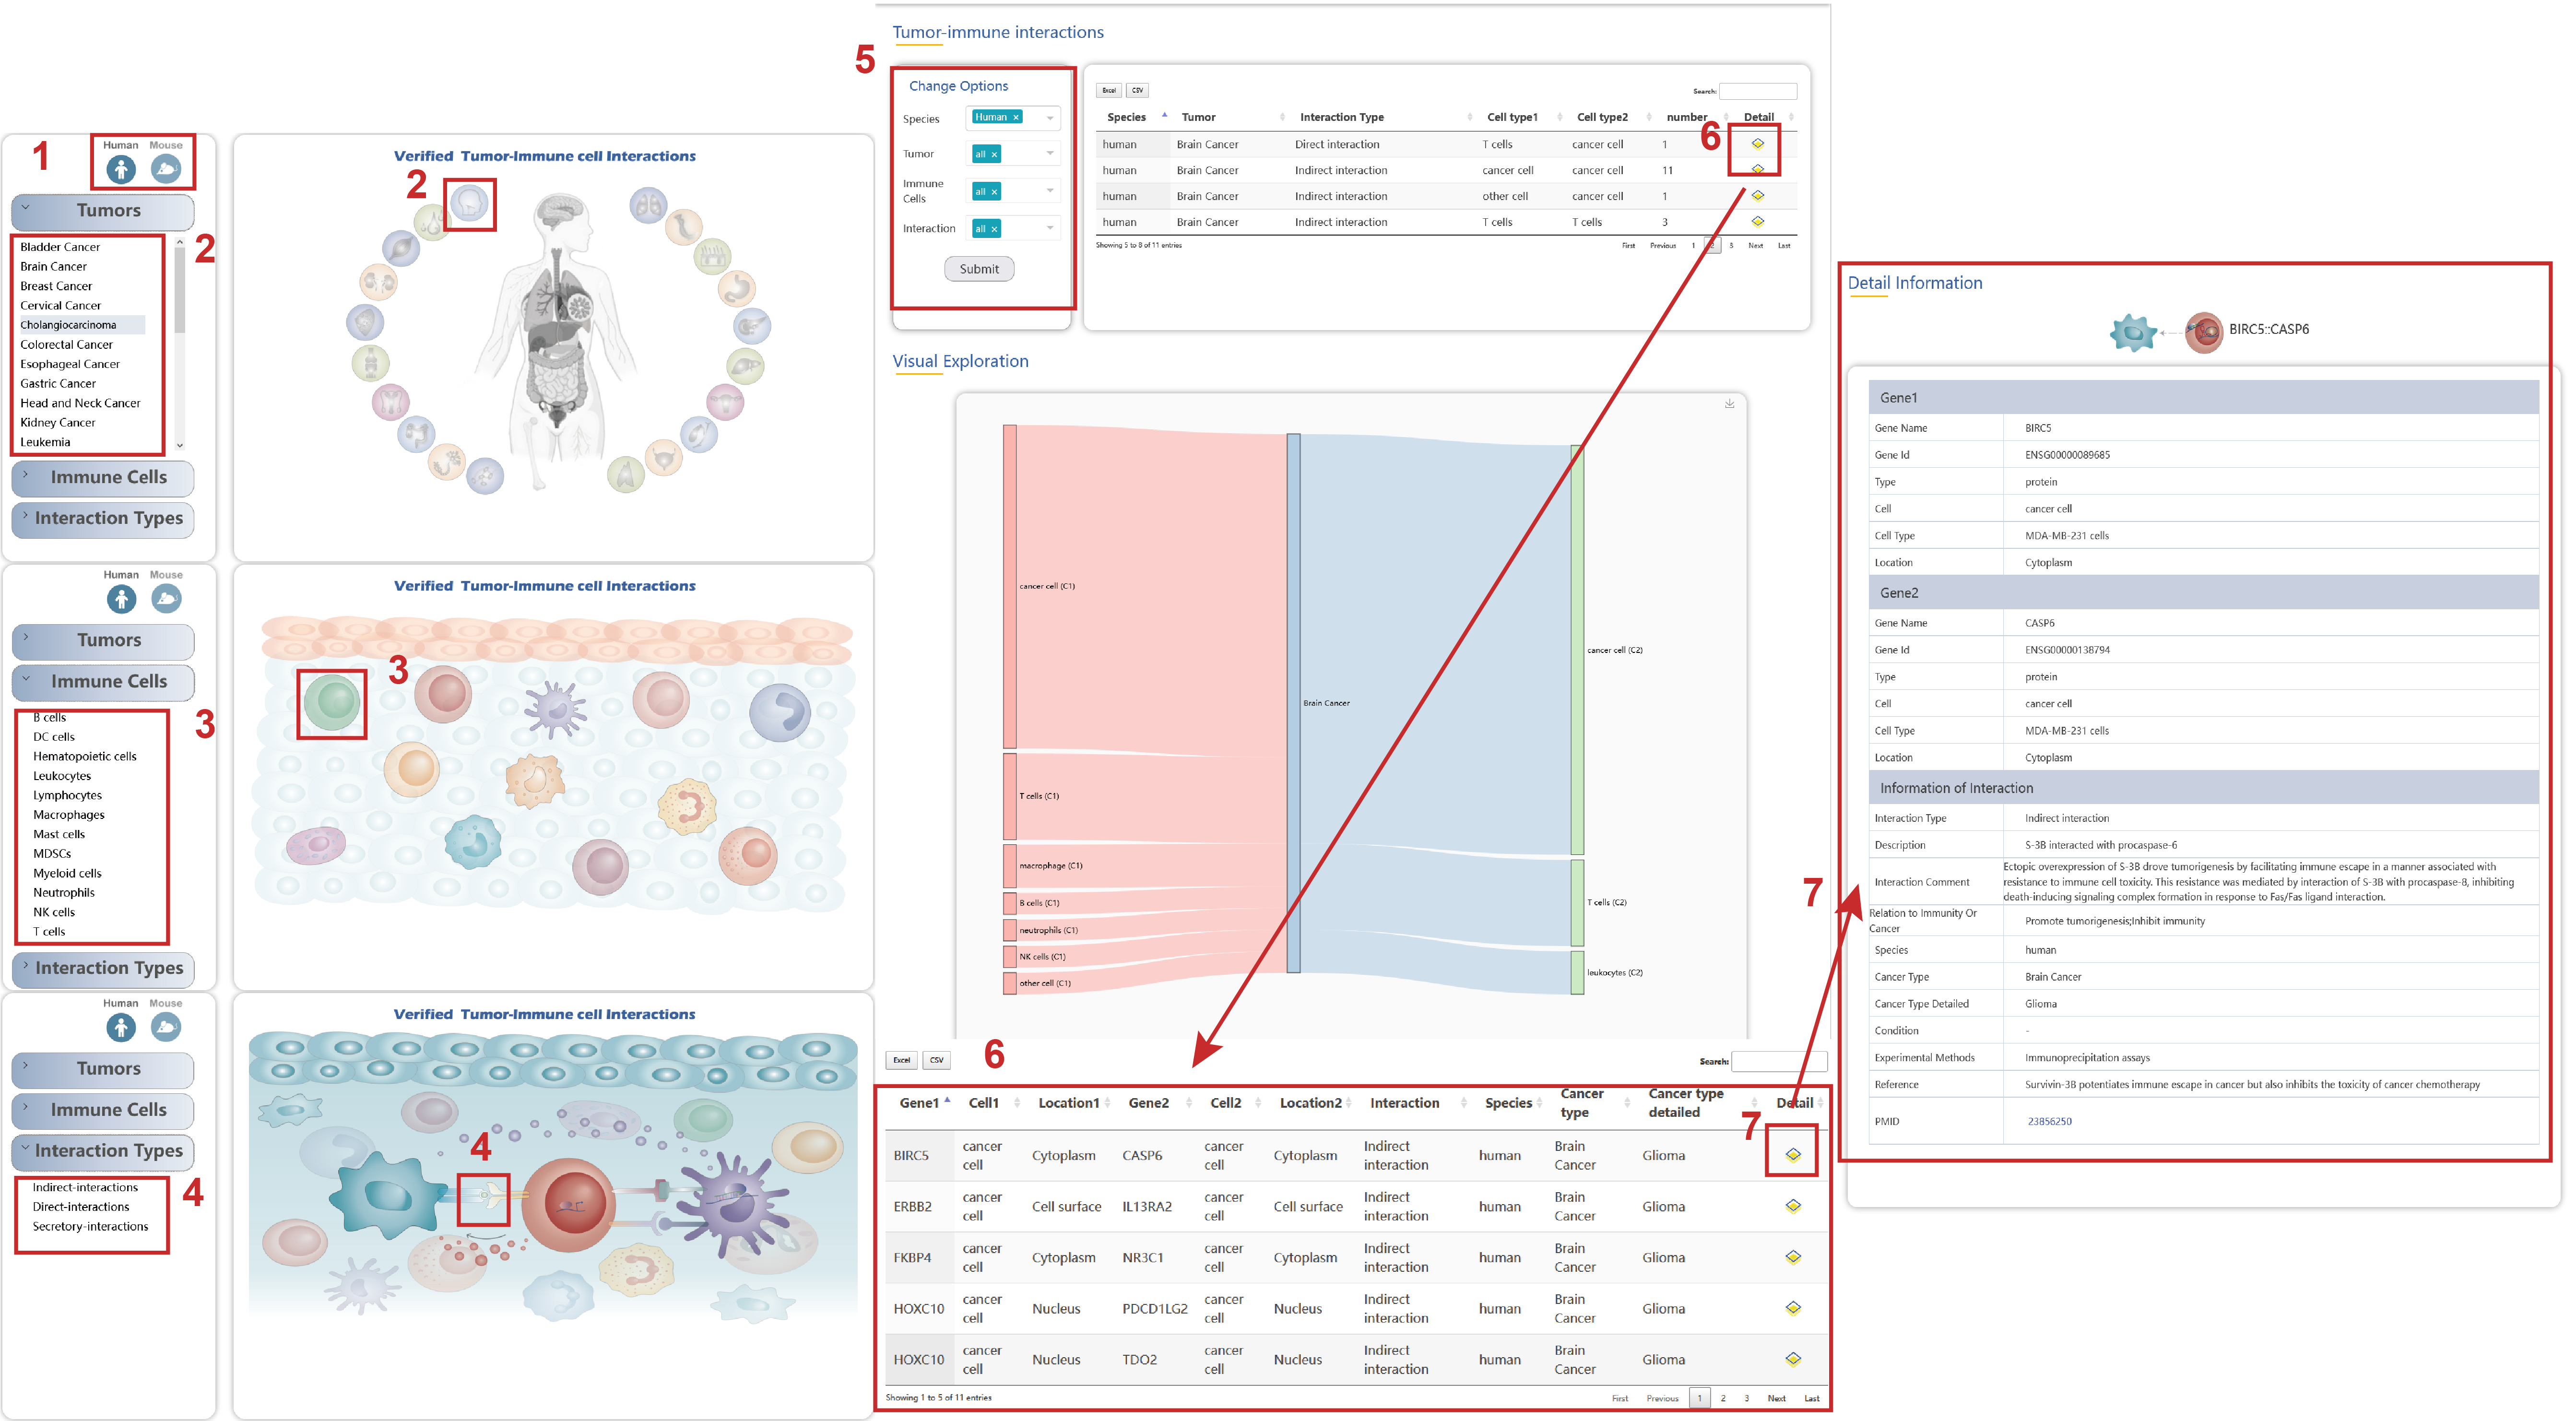
In the Verified TI Interaction page from the drop-down menu of Browse, there are three ways to get accurate Tumor-Immune cell interaction information:
1. The detailed information of tumor-immune interaction gene pairs of mouse can be switched by clicking the icon at the top left.
2. Choose the “Tumors” button to get the detailed information of verified tumor-immune interaction gene pairs in various cancer type by clicking the button on the left drop-down menu or the organ image on the right.
3. Choose the “Immune Cells” button to get the detailed information of verified tumor-immune interaction gene pairs in various immune cell types by clicking the button on the left drop-down menu or the immune cell image on the right.
4. Choose the “interaction Types” button to get the detailed information of verified tumor-immune interaction gene pairs by clicking the button on the left drop-down menu or the image on the right.
5. On the left part of the page, you can select different tumors, species, interactions and immune cells to get the verified tumor-immune interaction information of gene pairs on the right.
6. Click the “Detail” button to get more detailed information of tumor-immune cell interaction pairs.
7. Click the “Detail” button to get information of each interact gene pair including the literature details and so on.
In the Integrated LR Interactions page from the drop-down menu of Browse, there are two aspects to get the detailed information of ligand-receptor in different sources and functions:
1. The detailed information of integrated ligand-receptor gene pairs of mouse can be switched by clicking the icon at the top left.
2. Choose the “Functions” button to get the detailed information of ten functions of integrated ligand and receptor interactions by clicking the button on the left drop-down menu or the image on the right.
3. Choose the “Sources” button to get the detailed information of integrated ligand-receptor of nine data sources by clicking the button on the left drop-down menu or the image on the right.
4. On the left part of the page, you can select gene, source and function to get the detailed information of different sources and functions of ligand-receptor interactions.
In the Predicted TI Interactions page from the drop-down menu of Browse, users can browse by single-cell RNA-seq data and Bulk RNA-seq Data:
1. Choose a cancer type of one source to get the detailed information for predicted interaction strength of ligand-receptor and verified tumor-immune interaction on Bulk RNA-seq level by clicking the button on the left drop-down menu or organ images on the right.
2. The detailed information of verified tumor-immune cell interaction pairs, ligand-receptor interaction gene pairs can be switched by clicking the icon at the top left.
3. The river plot of verified or ligand-receptor interaction gene pairs in various cancer types.
4. There are ligand-receptor interactions predicted by different methods based on single-cell RNA-seq data by clicking the data series.
5. The river plot of ligand-receptor interaction gene pairs in various datasets.
In the Verified TI Interaction page from the drop-down menu of Search, there are two ways to get accurate Tumor-Immune cell interaction information:
1. Input a gene symbol or a cancer type to get the detailed information of tumor-immune cell interaction gene pairs.
2. Select different items to get more specific information of tumor-immune cell interaction gene pairs.
3. On the left part of the page, you can select different tumors, species, interactions and immune cells to get the verified tumor-immune interaction information of gene pairs on the right.
4. Click the “Detail” button to get more detailed information of tumor-immune cell interaction gene pairs.
5. Click the “Detail” button to get information of each interaction gene pair including the literature details.

In the Integrated LR Interactions page from the drop-down menu of Search, there are two ways to get accurate ligand-receptor interaction information:
1. Input a gene symbol to get the detailed information of ligand-receptor interaction pairs of different functions in various sources.
2. Select different items to get more specific information.
3. On the left part of the page, you can select a gene, a source, a function of ligand-receptor on the right to get the detailed information of ligand-receptor of gene pairs.
In the Predicted TI Interactions (Single Cell RNA-seq Data) page from the drop-down menu of Search:
1. Input a gene symbol, select a cancer type and choose a dataset, users can get the detailed information of integrated ligand-receptor interactions.
In the Predicted TI Interactions (Bulk RNA-seq Data) page from the drop-down menu of Search:
1. Input a gene symbol, choose a tumor type and corresponding sources.
2. Users can browse the results of significantly interaction strength and significance of verified tumor-immune interactions and ligand-receptor interactions in various cancers.
In the Expression page from the drop-down menu of Tools:
1. Users can upload gene IDs/gene symbols of interaction gene pairs and upload expression profile or select (a) cancer type(s).
2. A brief instruction about the results of the expression features of tumor-immune interaction genes in certain cancer type(s) or your own uploaded expression file.
3. The heatmap in this panel displays the expression of tumor-immune interaction genes in certain cancer(s). Users can get the expression value of interaction genes by clicking the color blocks.
4. Users can compare the expression of tumor-immune interaction gene with the same number of interact-genes randomly selected in each cancer type or your own cancer through the boxplot.
In the Co-expression page from the drop-down menu of Tools:
1. Users can upload gene IDs/gene symbols of interaction gene pairs and upload expression profile or select (a) cancer type(s), users also should select a cutoff of pearson coefficients and p values.
2. A brief instruction about the results of the co-expression relationship of verified tumor-immune interaction gene pairs in certain cancer type(s) or your own uploaded expression file.
3. Through the heatmap, users can get the Pearson correlation coefficient of common interaction pairs across cancer types or the top 25 of significantly correlative pairs in one cancer.
4. Through the heatmap, users can get the Pearson correlation coefficient of common interaction pairs across TCGA cancer(s) or the top 25 of significantly correlative pairs in your cancer profile.
5. Users can compare the Pearson correlation coefficients of tumor-immune interaction genes with the same number of interact-genes randomly selected in each each cancer type or your cancer through the boxplot.
In the Survival page from the drop-down menu of Tools:
1. Users can upload gene IDs/gene symbols of interaction gene pairs, upload survival data of patients and expression profile or select (a) cancer type(s), users also should select a P value of Log-rank test.
2. A brief instruction about the results of the survival features of verified tumor-immune interaction gene pairs in certain cancer type(s) or your own uploaded expression file.
3. Users can get the risk scores and log-rank p vaules of tumor-immune interaction genes in certain cancer(s) or your uploaded expression profile.
4. Users can get the survival risk score of the top 25 of common interaction pairs across across cancer types or the top 25 genes with the highest risk score according to your datasets.
5. Users can obtain the number of survival protective and risk interaction genes in each cancer by the horizontal barplot.
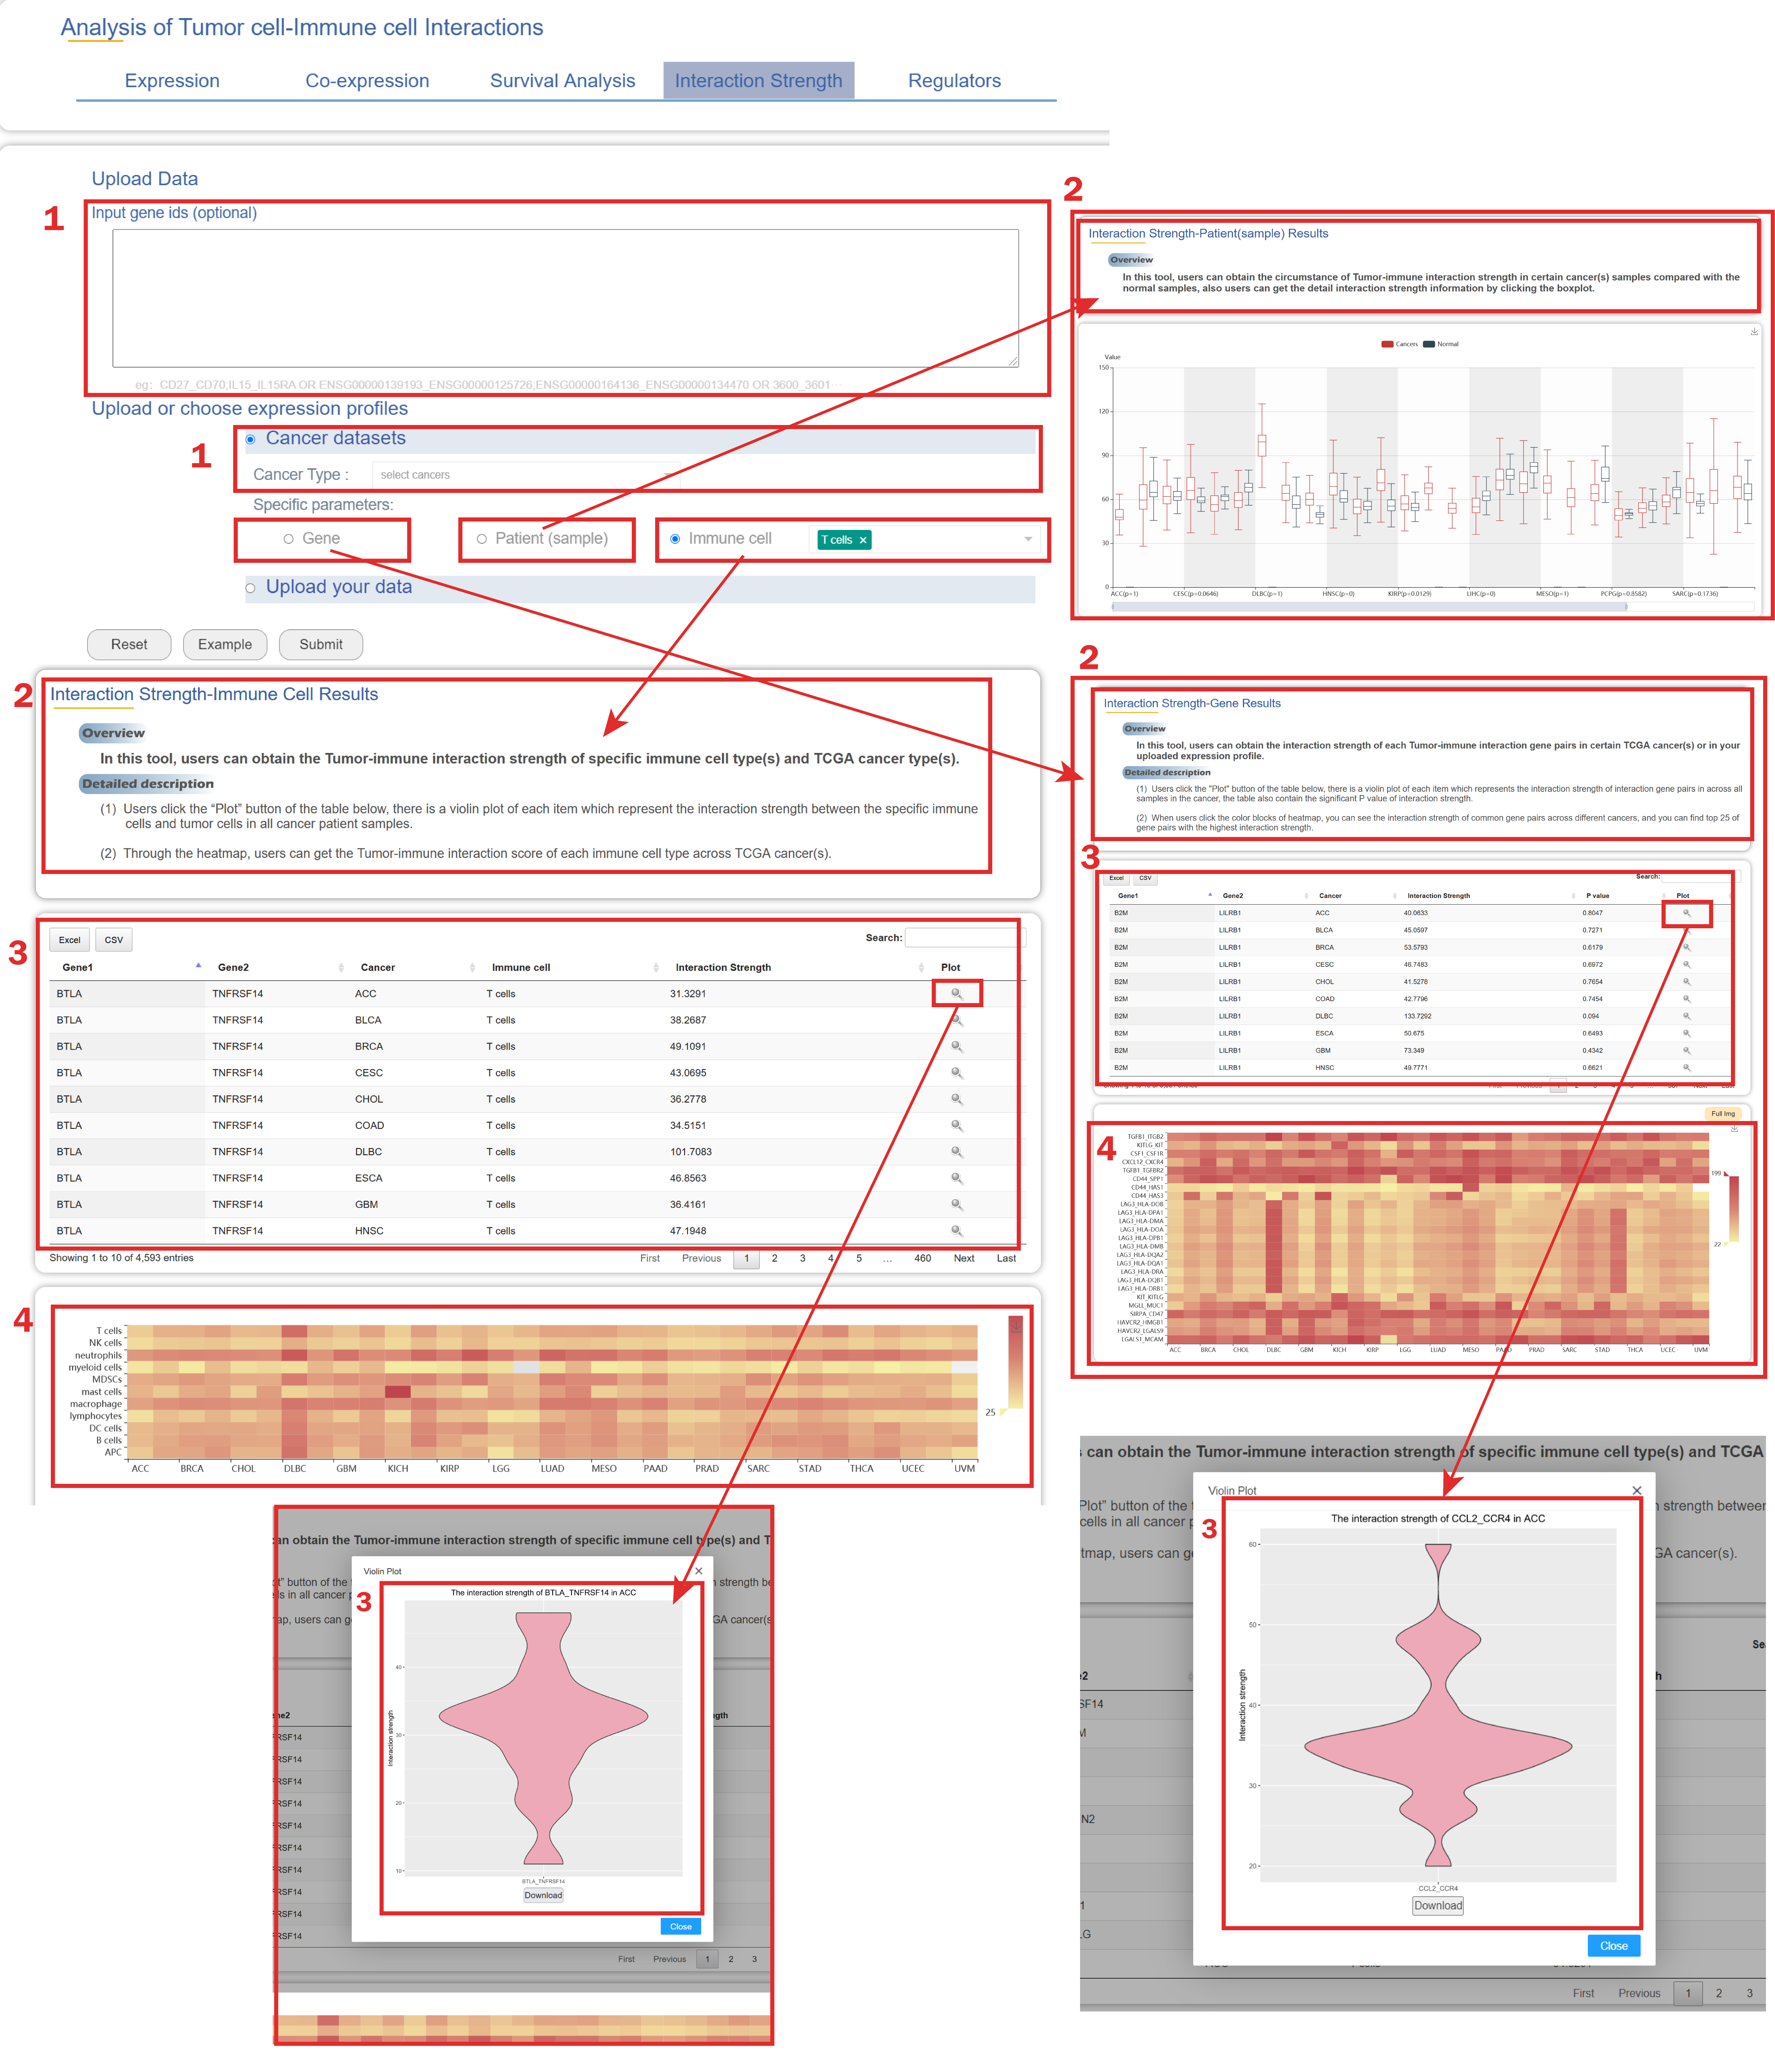
In Interaction Intensity page from the drop-down menu of Tools:
1. Users can upload gene IDs/gene symbols of interaction gene pairs, should select a cancer with one parameter (Gene/Patient/Immune cell) or upload expression profile.
2. A brief instruction about the results of the survival features of verified tumor-immune interaction genes in certain cancer type(s) or your own uploaded expression file.
3. Users click the "Plot" button of the table below, there is a violin plot of each item which represents the interaction strength of interaction gene pairs across all samples in the cancer, the table also contain the significant P value of interaction strength.
4. When users click the color blocks of heatmap, you can see the interaction strength of common gene pairs across different cancers, and you can find top 25 of gene pairs with the highest interaction strength.
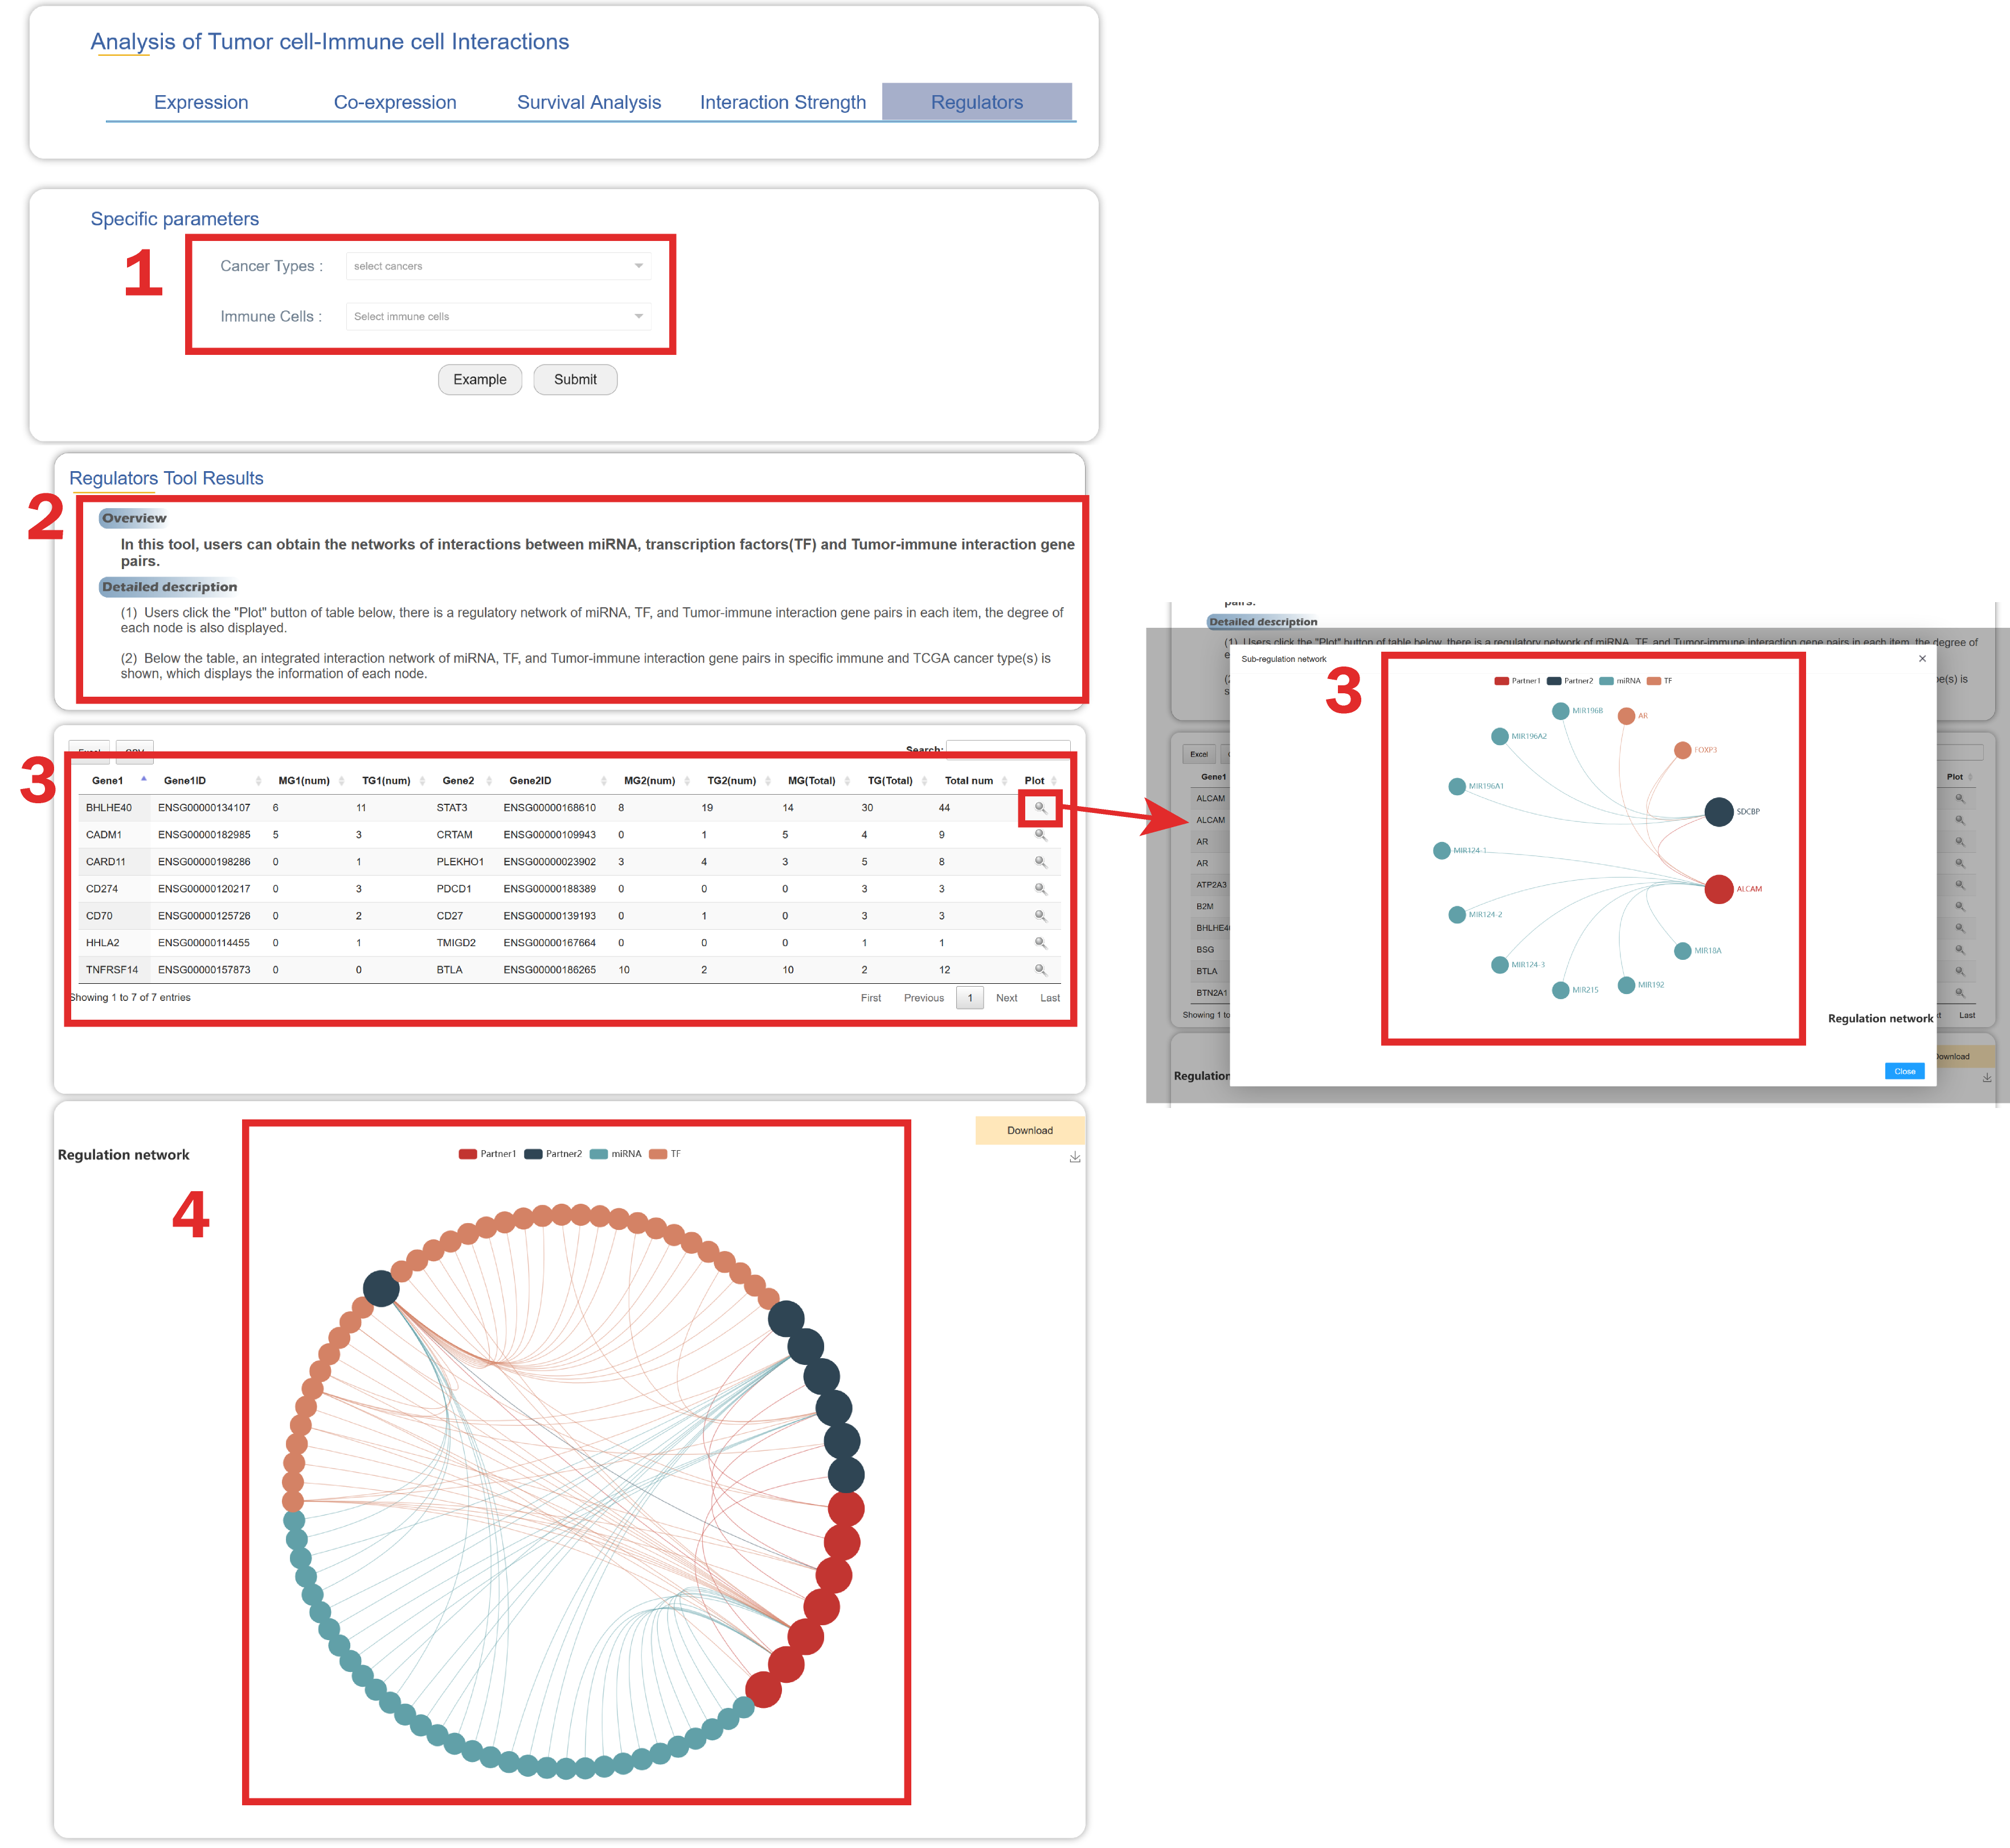
In Regulator page from the drop-down menu of Tools:
1. Users should select cancer type(s) and immune cell type(s).
2. A brief instruction about the regulatory network containing miRNA, transcription factors(TF) and tumor-immune interaction gene pairs.
3. Users click the "Plot" button of table below, there is a regulatory network of miRNA, TF, and each tumor-immune interaction gene pair.
4. Below the table, a regulatory network of miRNA, TF, and all tumor-immune interaction gene pairs in specific immune cell and cancer type is shown.
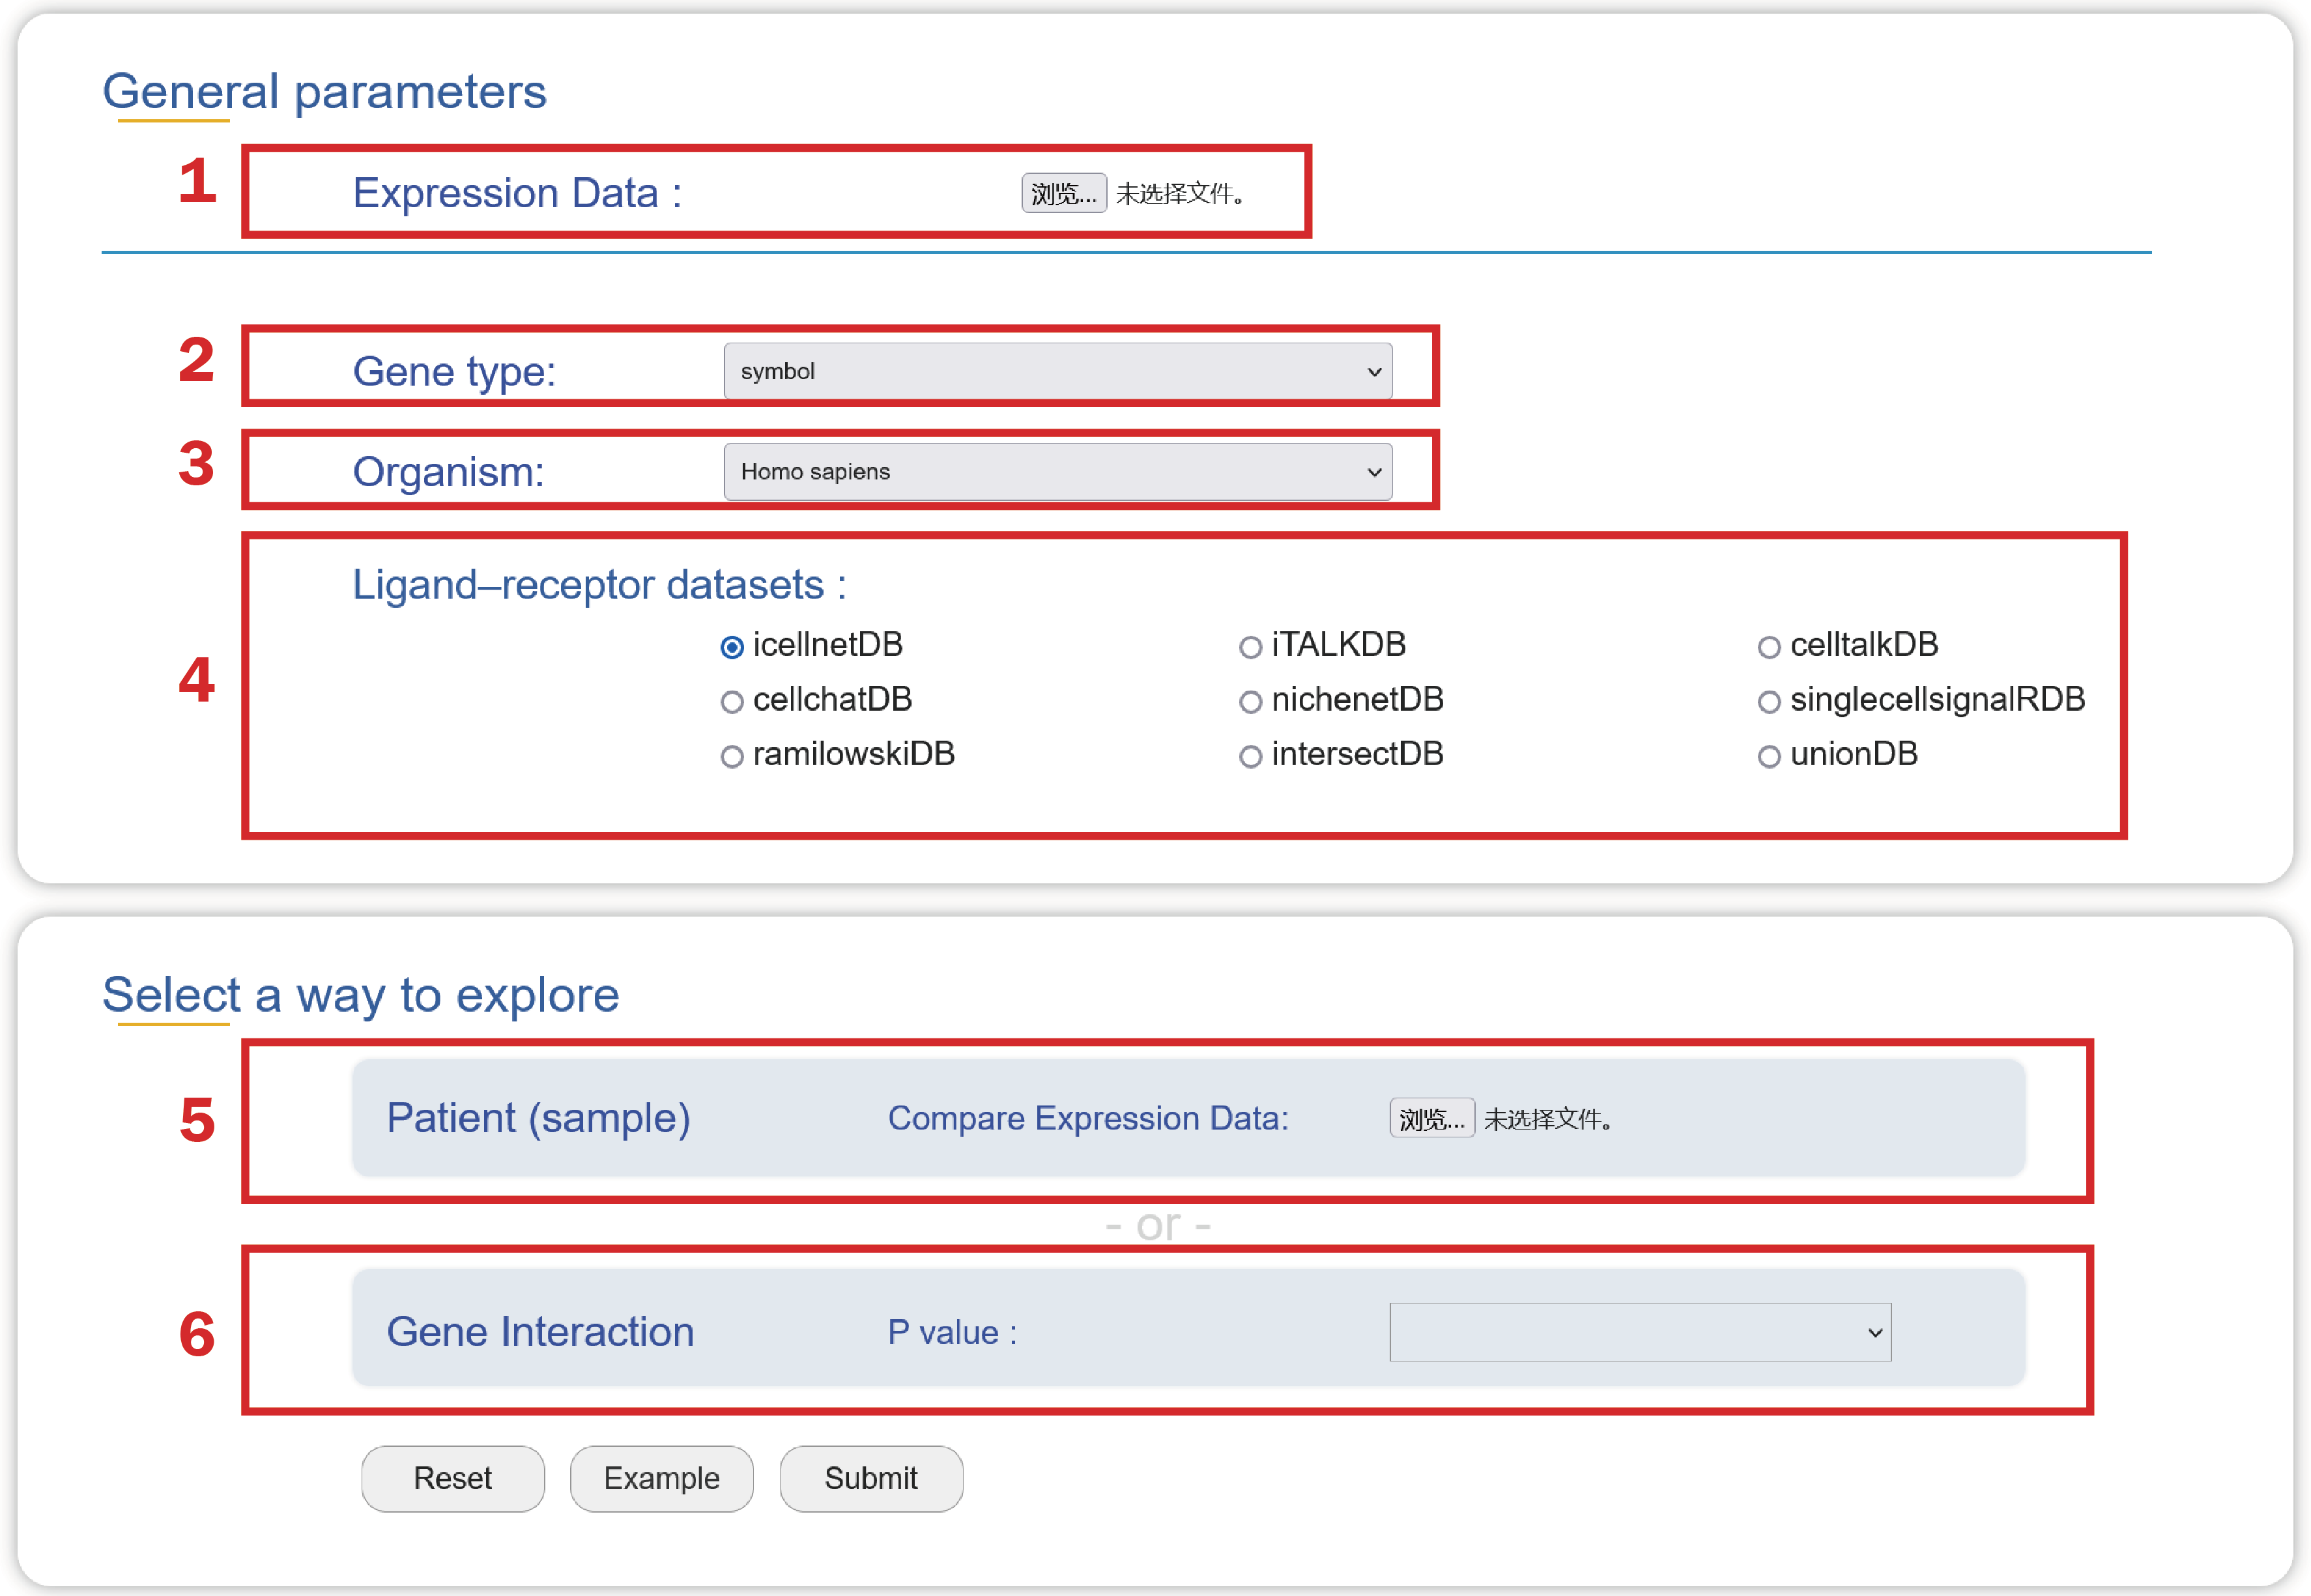
1. Upload an Expression Data.
2. Choose a type of gene ids used in your data.
3. Select an organism that you are interested in.
4. Choose a ligand-receptor dataset to predict interaction strength that may mediate cell-cell crosstalk in your data.
5. Upload a comparison group file if you choose “patient” to explore the interaction strength.
6. Choose a p value to select strong interacting gene pairs in your data.
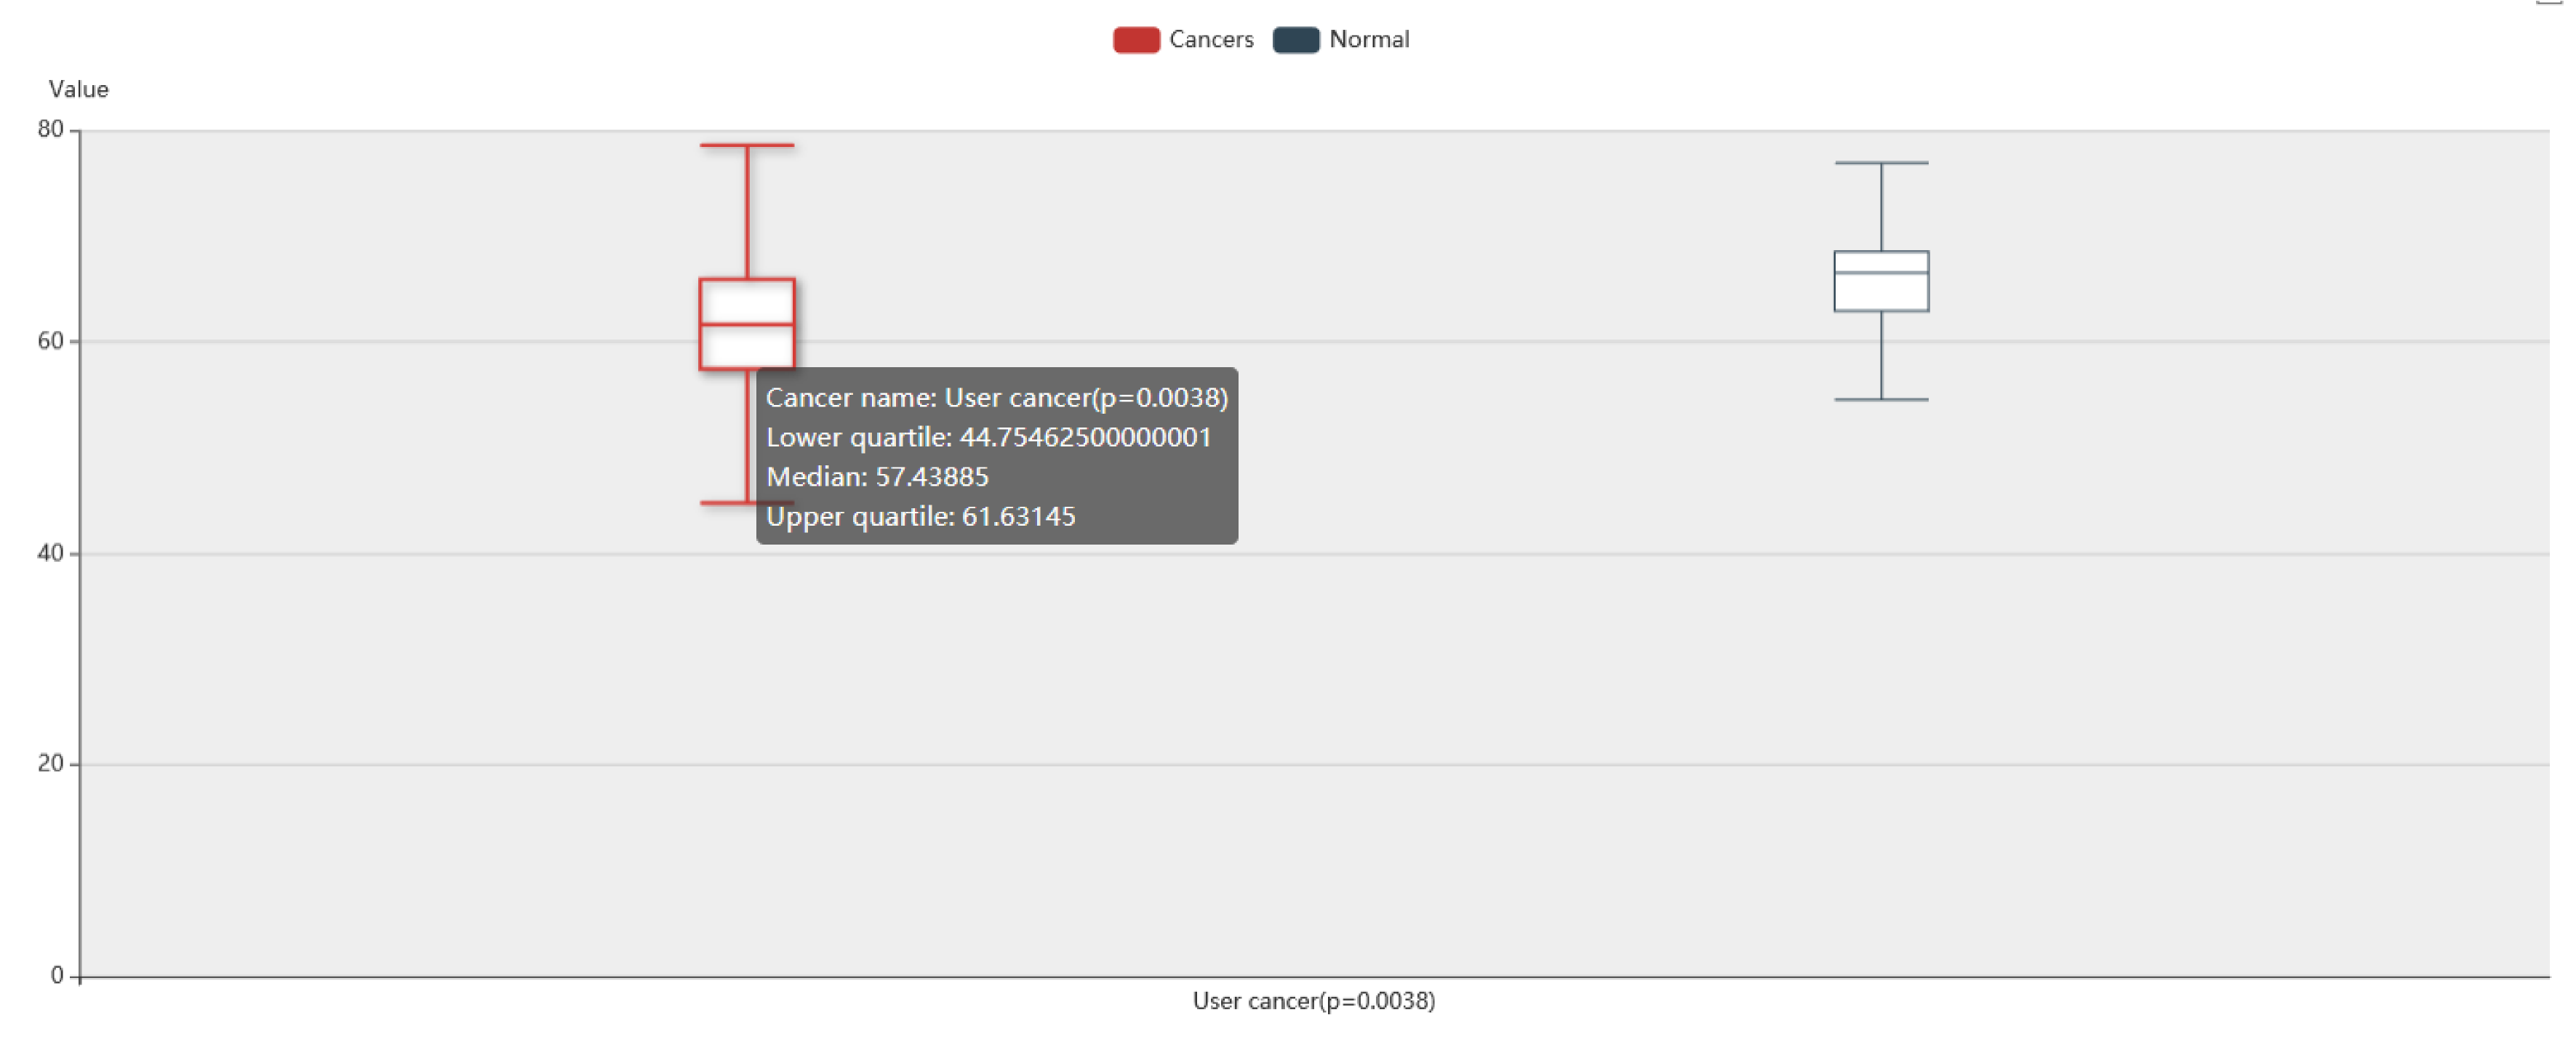
In the result page of TItalk-Patient, users can get a boxplot shows the differences of interaction strength of patients across all ligand-receptor pairs between Expression Data and Comparison Group File.
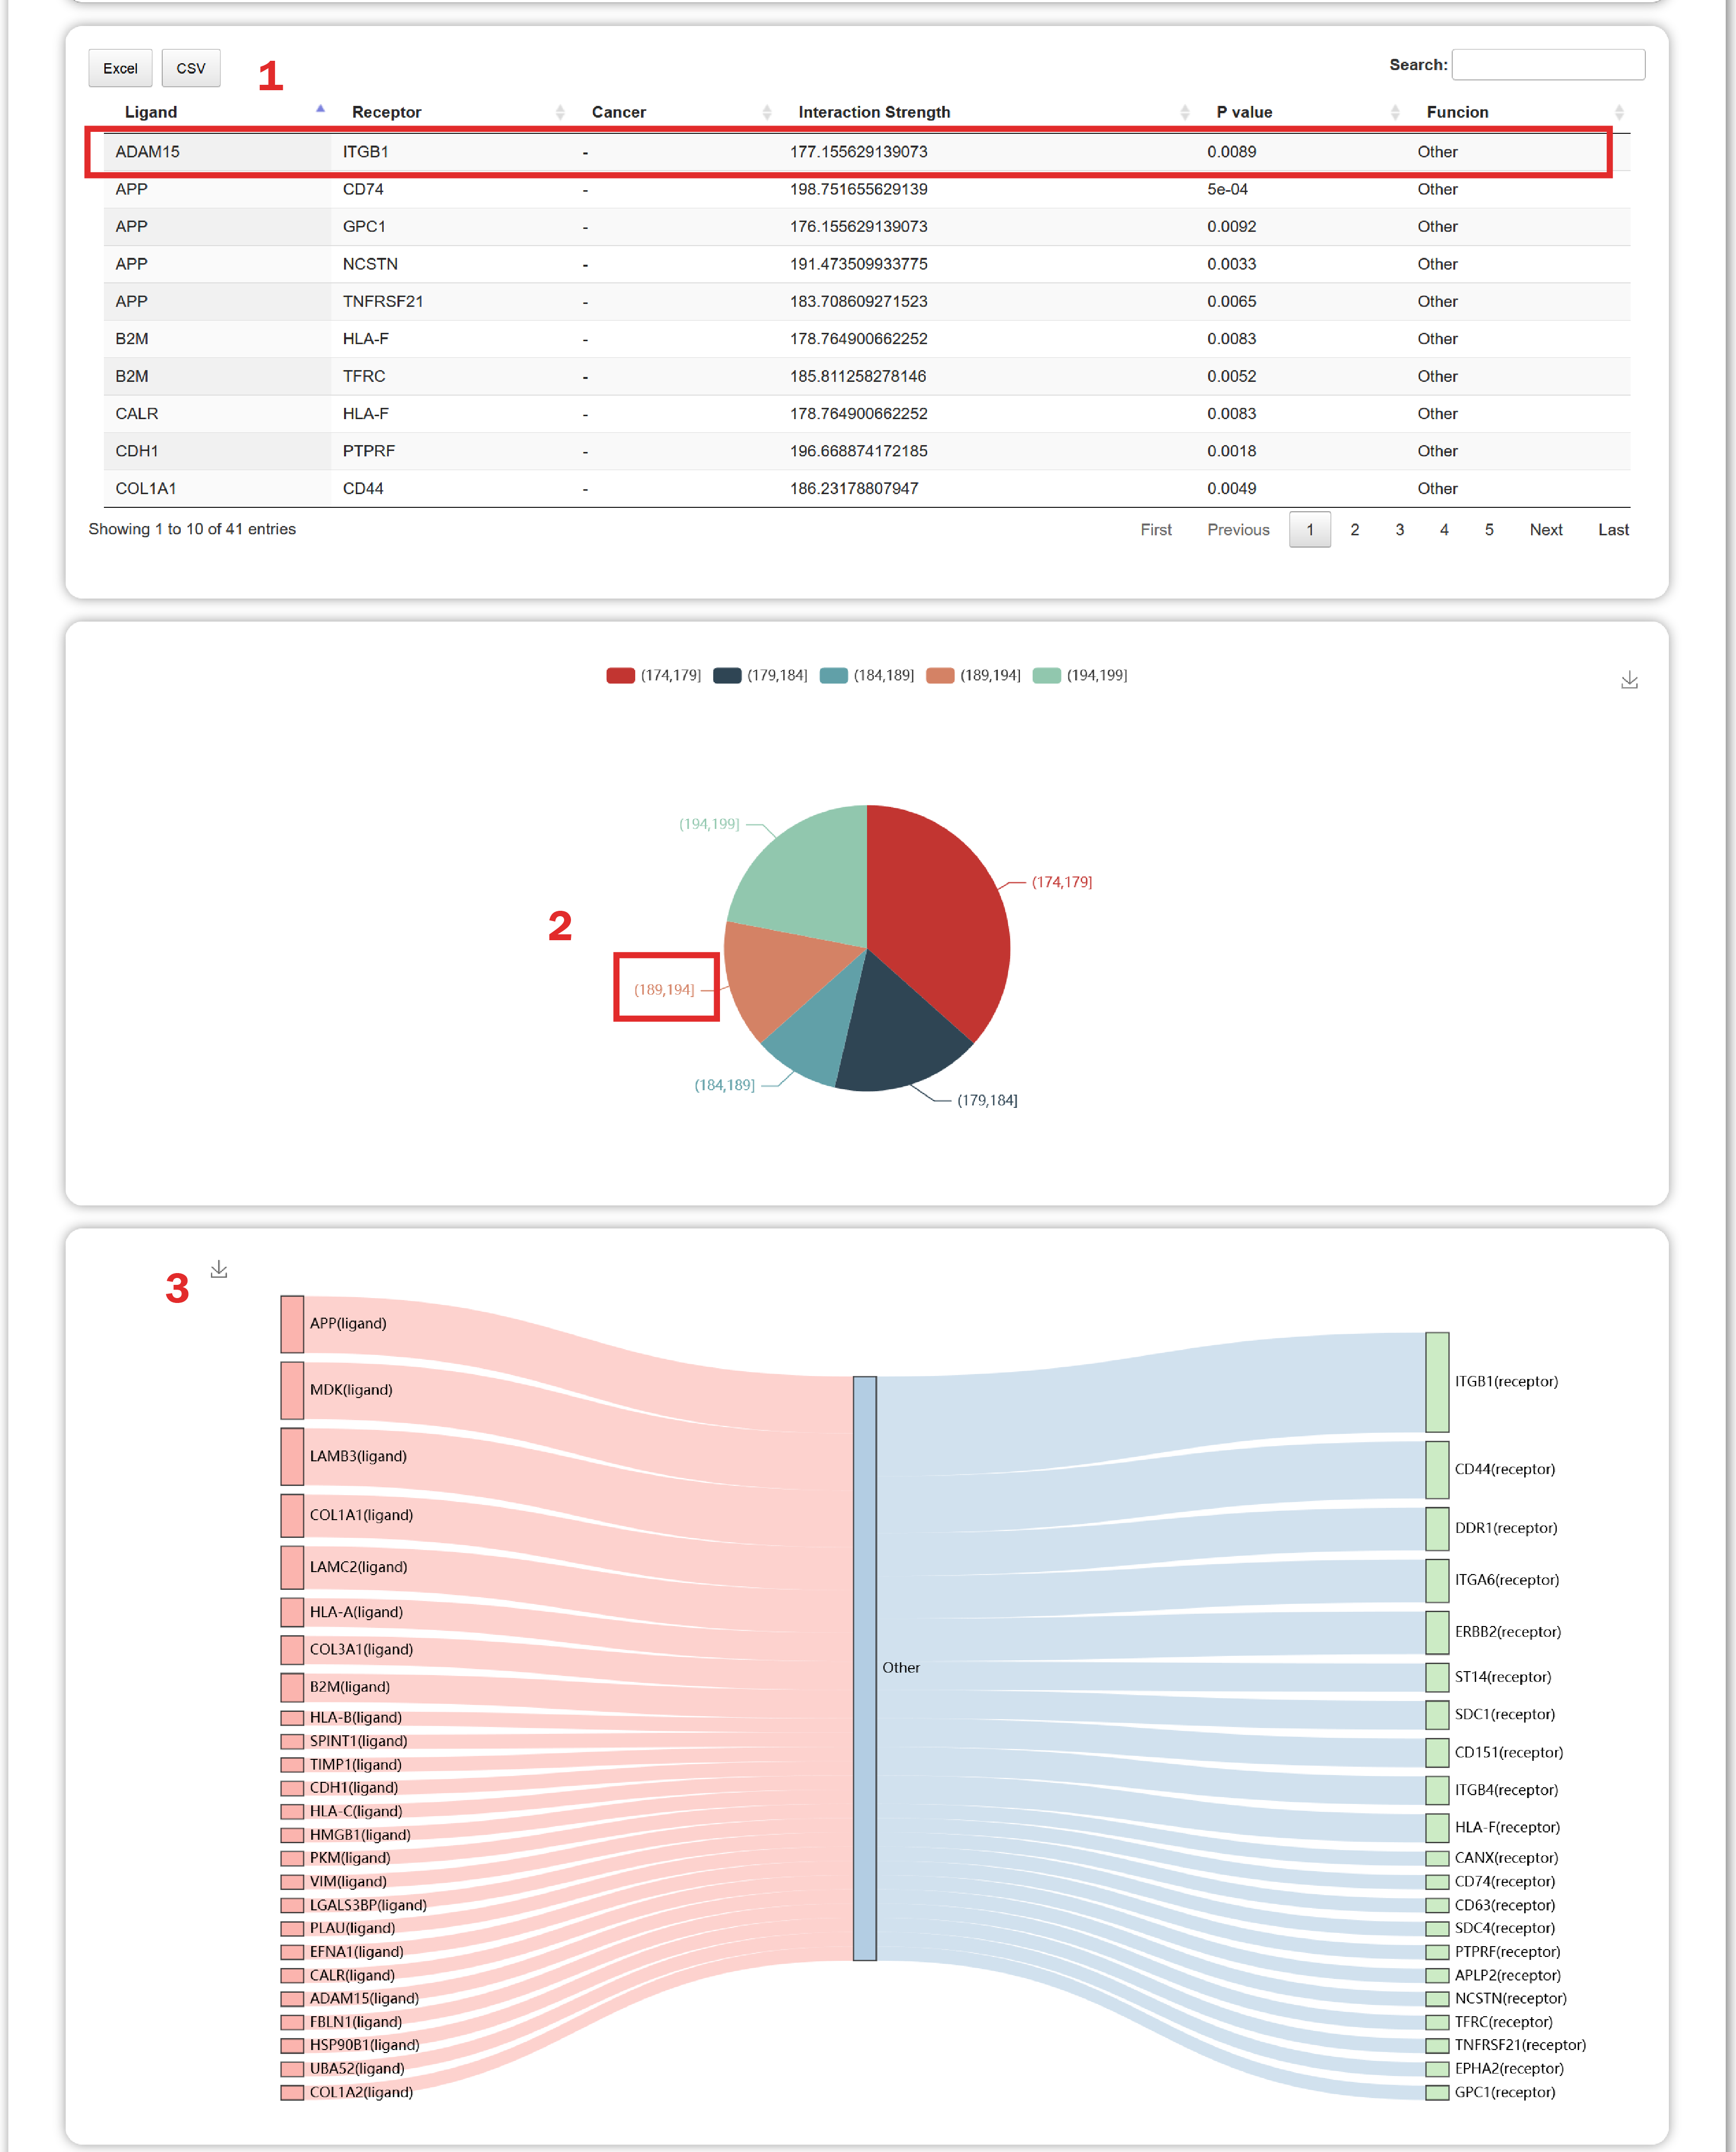
In the result page of TItalk-Gene, users can get an overview of interaction strength of ligand-receptor pairs.
1. Users can get a table containing interaction strength, p value and functions of gene pairs.
2. Users can obtain the distribution of interaction strength of these gene pairs.
3. Users can get a riverplot which shows 50 interactions sorted by the “interaction strength”.
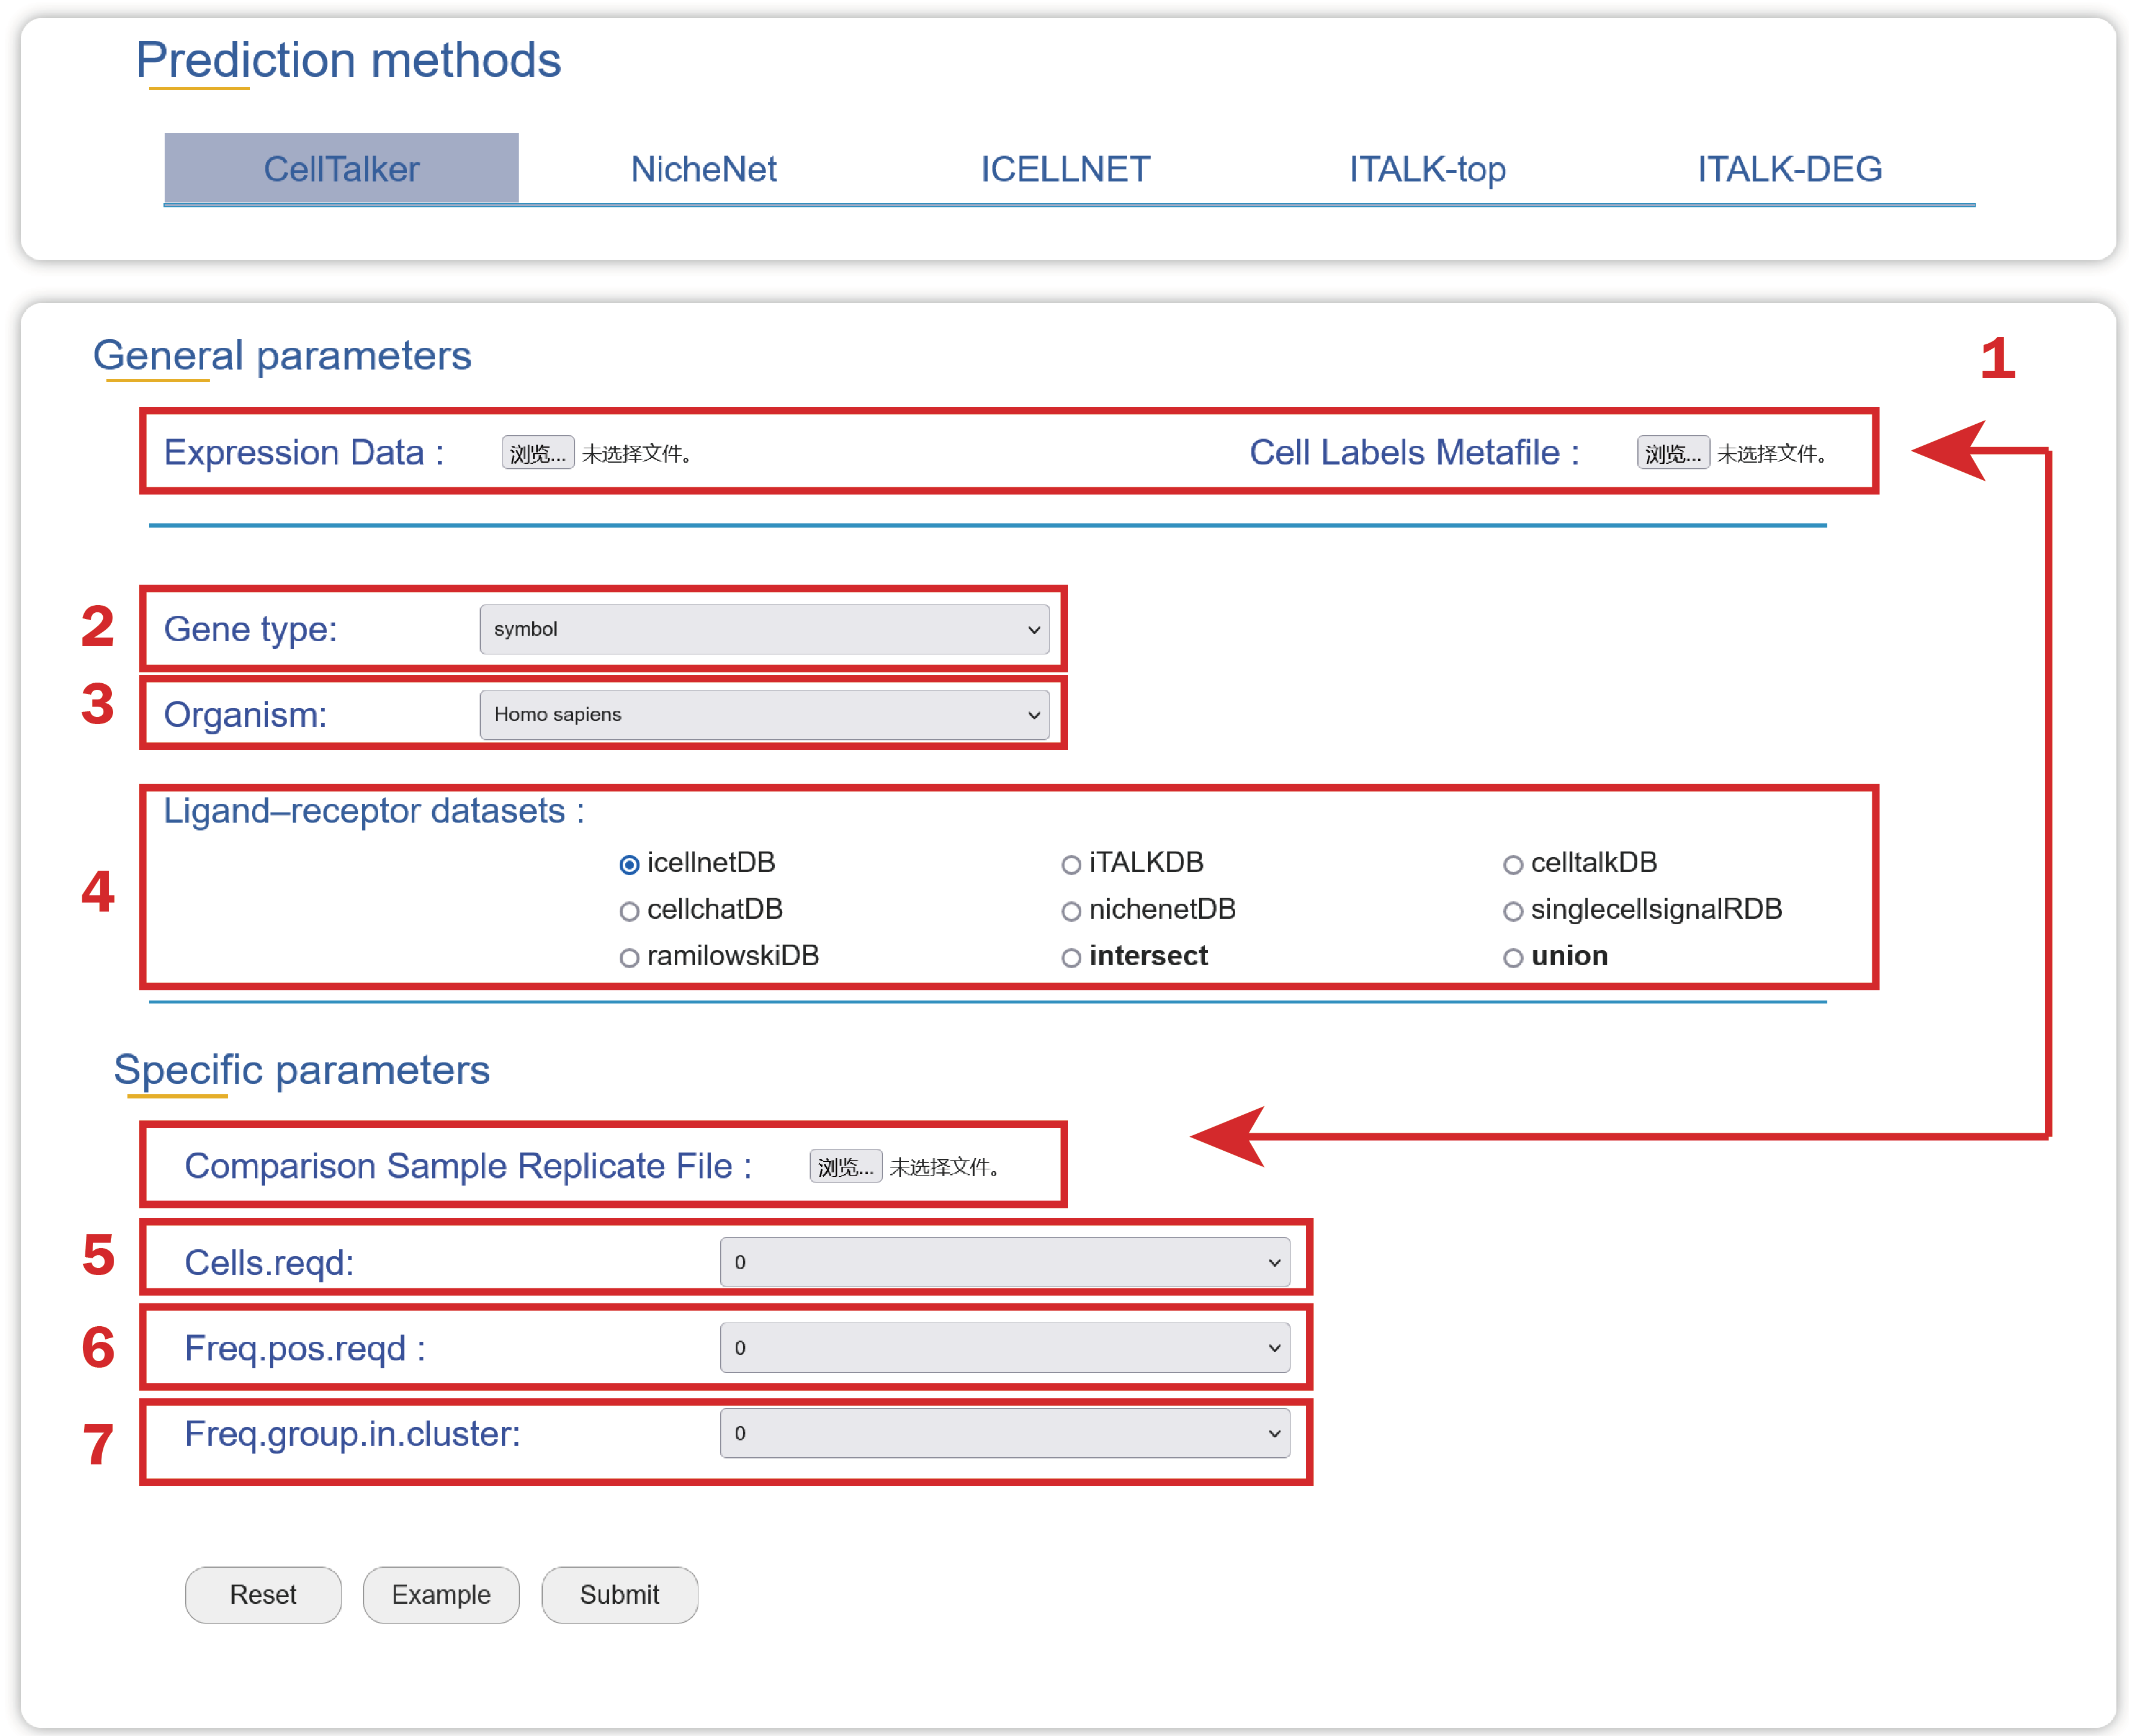
1. Upload an Expression Data, a Cell Labels Metafile, a Comparison Sample Replicate File with three columns named “cell”, “compare_type” and “replicate”, which can be used to find consistently expressed ligands and receptors among comparable groups and biological replicates.
2. Choose a type of gene ids used in your data.
3. Choose an organism that is consistent with your data source.
4. Choose a ligand-receptor dataset to find cell-cell crosstalk mediated by these gene pairs.
5. Choose an integer value representing the number of cells required to express a given ligand or receptor within a cluster from an individual replicate.
6. Select a fraction presenting the fraction of individual replicate samples that must express a ligand or receptor above the cells.reqd threshold.
7. Select a fraction describing the frequency of cells from a given group required to be in a cluster.
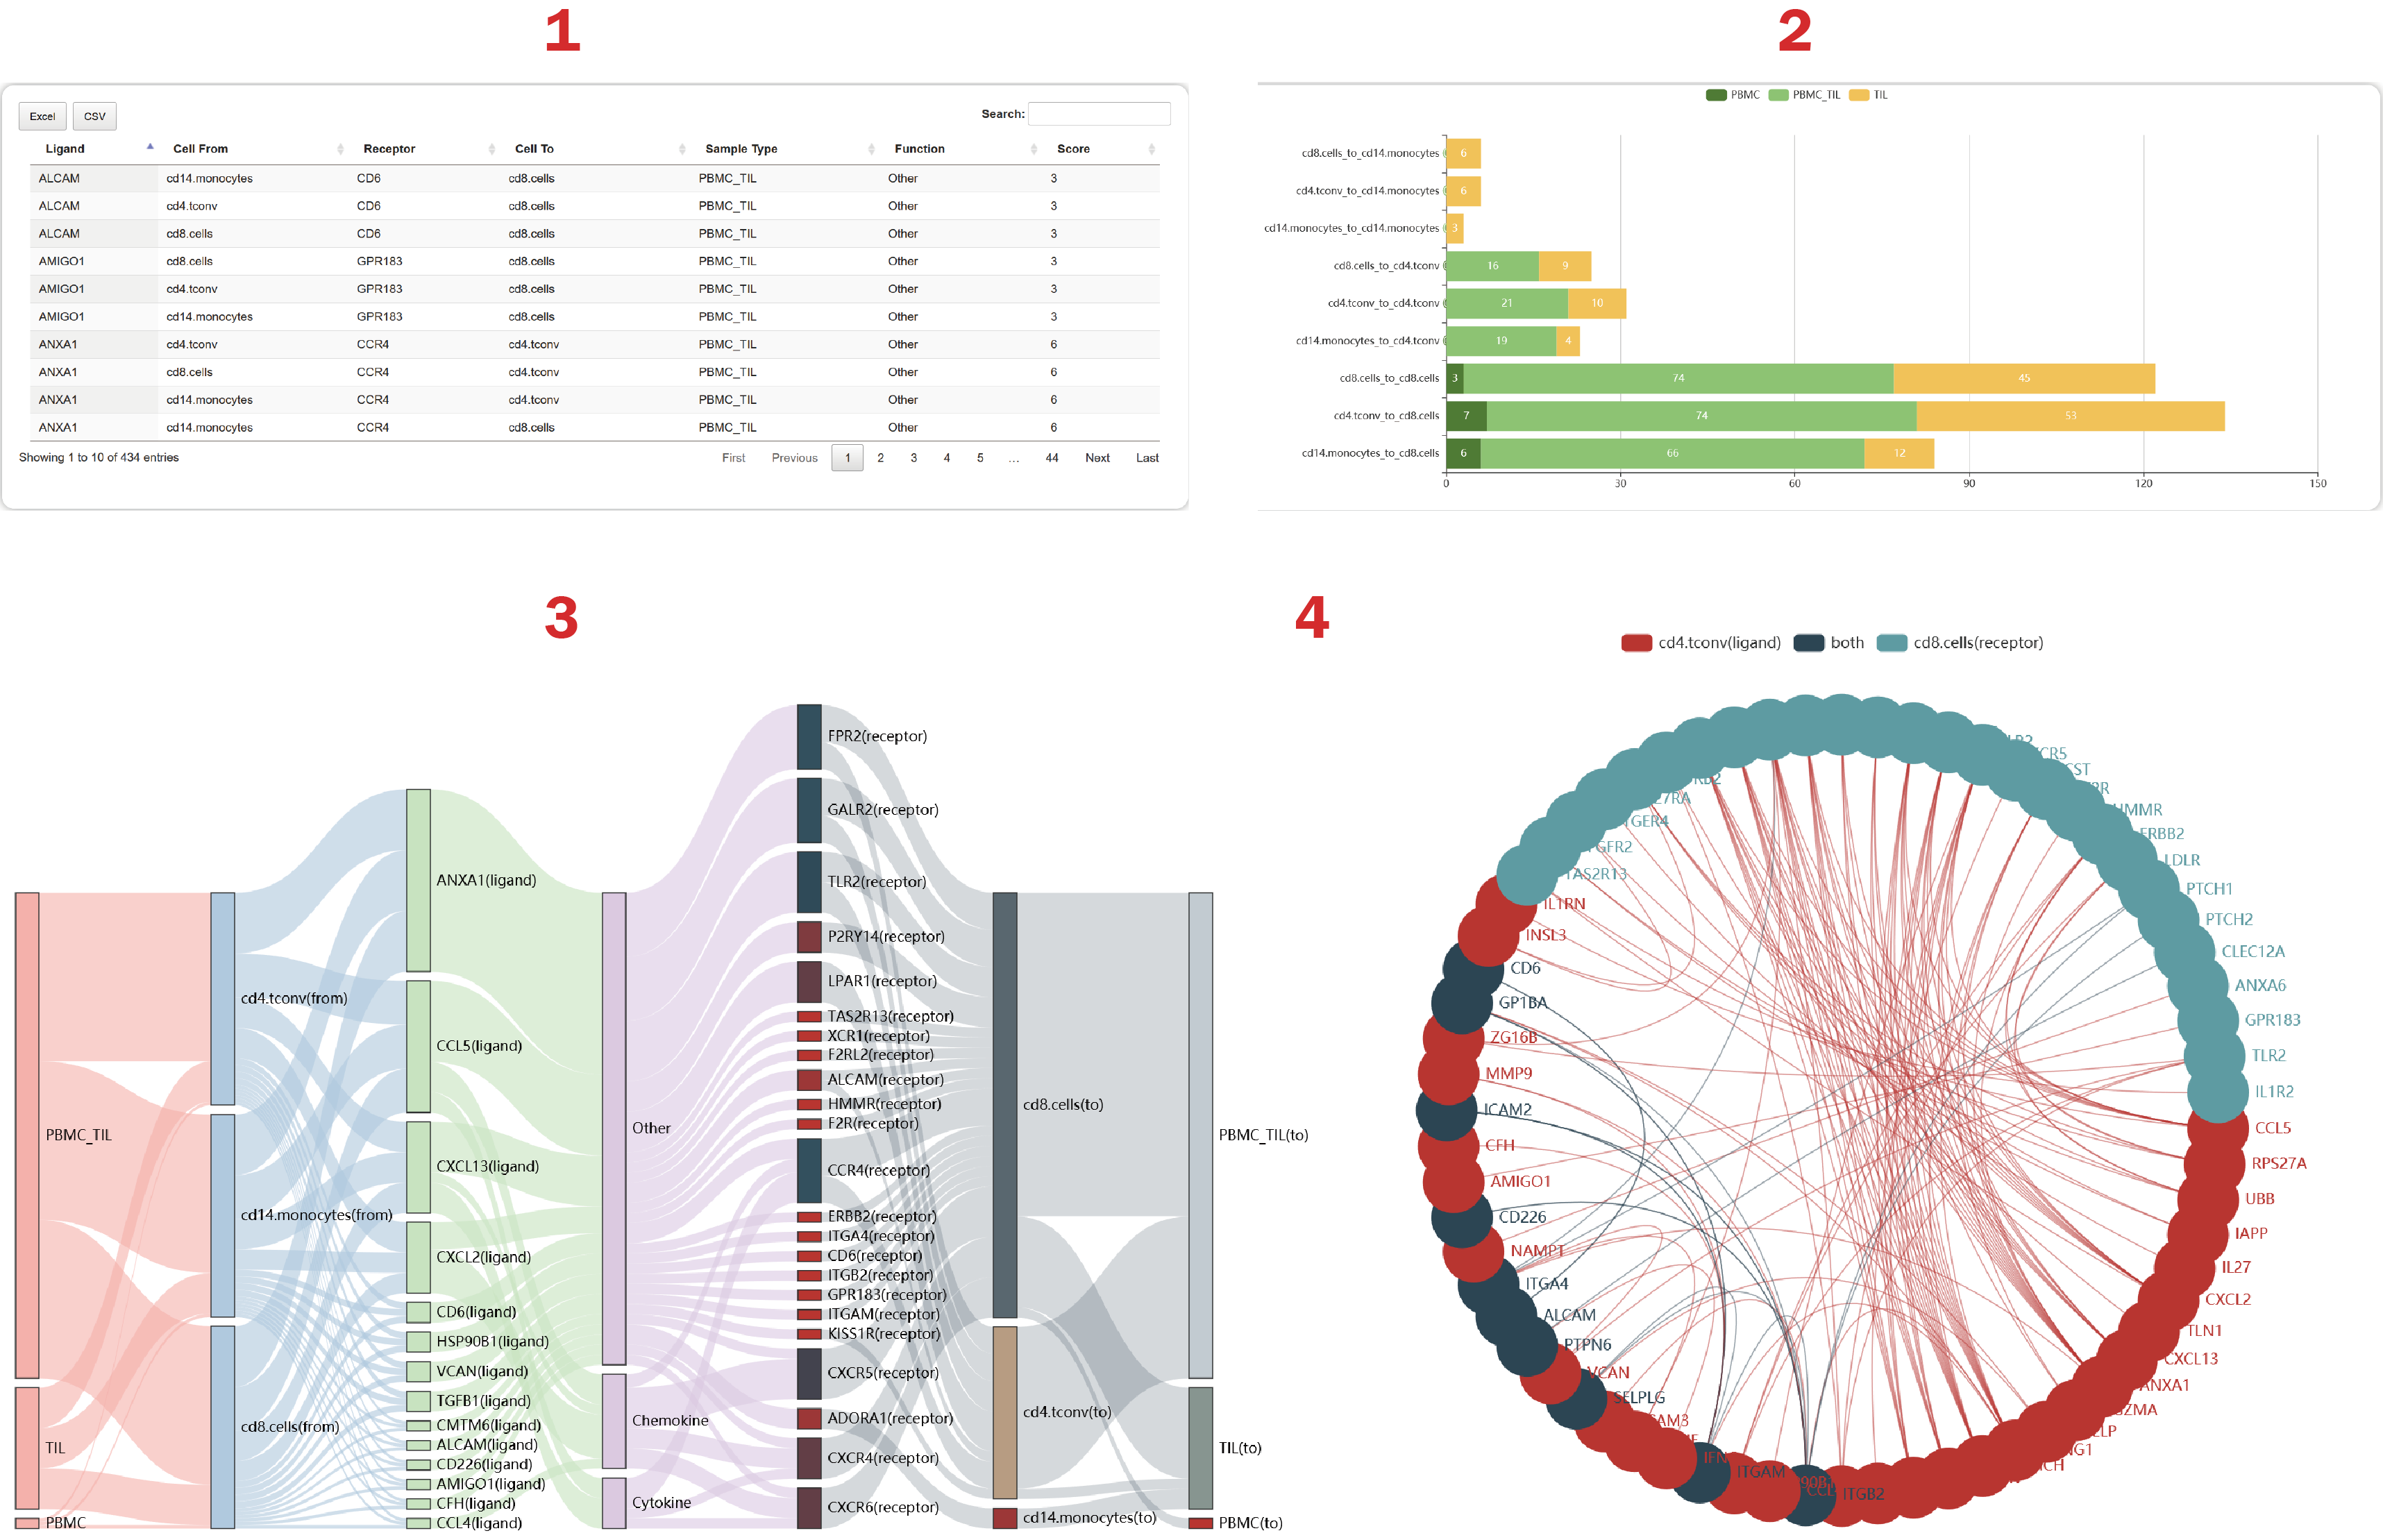
In the result page of CellTalker, users can get a summary of cell-cell interactions regulated by ligand-receptor pairs.
1. From the table, users can get sample types, functions and scores of identified consistently expressed ligands and receptors. The score is calculated as the number of cell-cell pairs mediated by a ligand-receptor interaction.
2. Users can get the number of L-R interactions contributing to each cell-cell pair.
3. Users can get 50 interactions sorted by the “score” at most.
4. Users can get a cell-cell crosstalk mediated by the most L-R interactions.
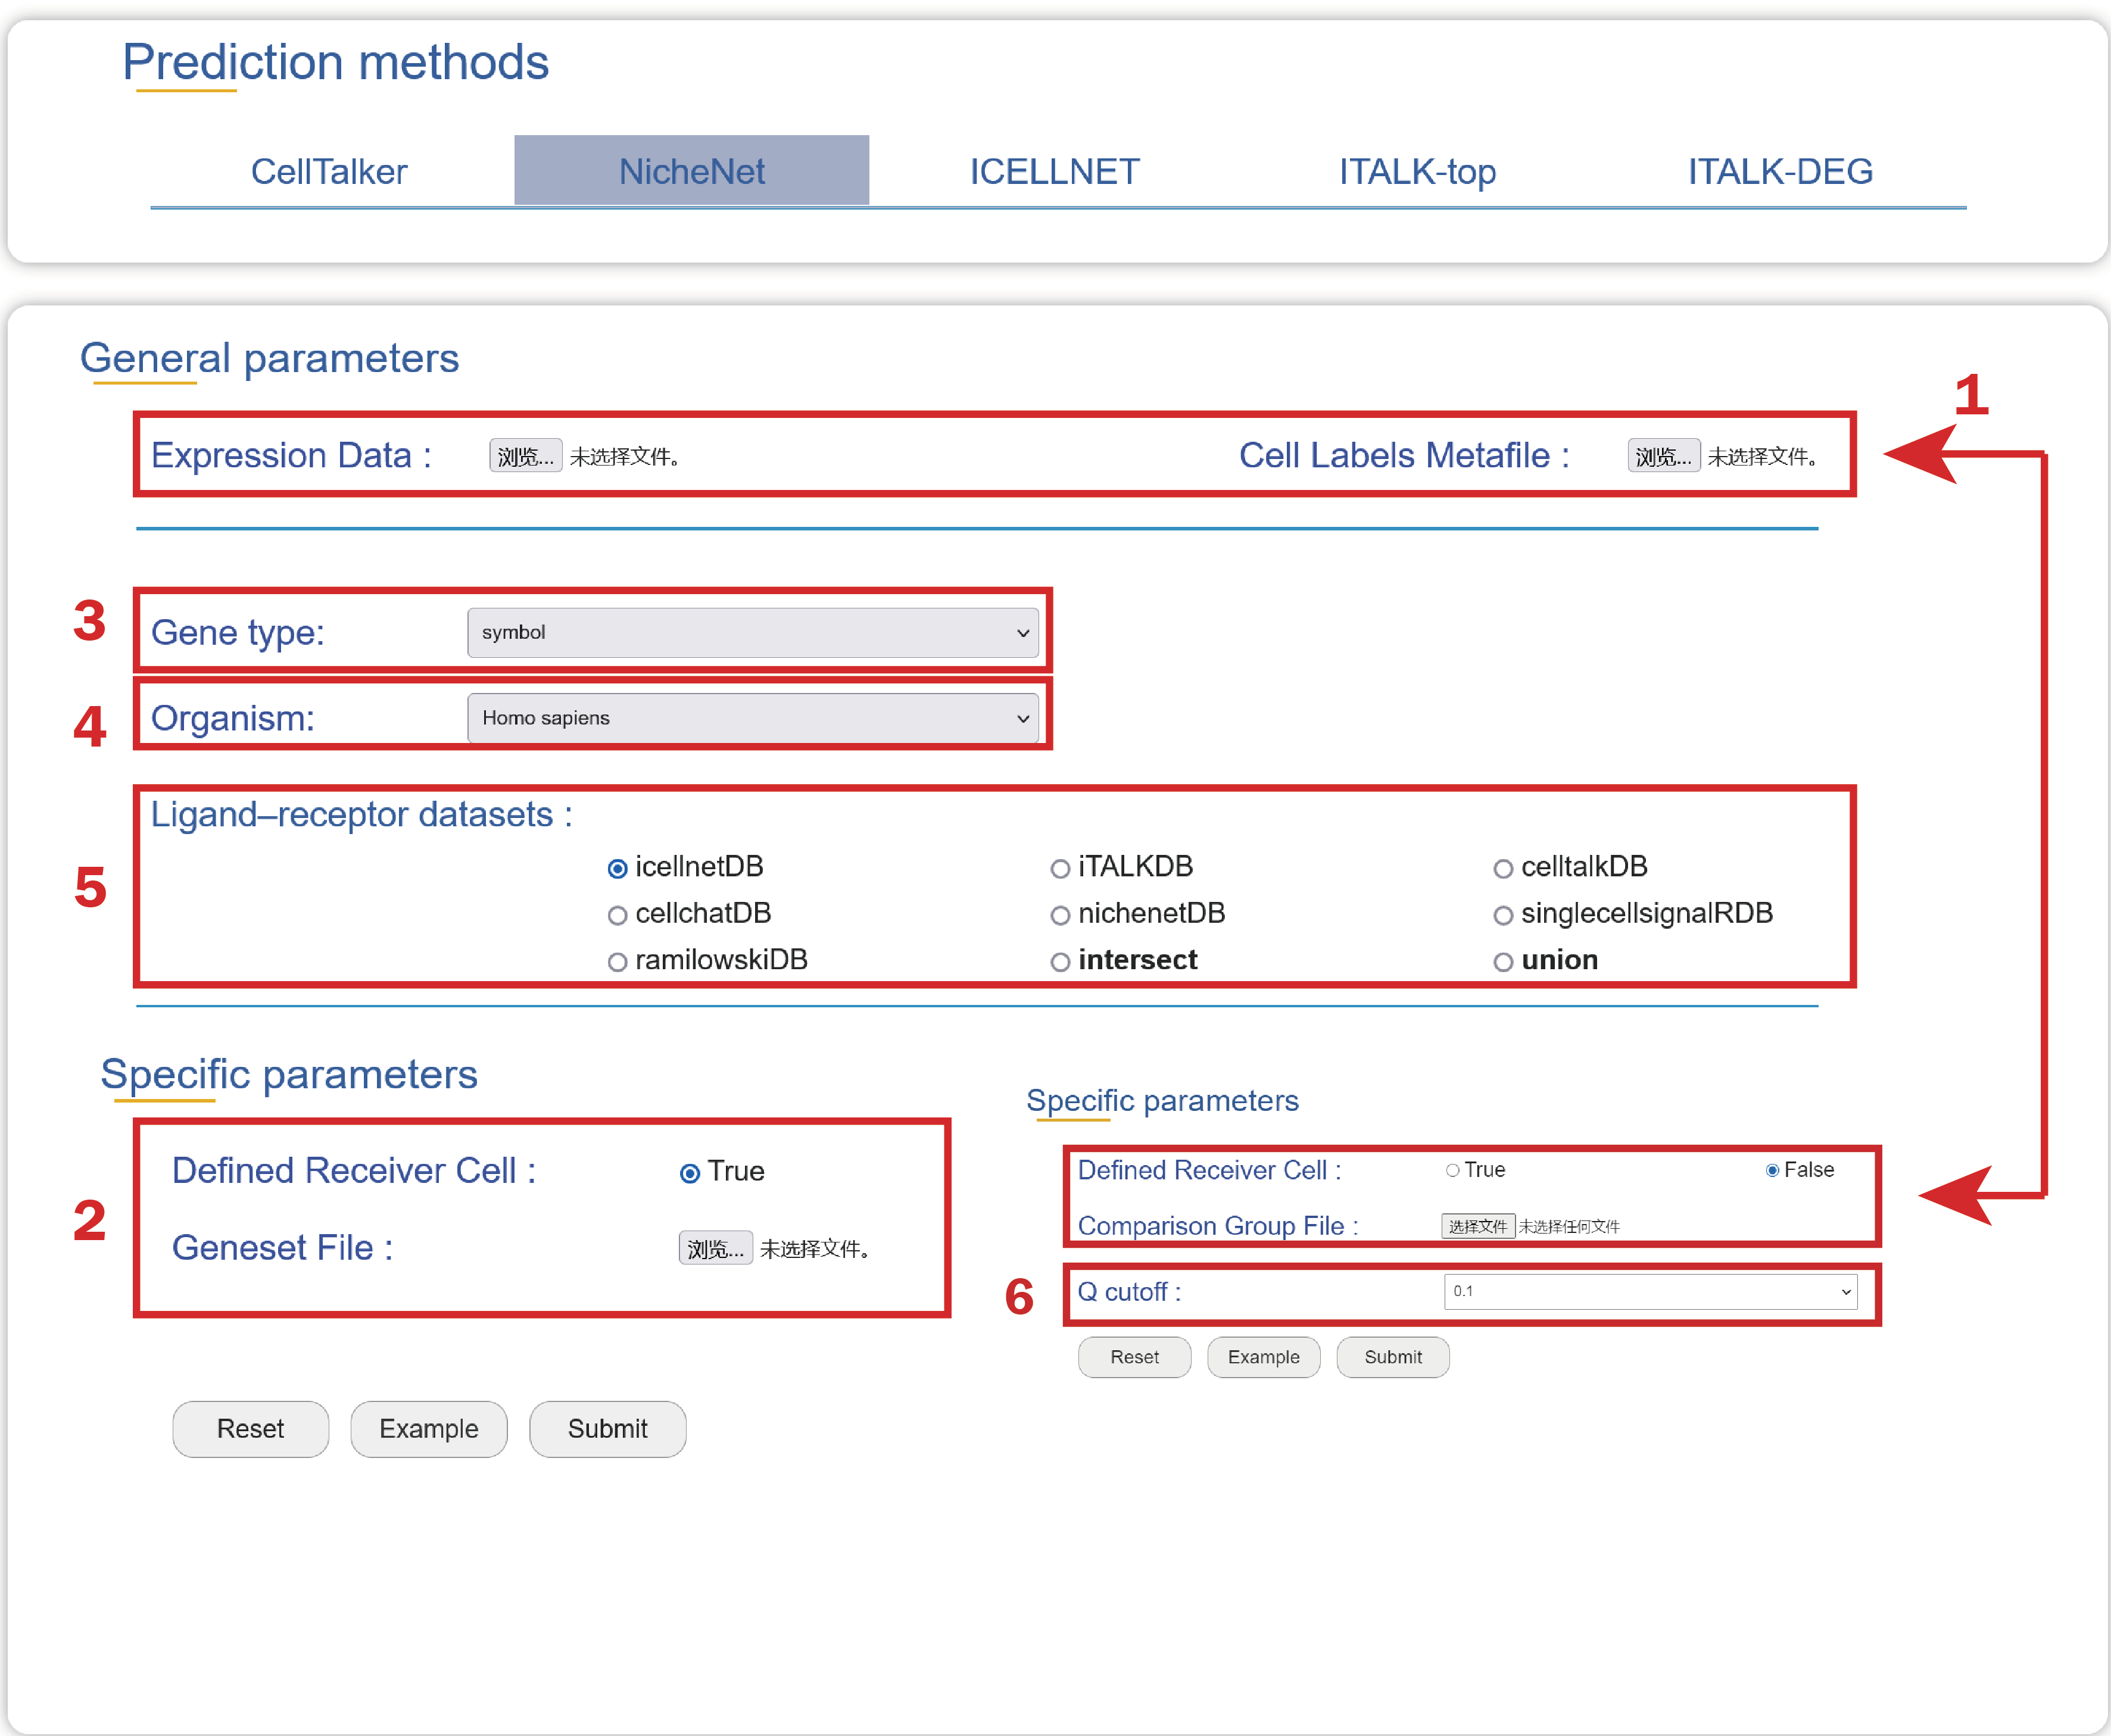
1. Upload an Expression Data, a Cell Labels Metafile without defining receiver cells, a Comparison Group File used to identify differentially expressed genes influenced by ligands.
2. Or upload an Expression Data, a Cell Labels Metafile with a column named “class” containing “receiver cell” or “sender cell” to define signal path, a Genesets File containing your interesting genes may be influenced by ligands.
3. Choose a type of gene ids used in your data.
4. Choose an organism that is consistent with your data source.
5. Choose a ligand-receptor dataset as the background to depict cell-cell communications.
6. Choose a q value to filter significant differentially expressed genes between comparable groups.
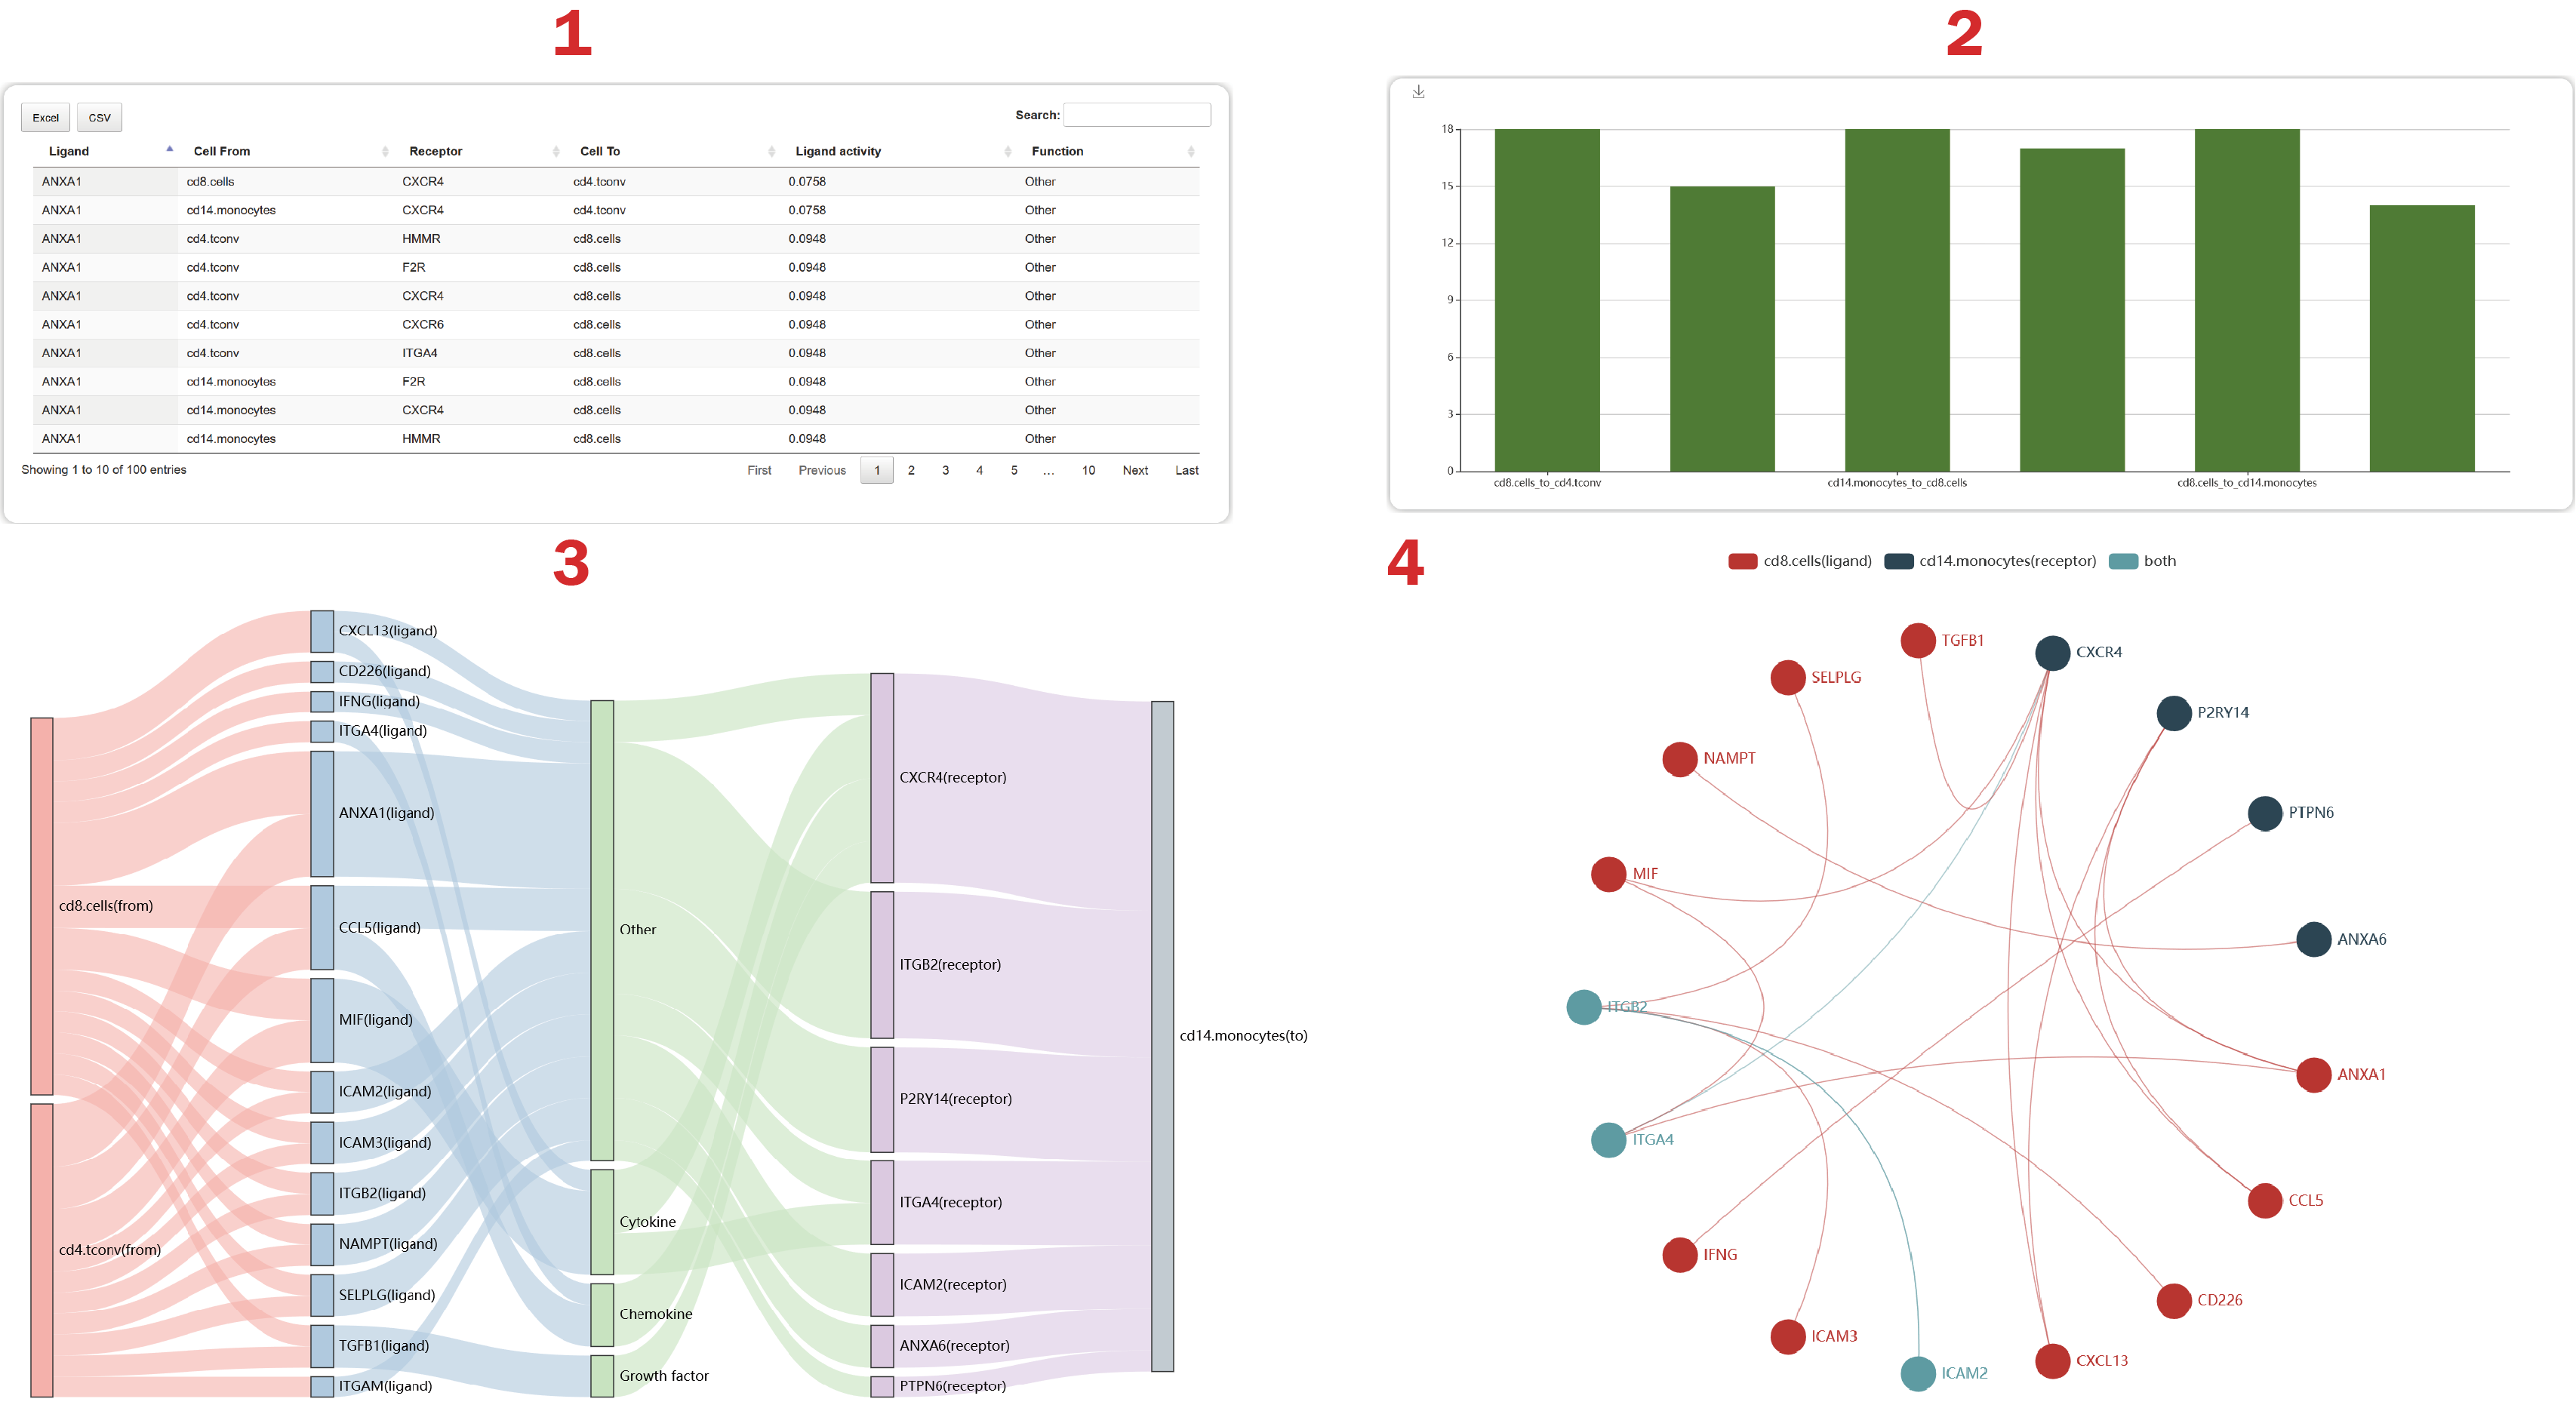
In the result page of NicheNet, users can obtain a landscape of cell-cell crosstalk mediated by ligand-receptor interactions from four aspects.
1. From the table, users can obtain functions and ligand activities (pearson coefficients) defined by “NicheNet” of these gene pairs.
2. Users can get the number of L-R interactions regulating each cell-cell pair.
3. Users can see 50 interactions regulated by the ligands with high “Ligand activity” at most.
4. Users can get a cell-cell crosstalk mediated by the most L-R interactions.
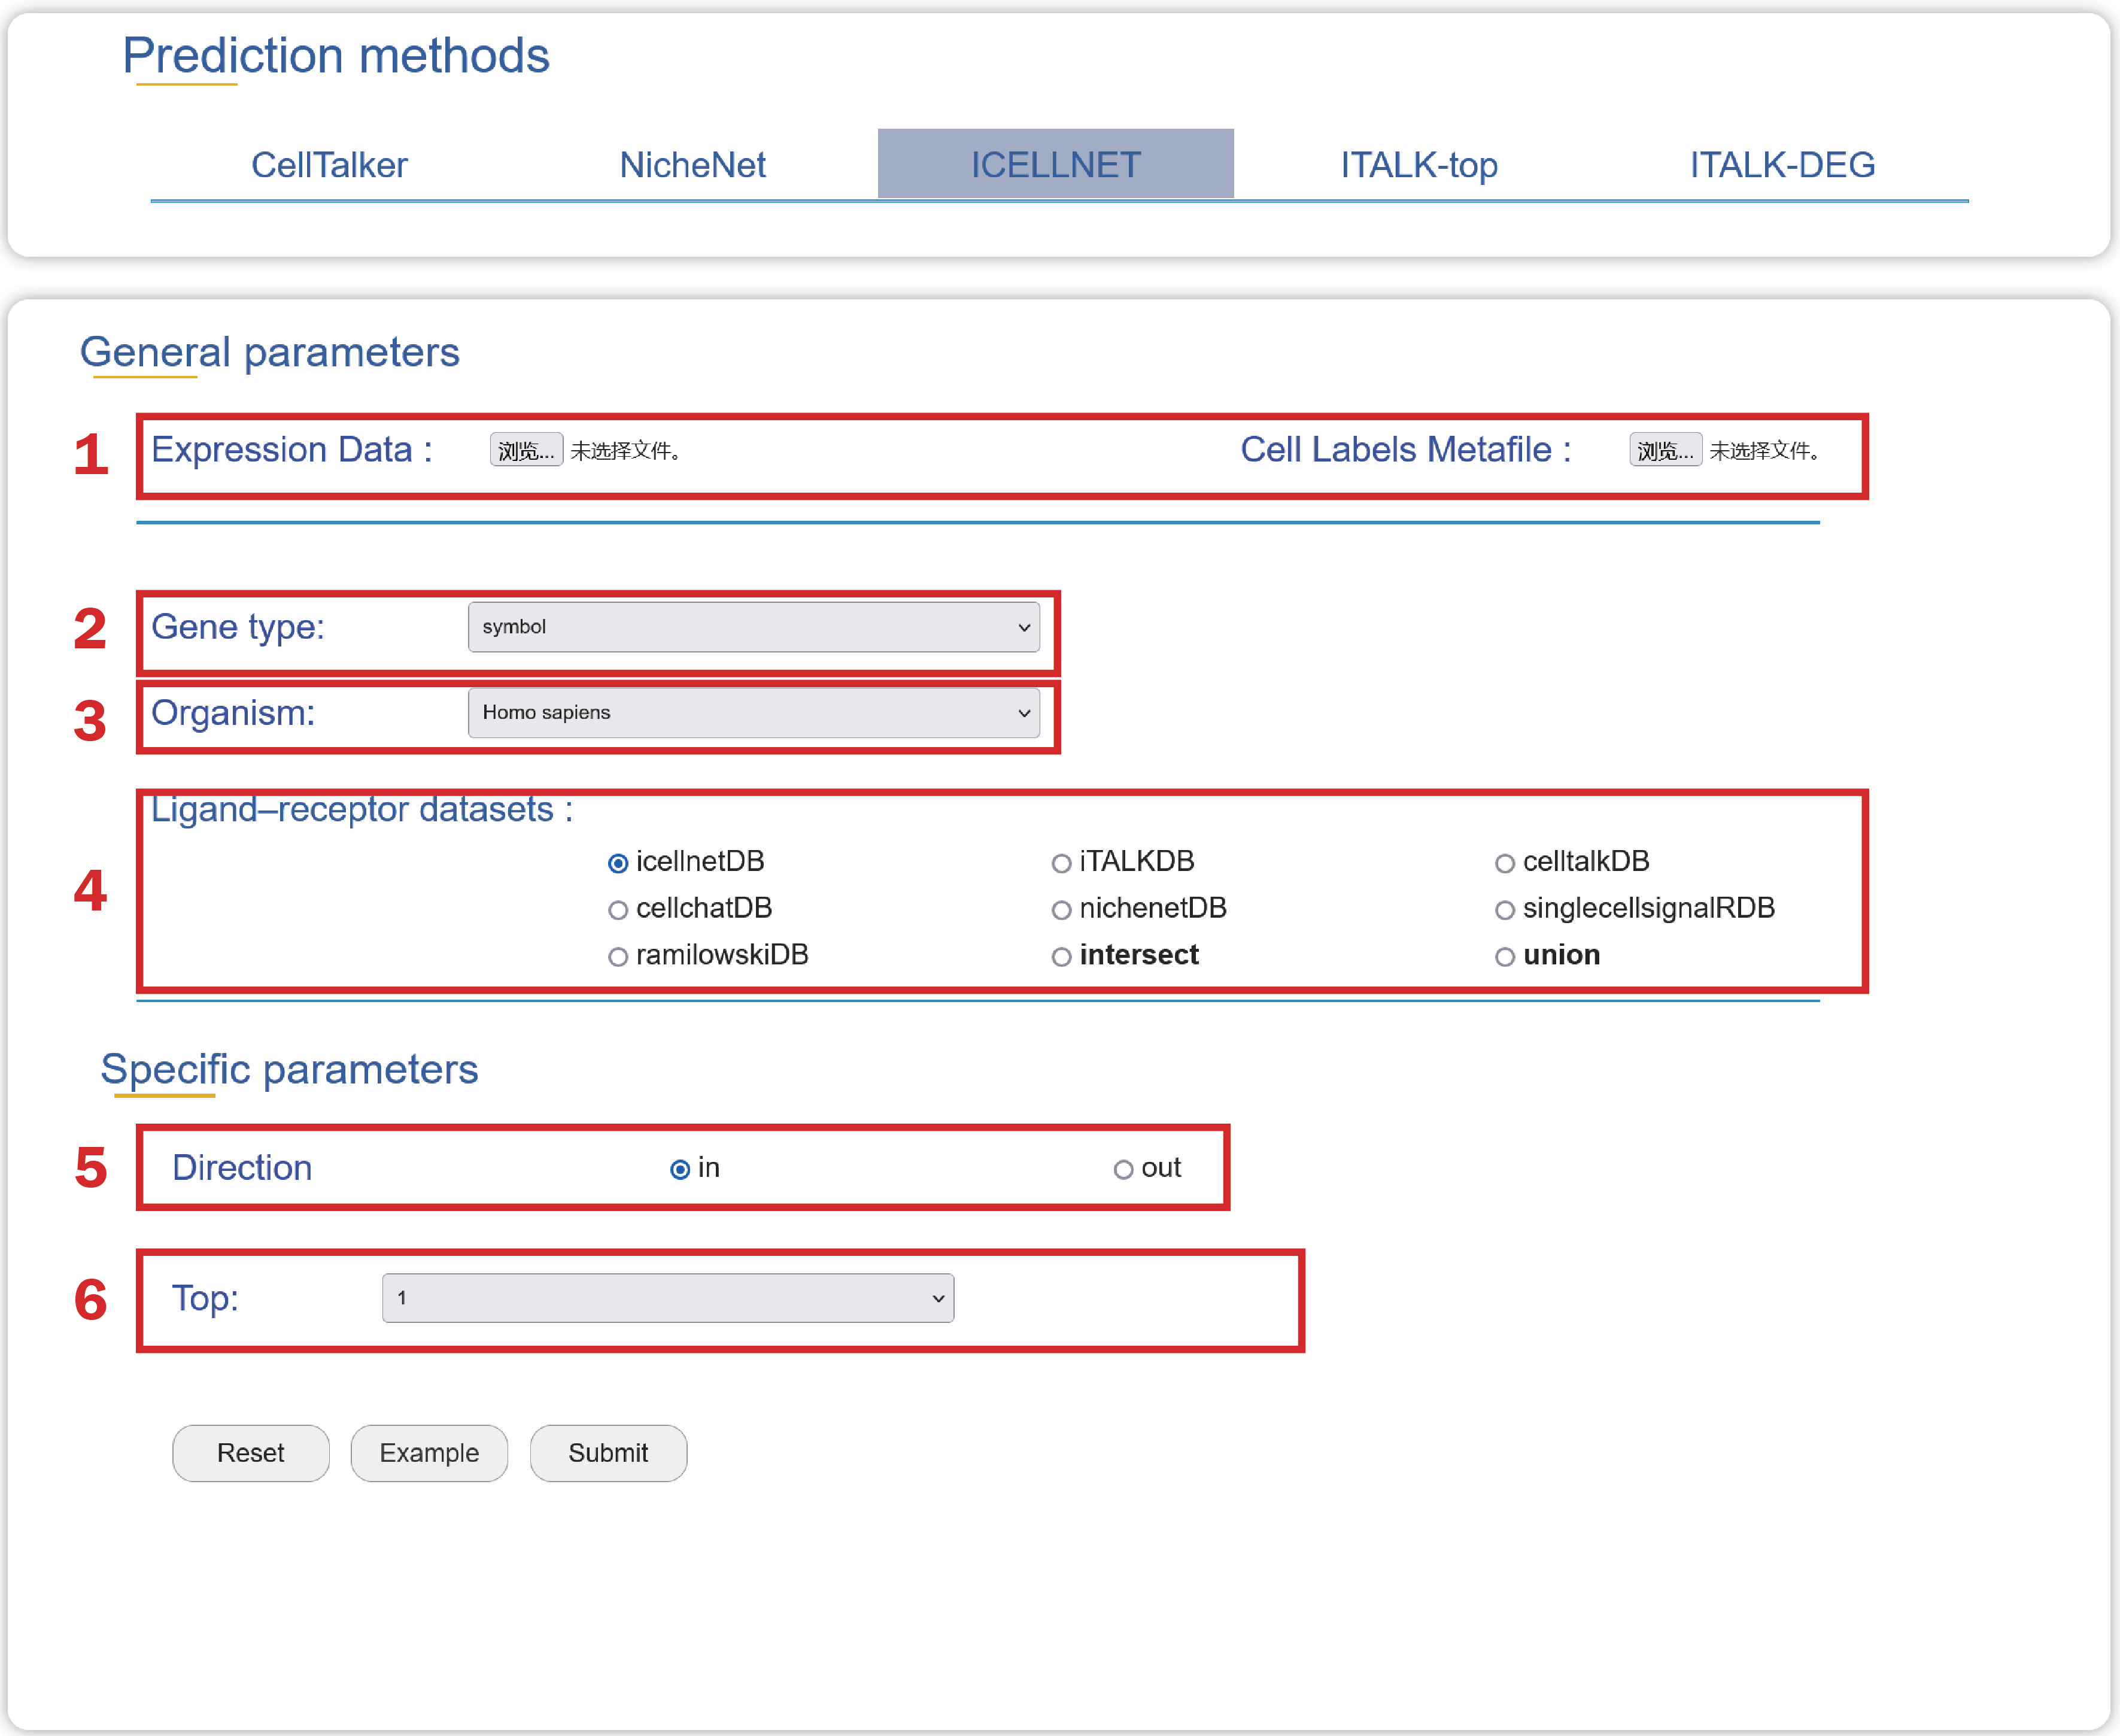
1. Upload an Expression Data, a Cell Labels Metafile with two columns named “cell” and “cell_type”.
2. Choose a type of gene ids in your data.
3. Choose an organism that is consistent with your data source
4. Choose a ligand-receptor dataset which can be used to predict cell-cell crosstalk.
5. Choose a direction of the communication.
6. Choose a number of highest expression values to define the maximum value of expression for scaling the expression value.
In the result page of ICELLNET, users can obtain cell-cell communications mediated by ligand-receptor interactions.
1. Users can see a table containing functions, scores of ligand-receptor interactions. The score is calculated as an expression product defined by “ICELLNET”. Users can also get an overview of global scores between any two cell-cell pairs calculated as the summary of ligand-receptor interactions
2. Users can get the number of L-R interactions regulating each cell-cell pair.
3. Users can get a riverplot which shows 50 interactions sorted by the “score” at most.
4. Users can get a cell-cell crosstalk mediated by the most L-R interactions.
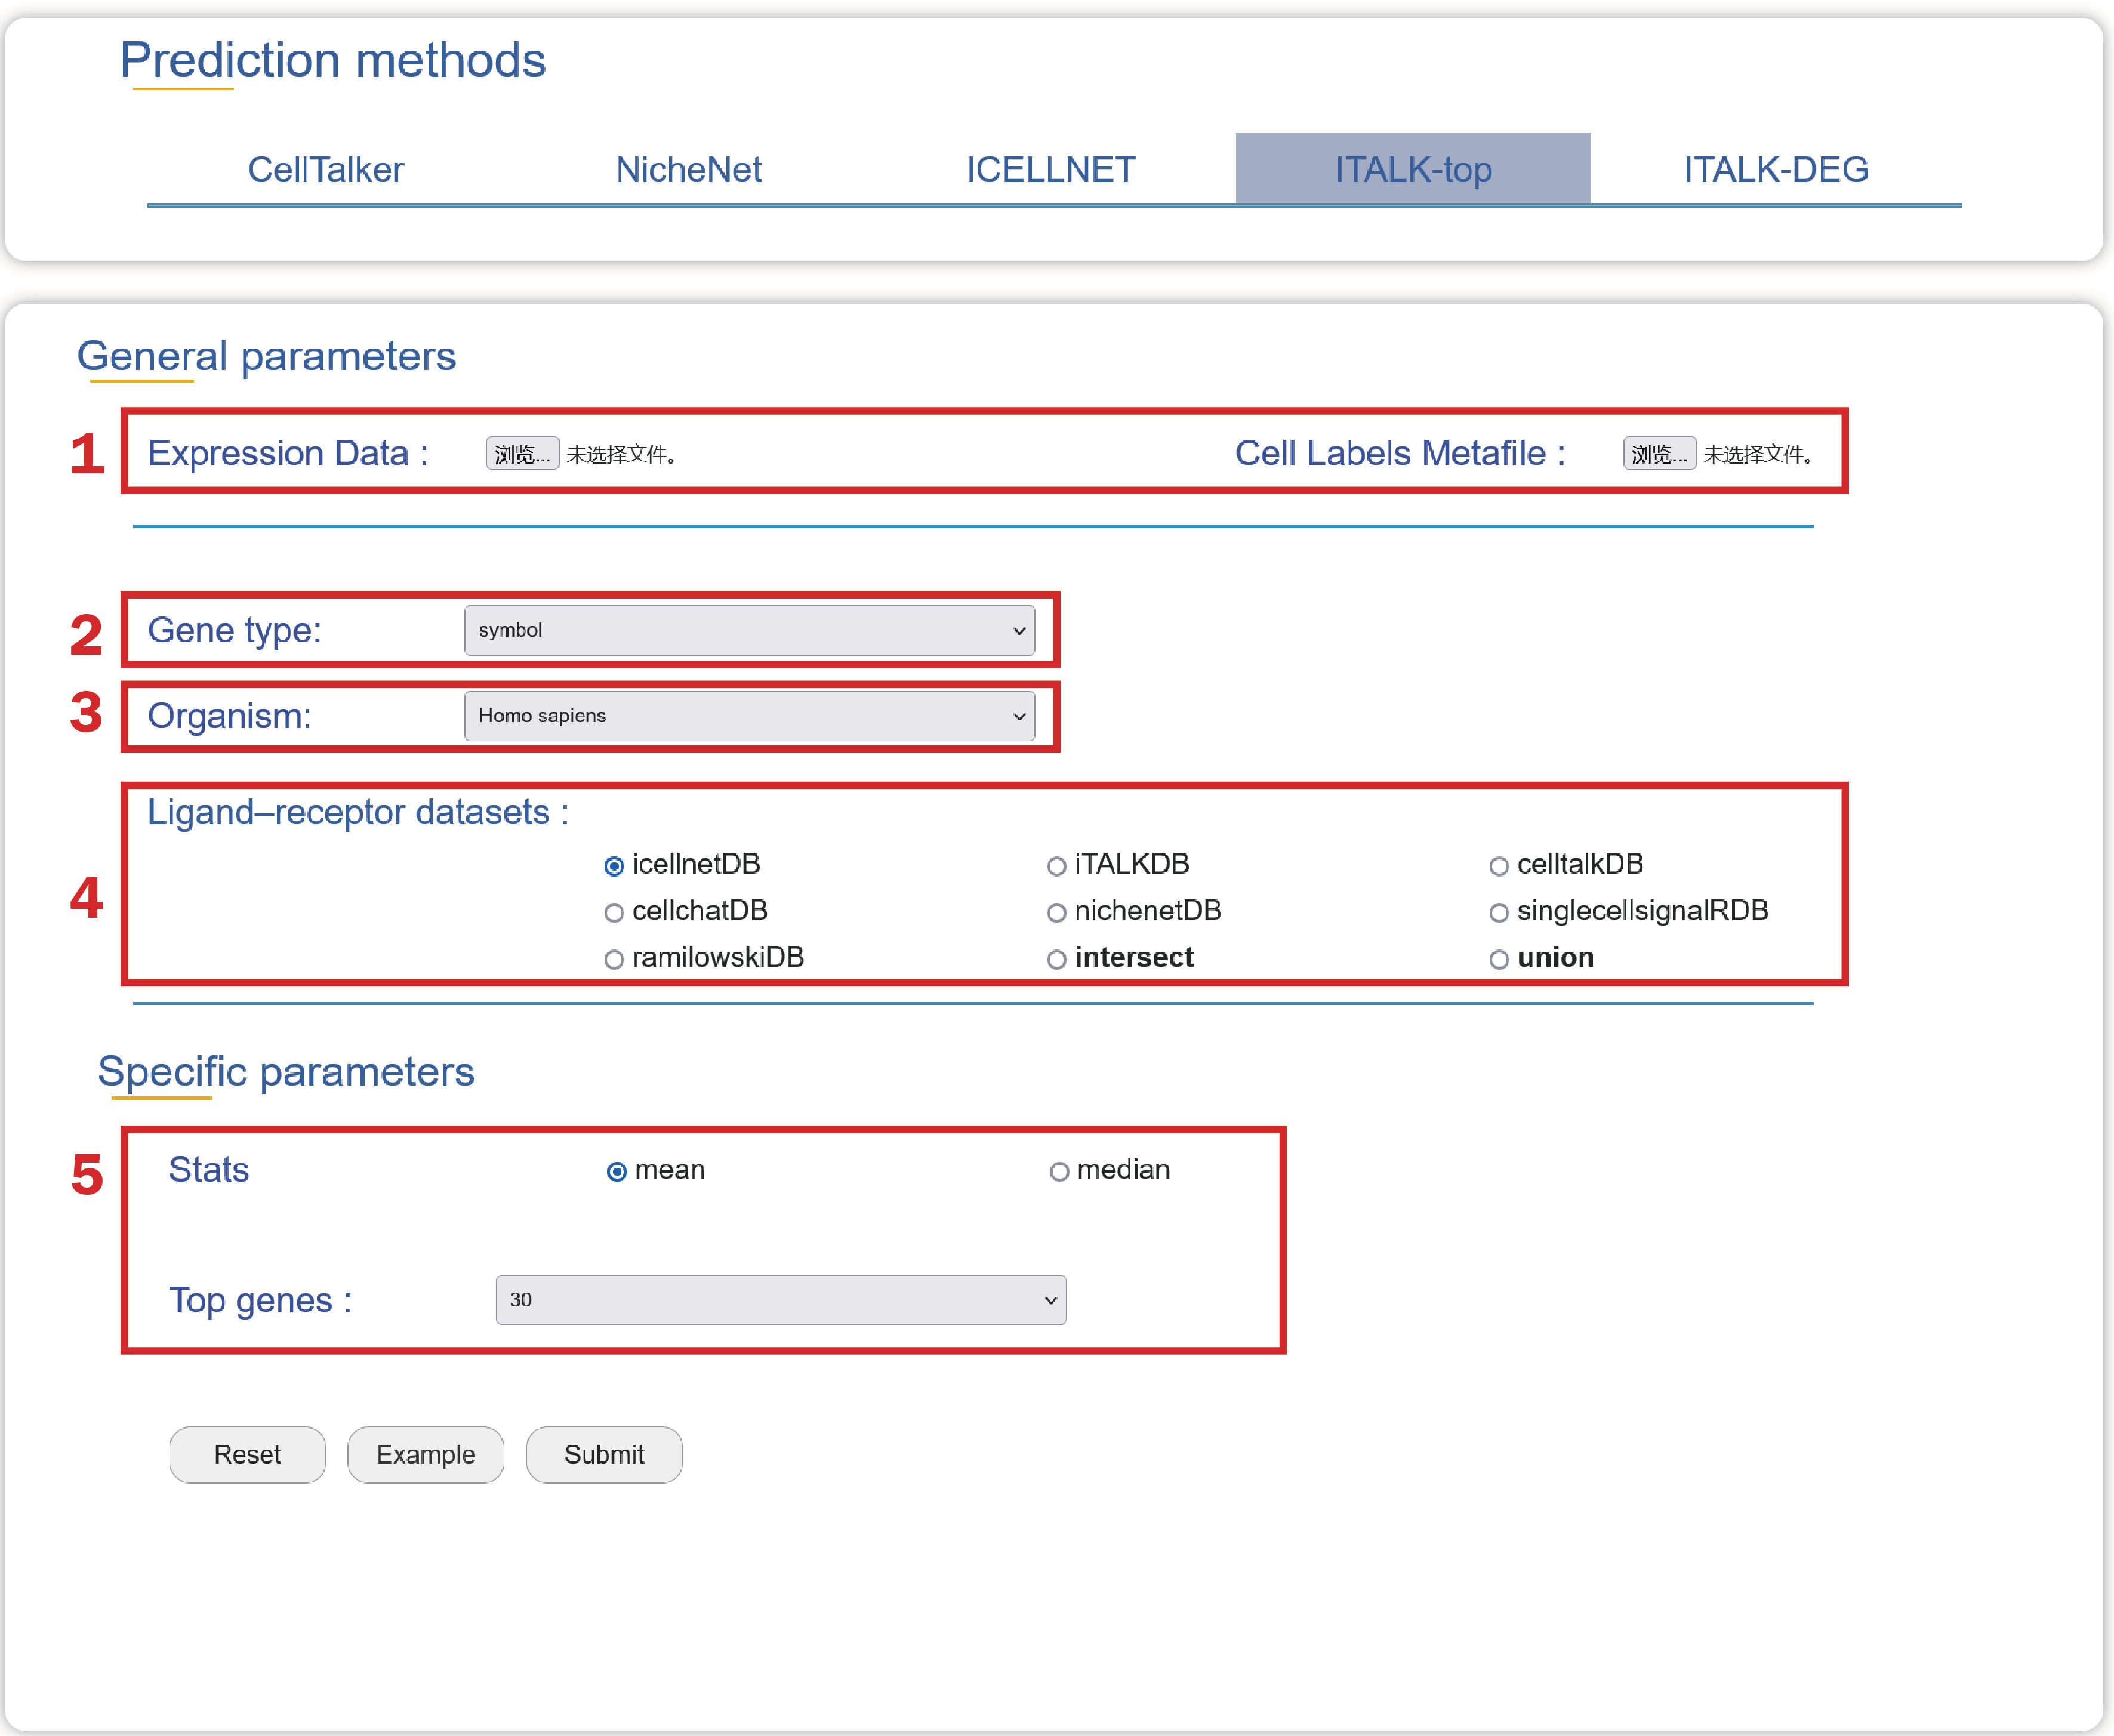
1. Upload an Expression Data and a Cell Labels Metafile with two columns named “cell” and “cell_type” in compliance with the format.
2. Choose a type of gene ids in your Expression Data.
3. Select an organism that you are interested in.
4. Select a ligand-receptor dataset as the background dataset to predict cell-cell crosstalk.
5. Select a method for parsing the data to get top n expressed genes.
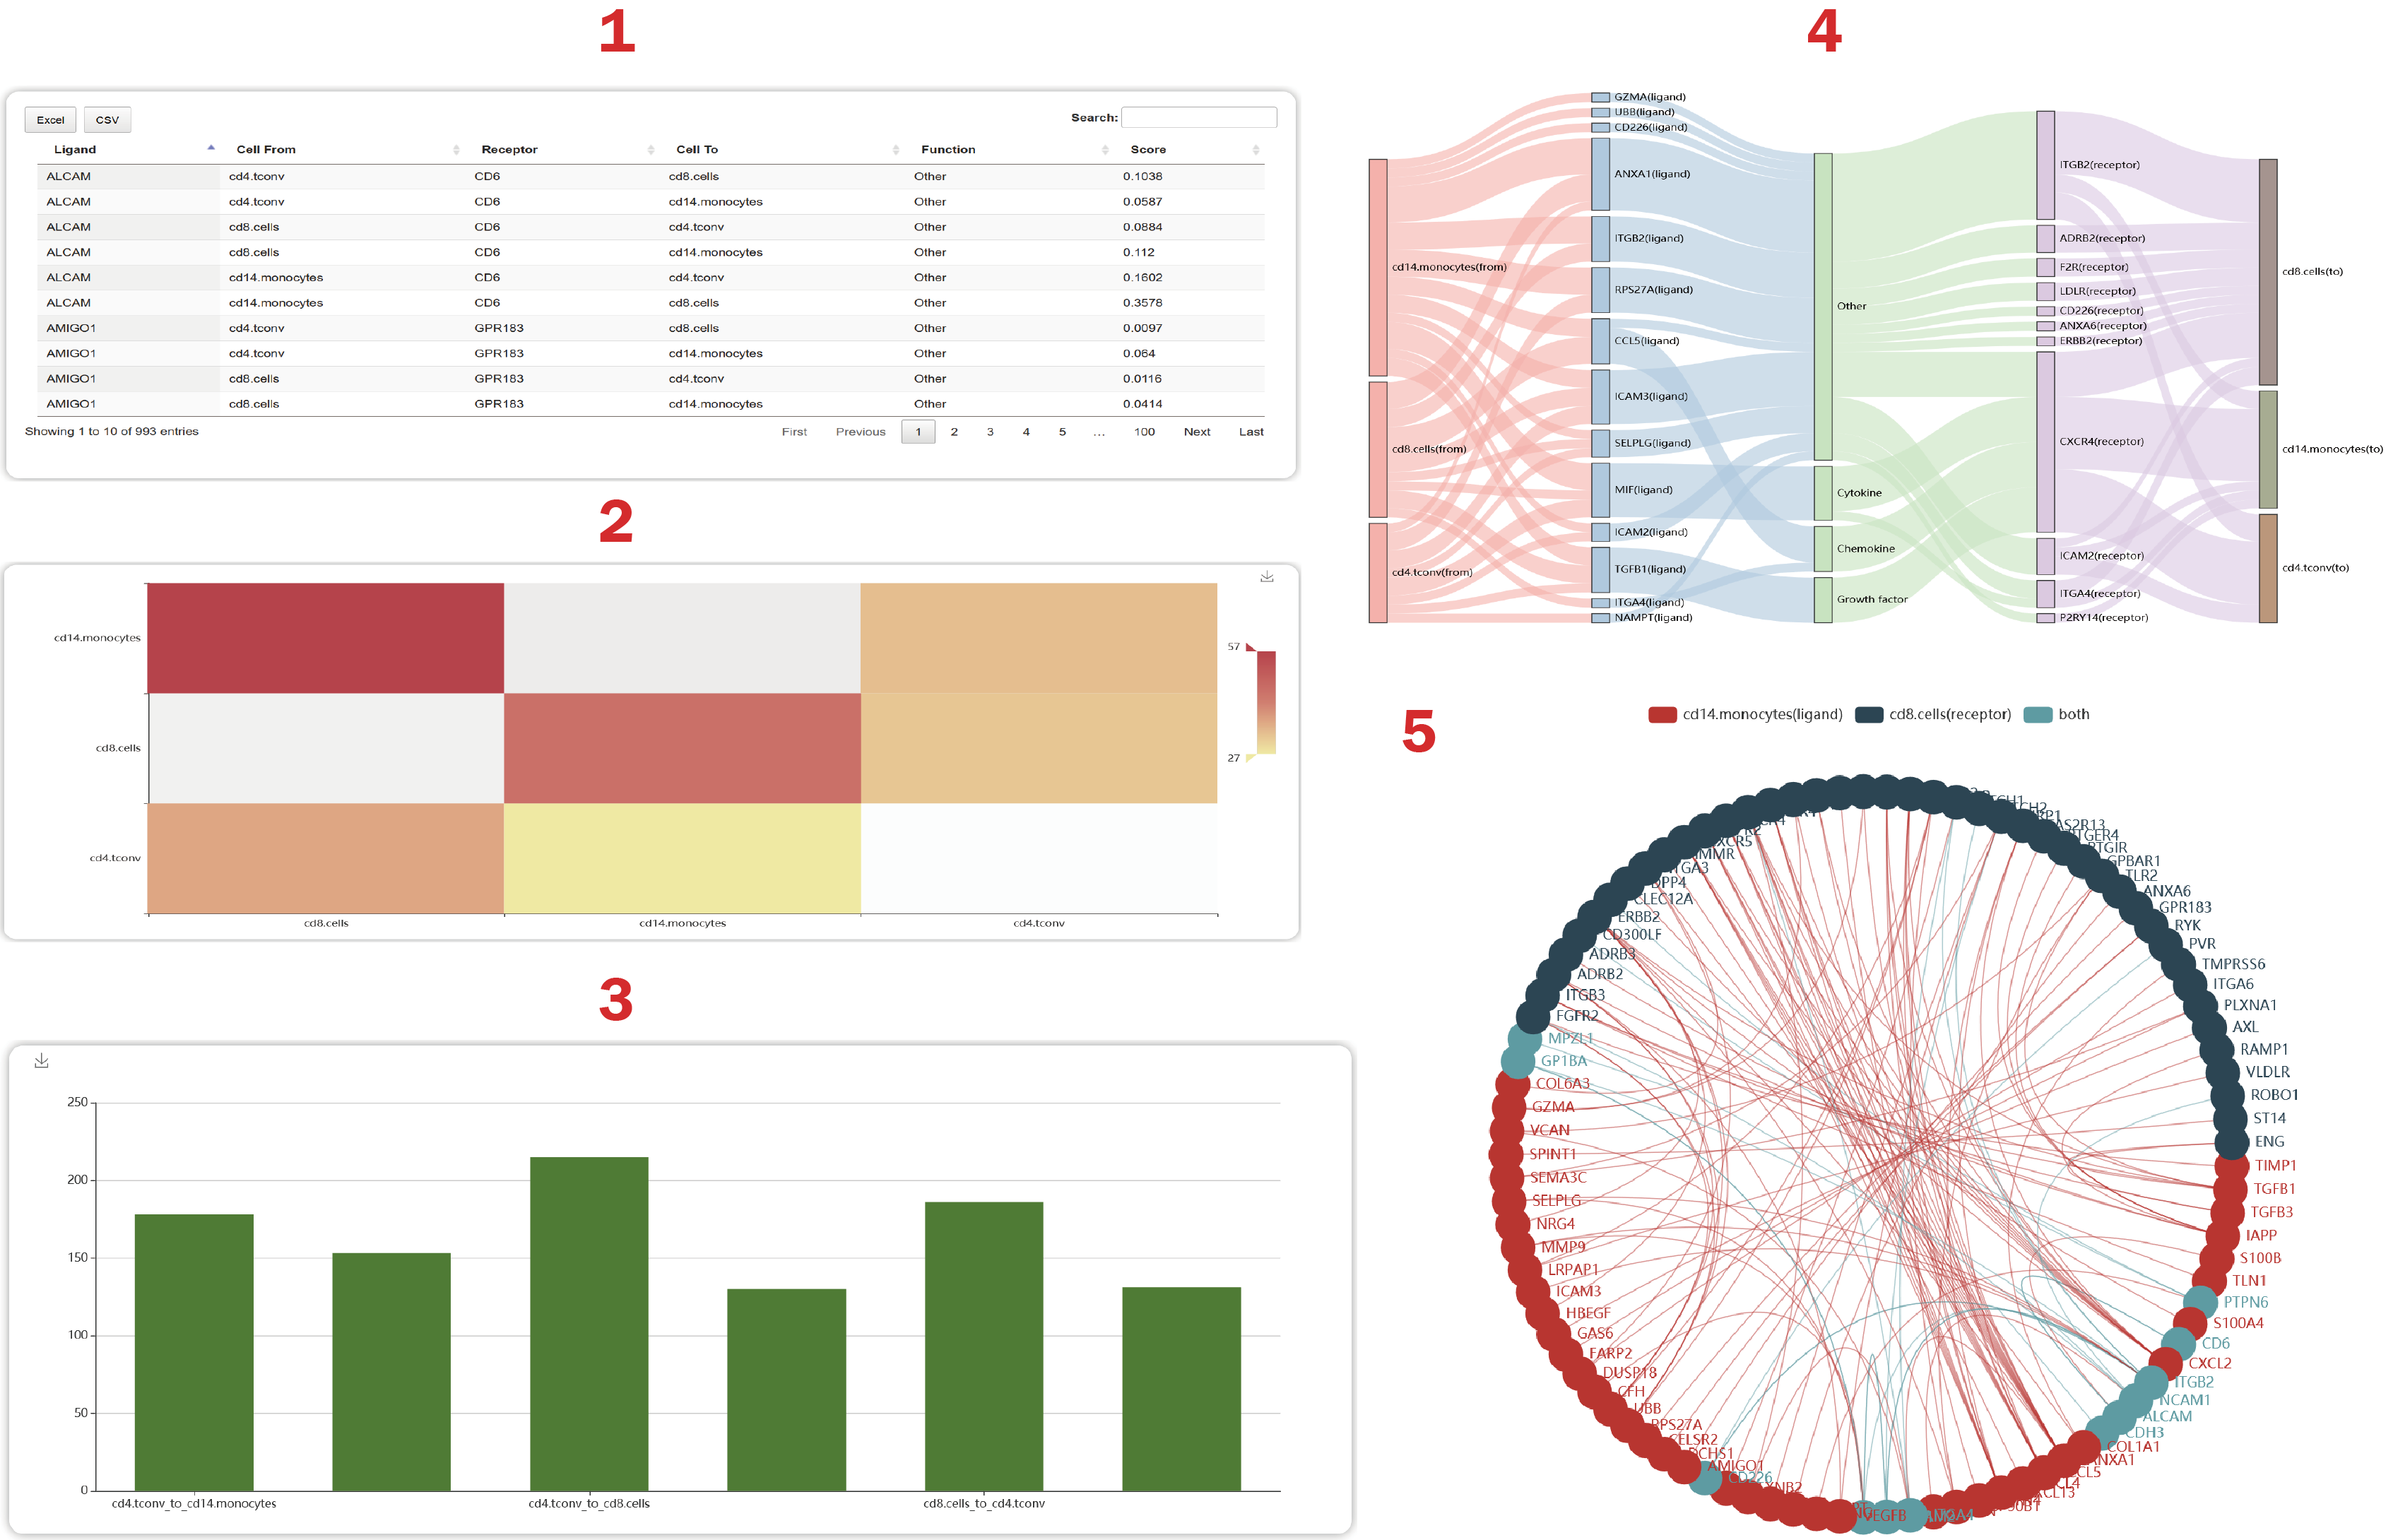
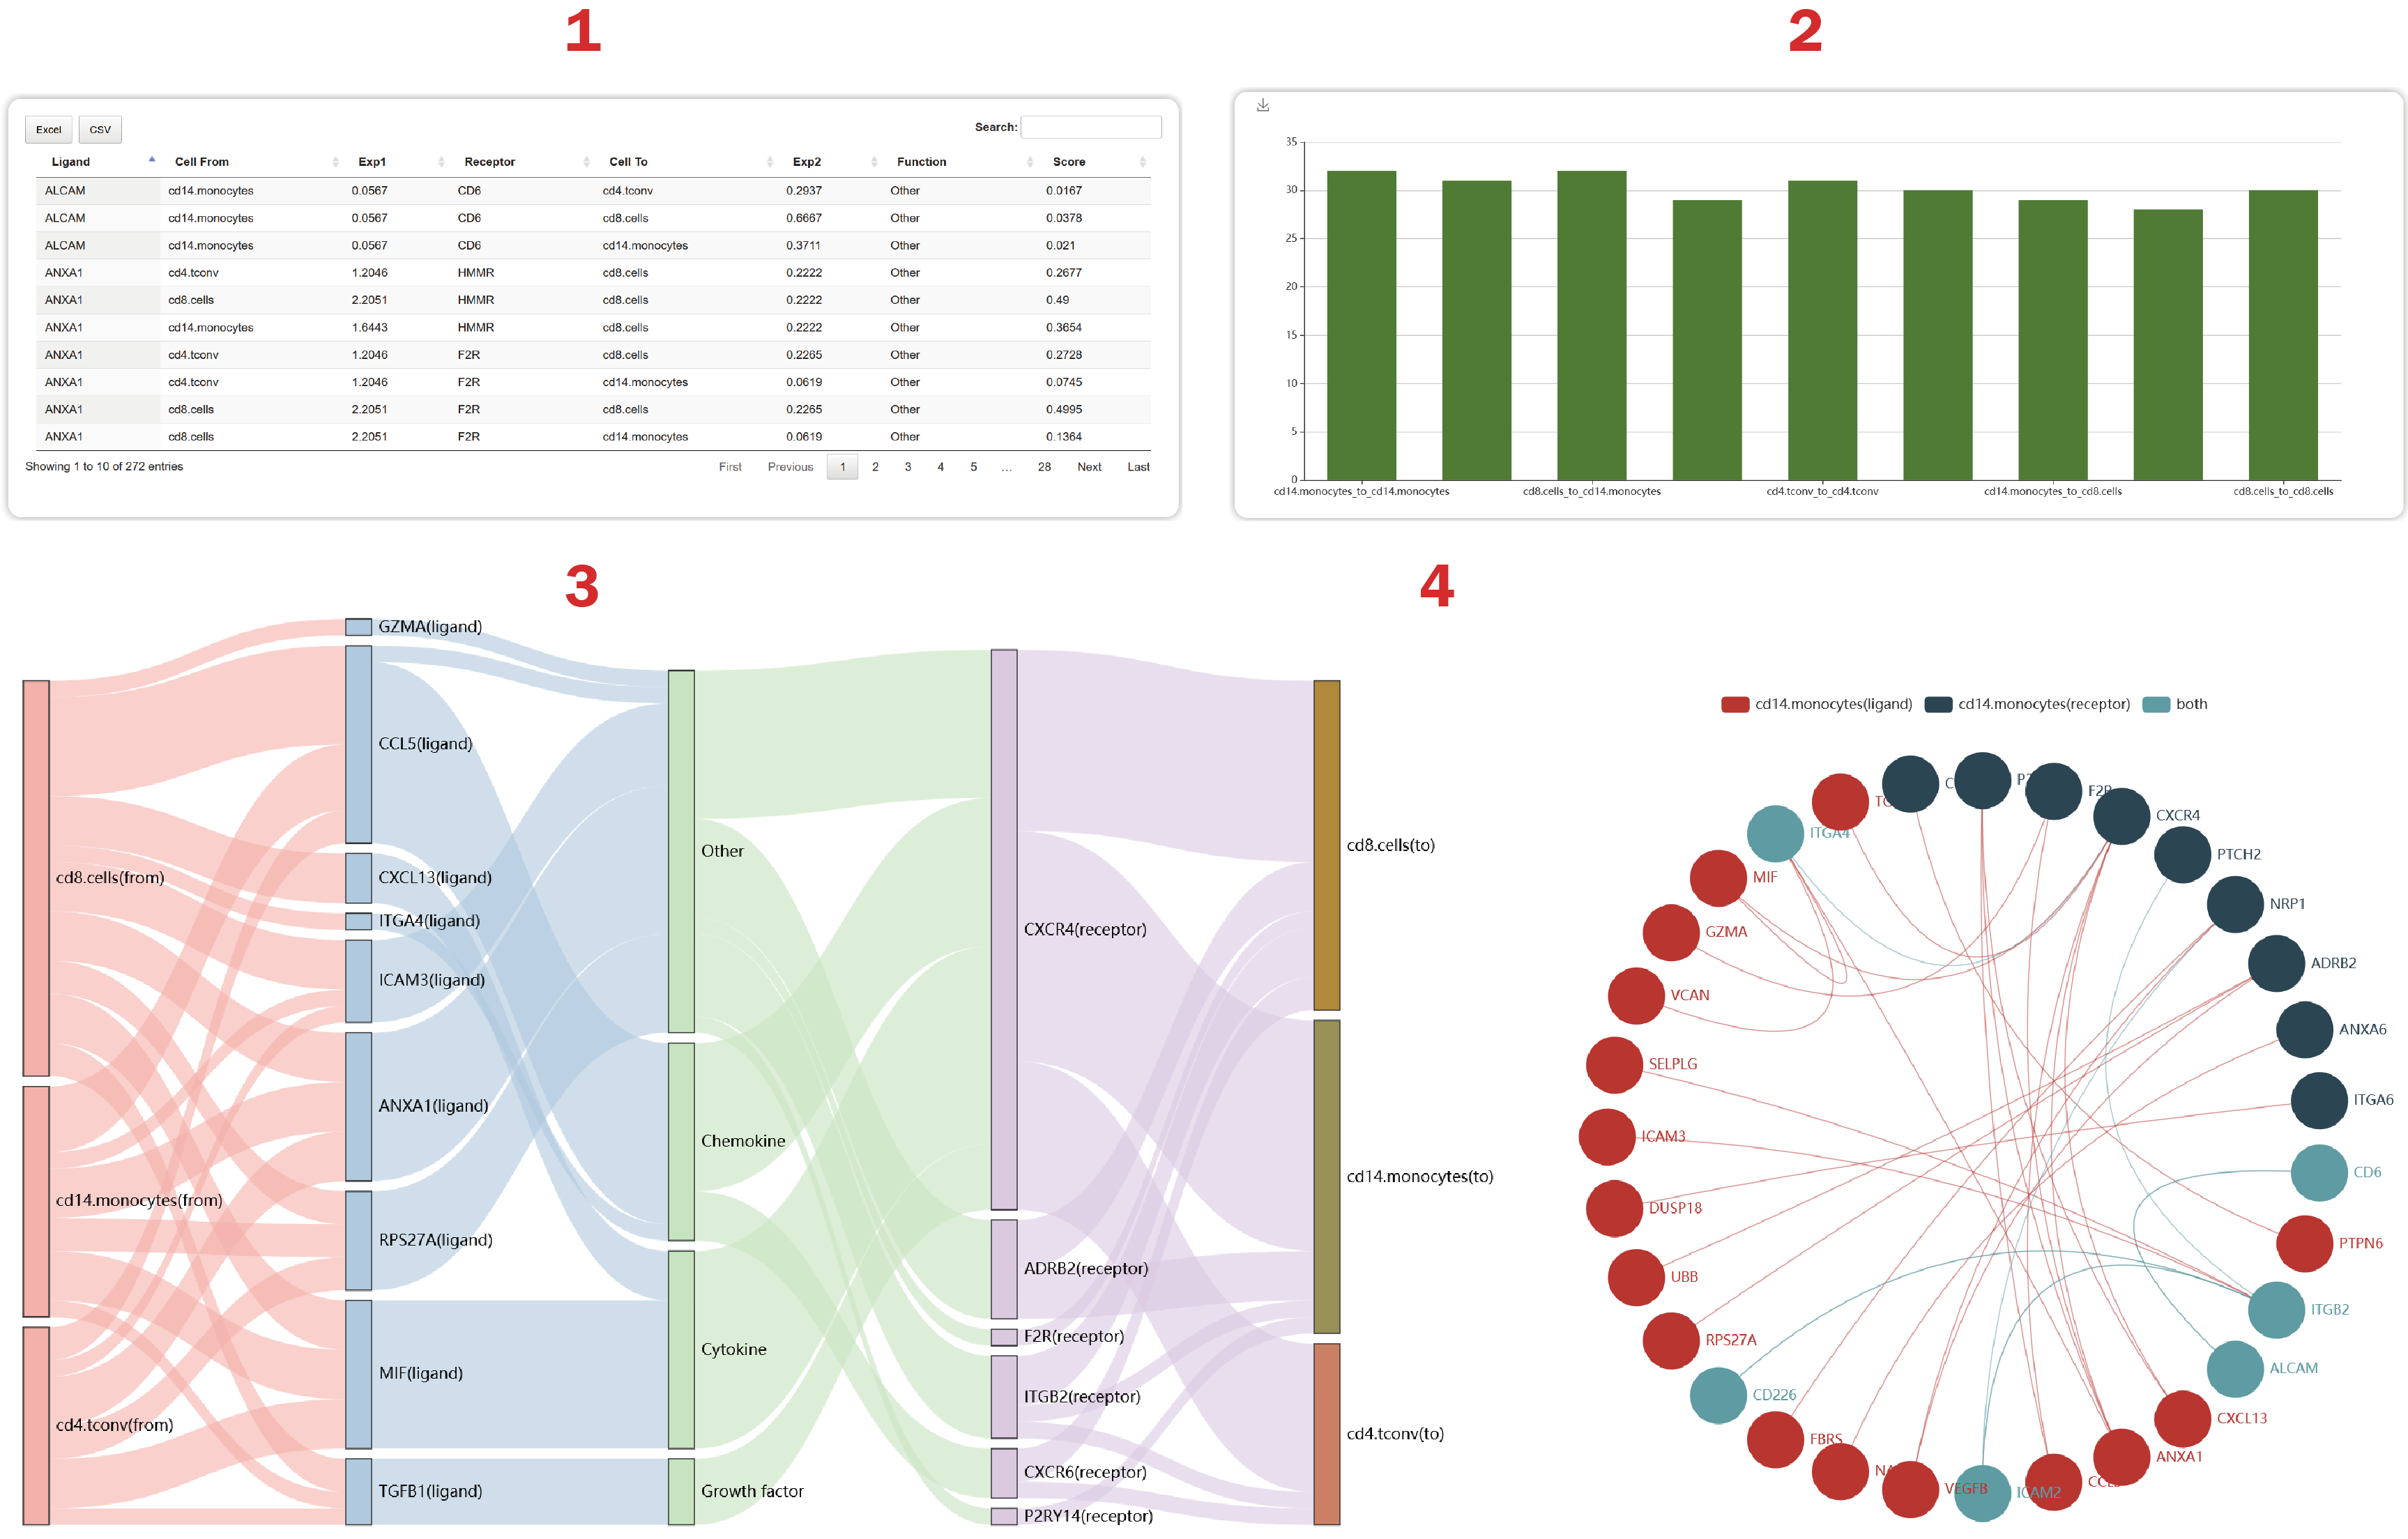
In the result page of ITALK-top, intercellular communication signals can be illustrated from four aspects.
1. From the table below, Users can get the expression feature, functions and scores of these gene pairs mediating cell-cell crosstalk. The score is calculated as expression value product between a ligand in a cell type and a receptor in another cell type.
2. Users can get a summary of the number of L-R interactions regulating each cell-cell pair.
3. Users can obtain 50 strong interacting pairs sorted by the “score” at most.
4. Users can get a cell-cell crosstalk mediated by the most L-R interactions.
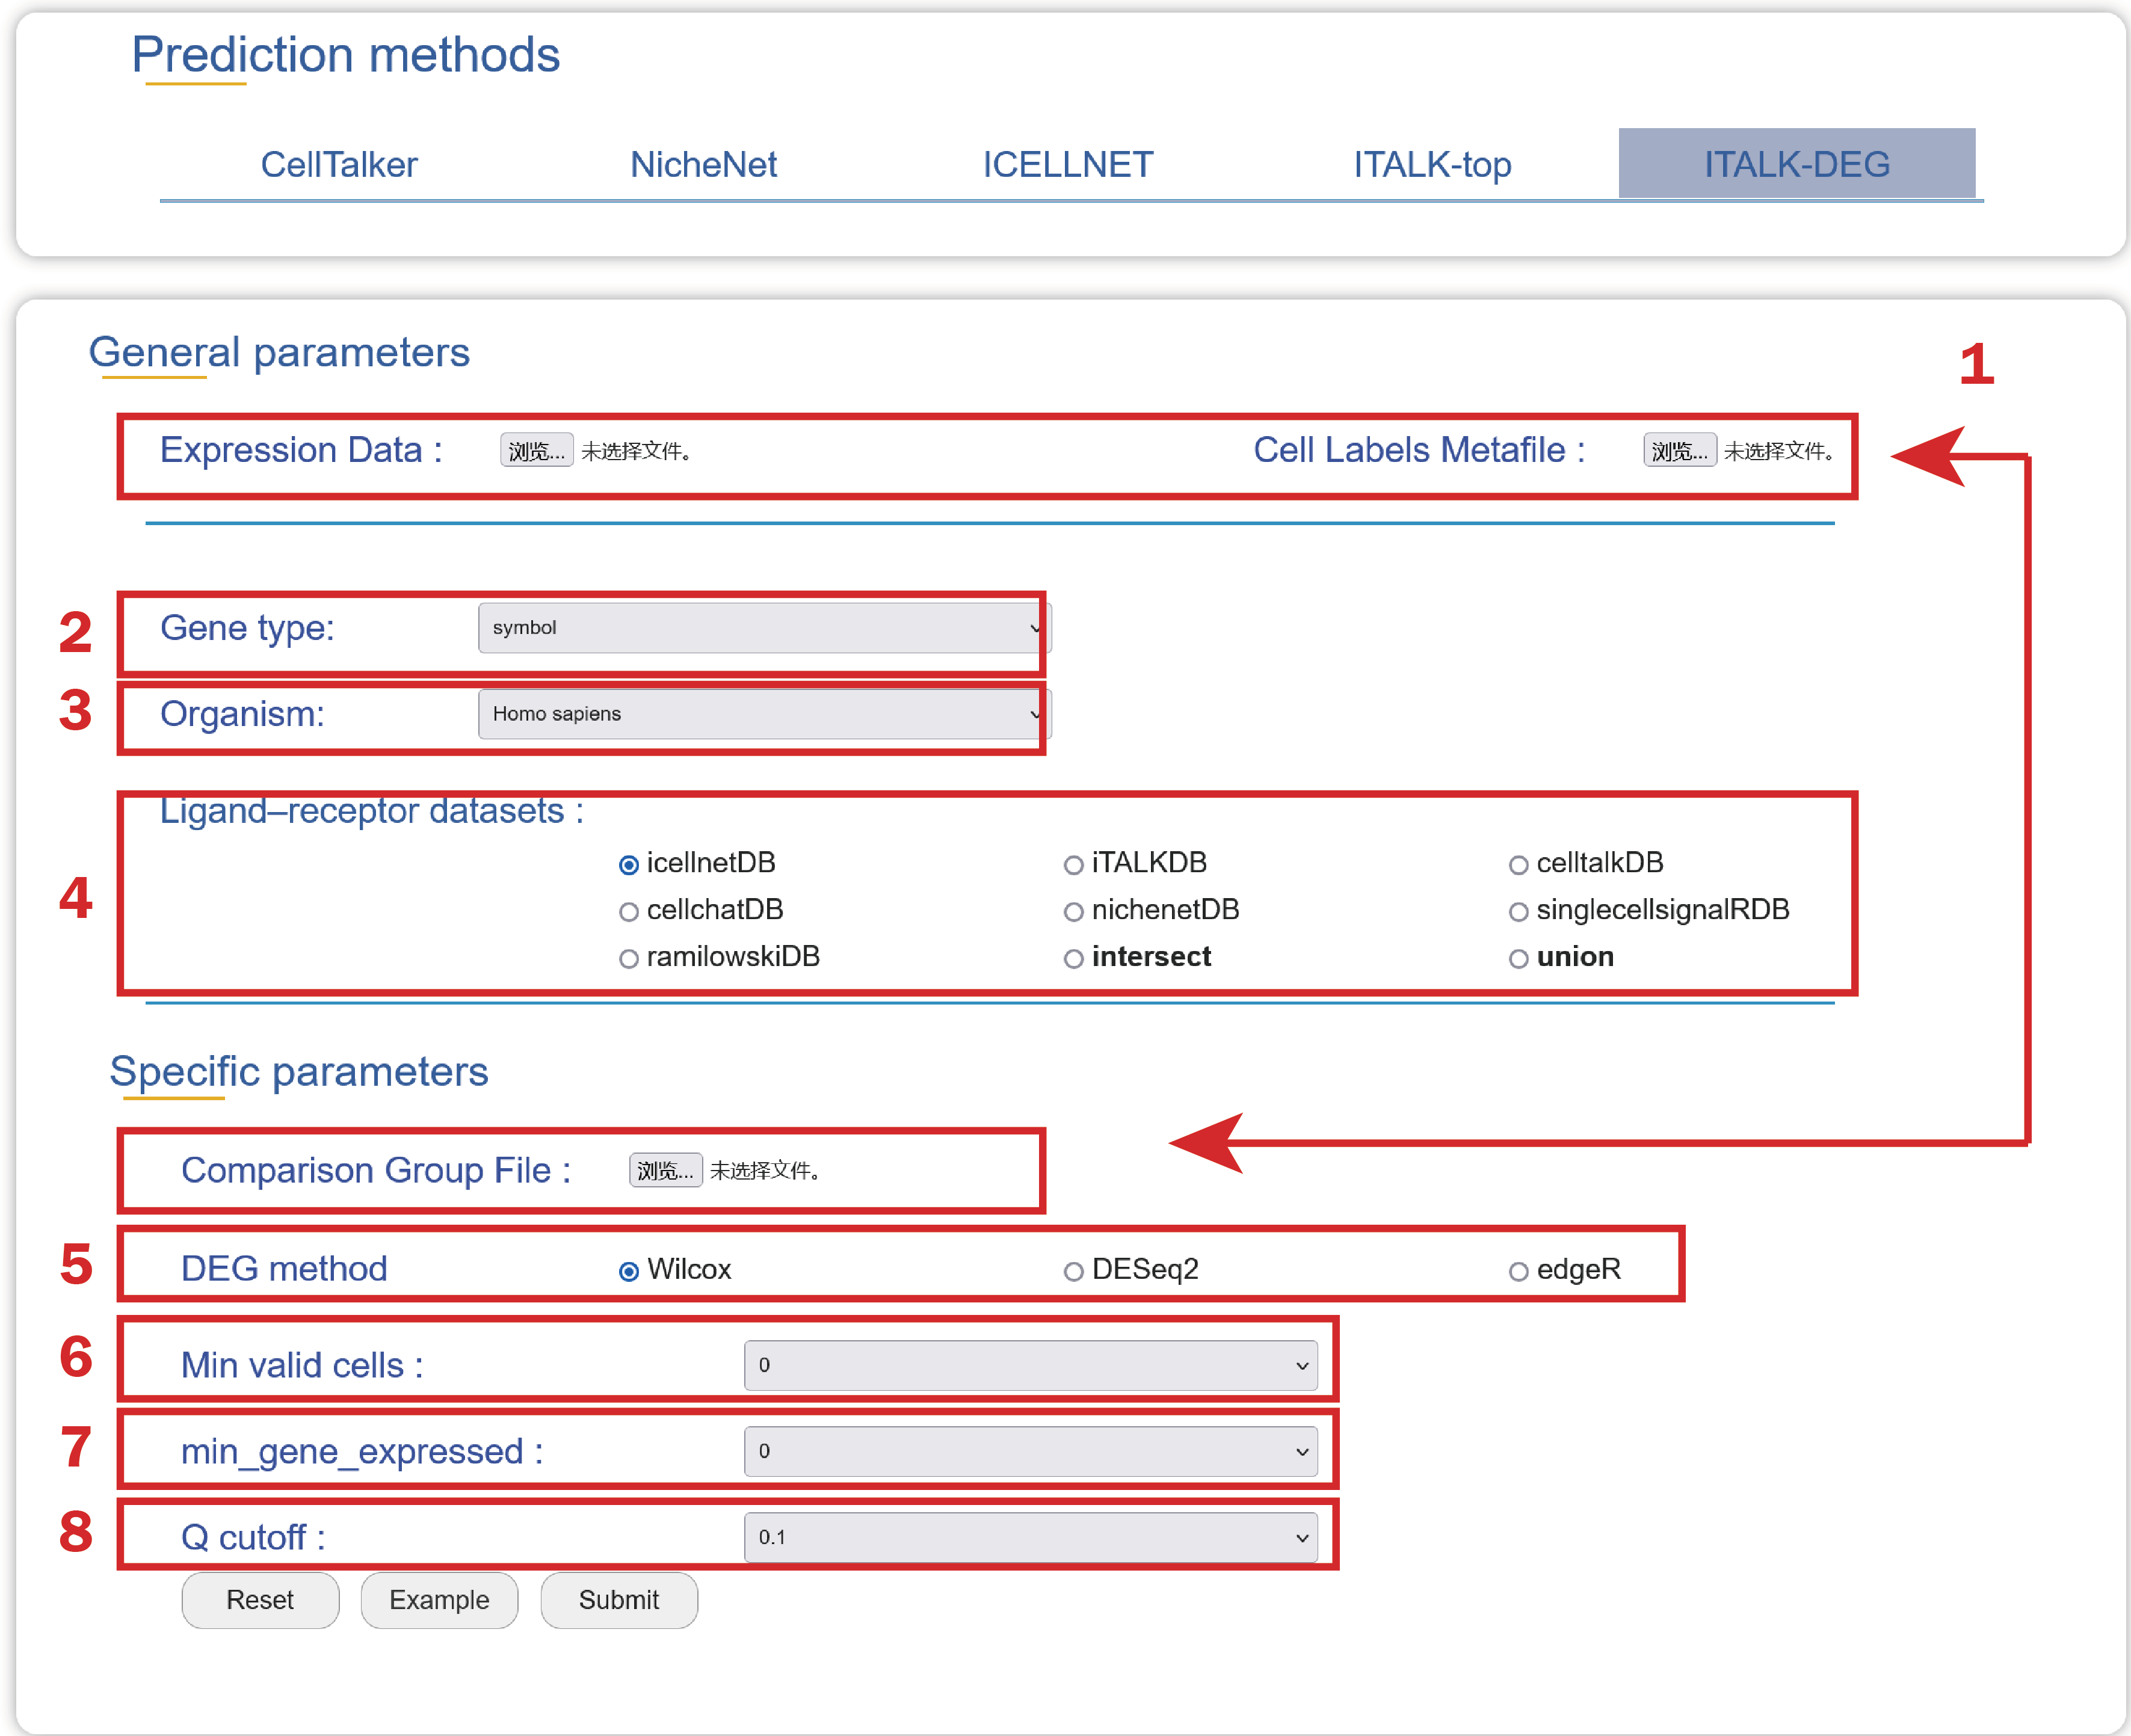
1. Upload an Expression Data, a Cell Labels Metafile, and a Comparison Group File with two columns named “cell” and “compare_group” which can be used to identify differential interactions in the required format.
2. Select a type of gene ids used in your Expression Data.
3. Choose an organism that you are interested in.
4. Select a ligand-receptor dataset to depict the landscape of cell-cell crosstalk regulated by ligand-receptor interactions.
5. Choose an algorithm to identify differentially expressed genes between any two comparable groups.
6. Choose a p value to select significant differential genes
7. Choose a minimum number of genes detected in the cell.
8. Choose a minimum number of cells in which the gene expressed.
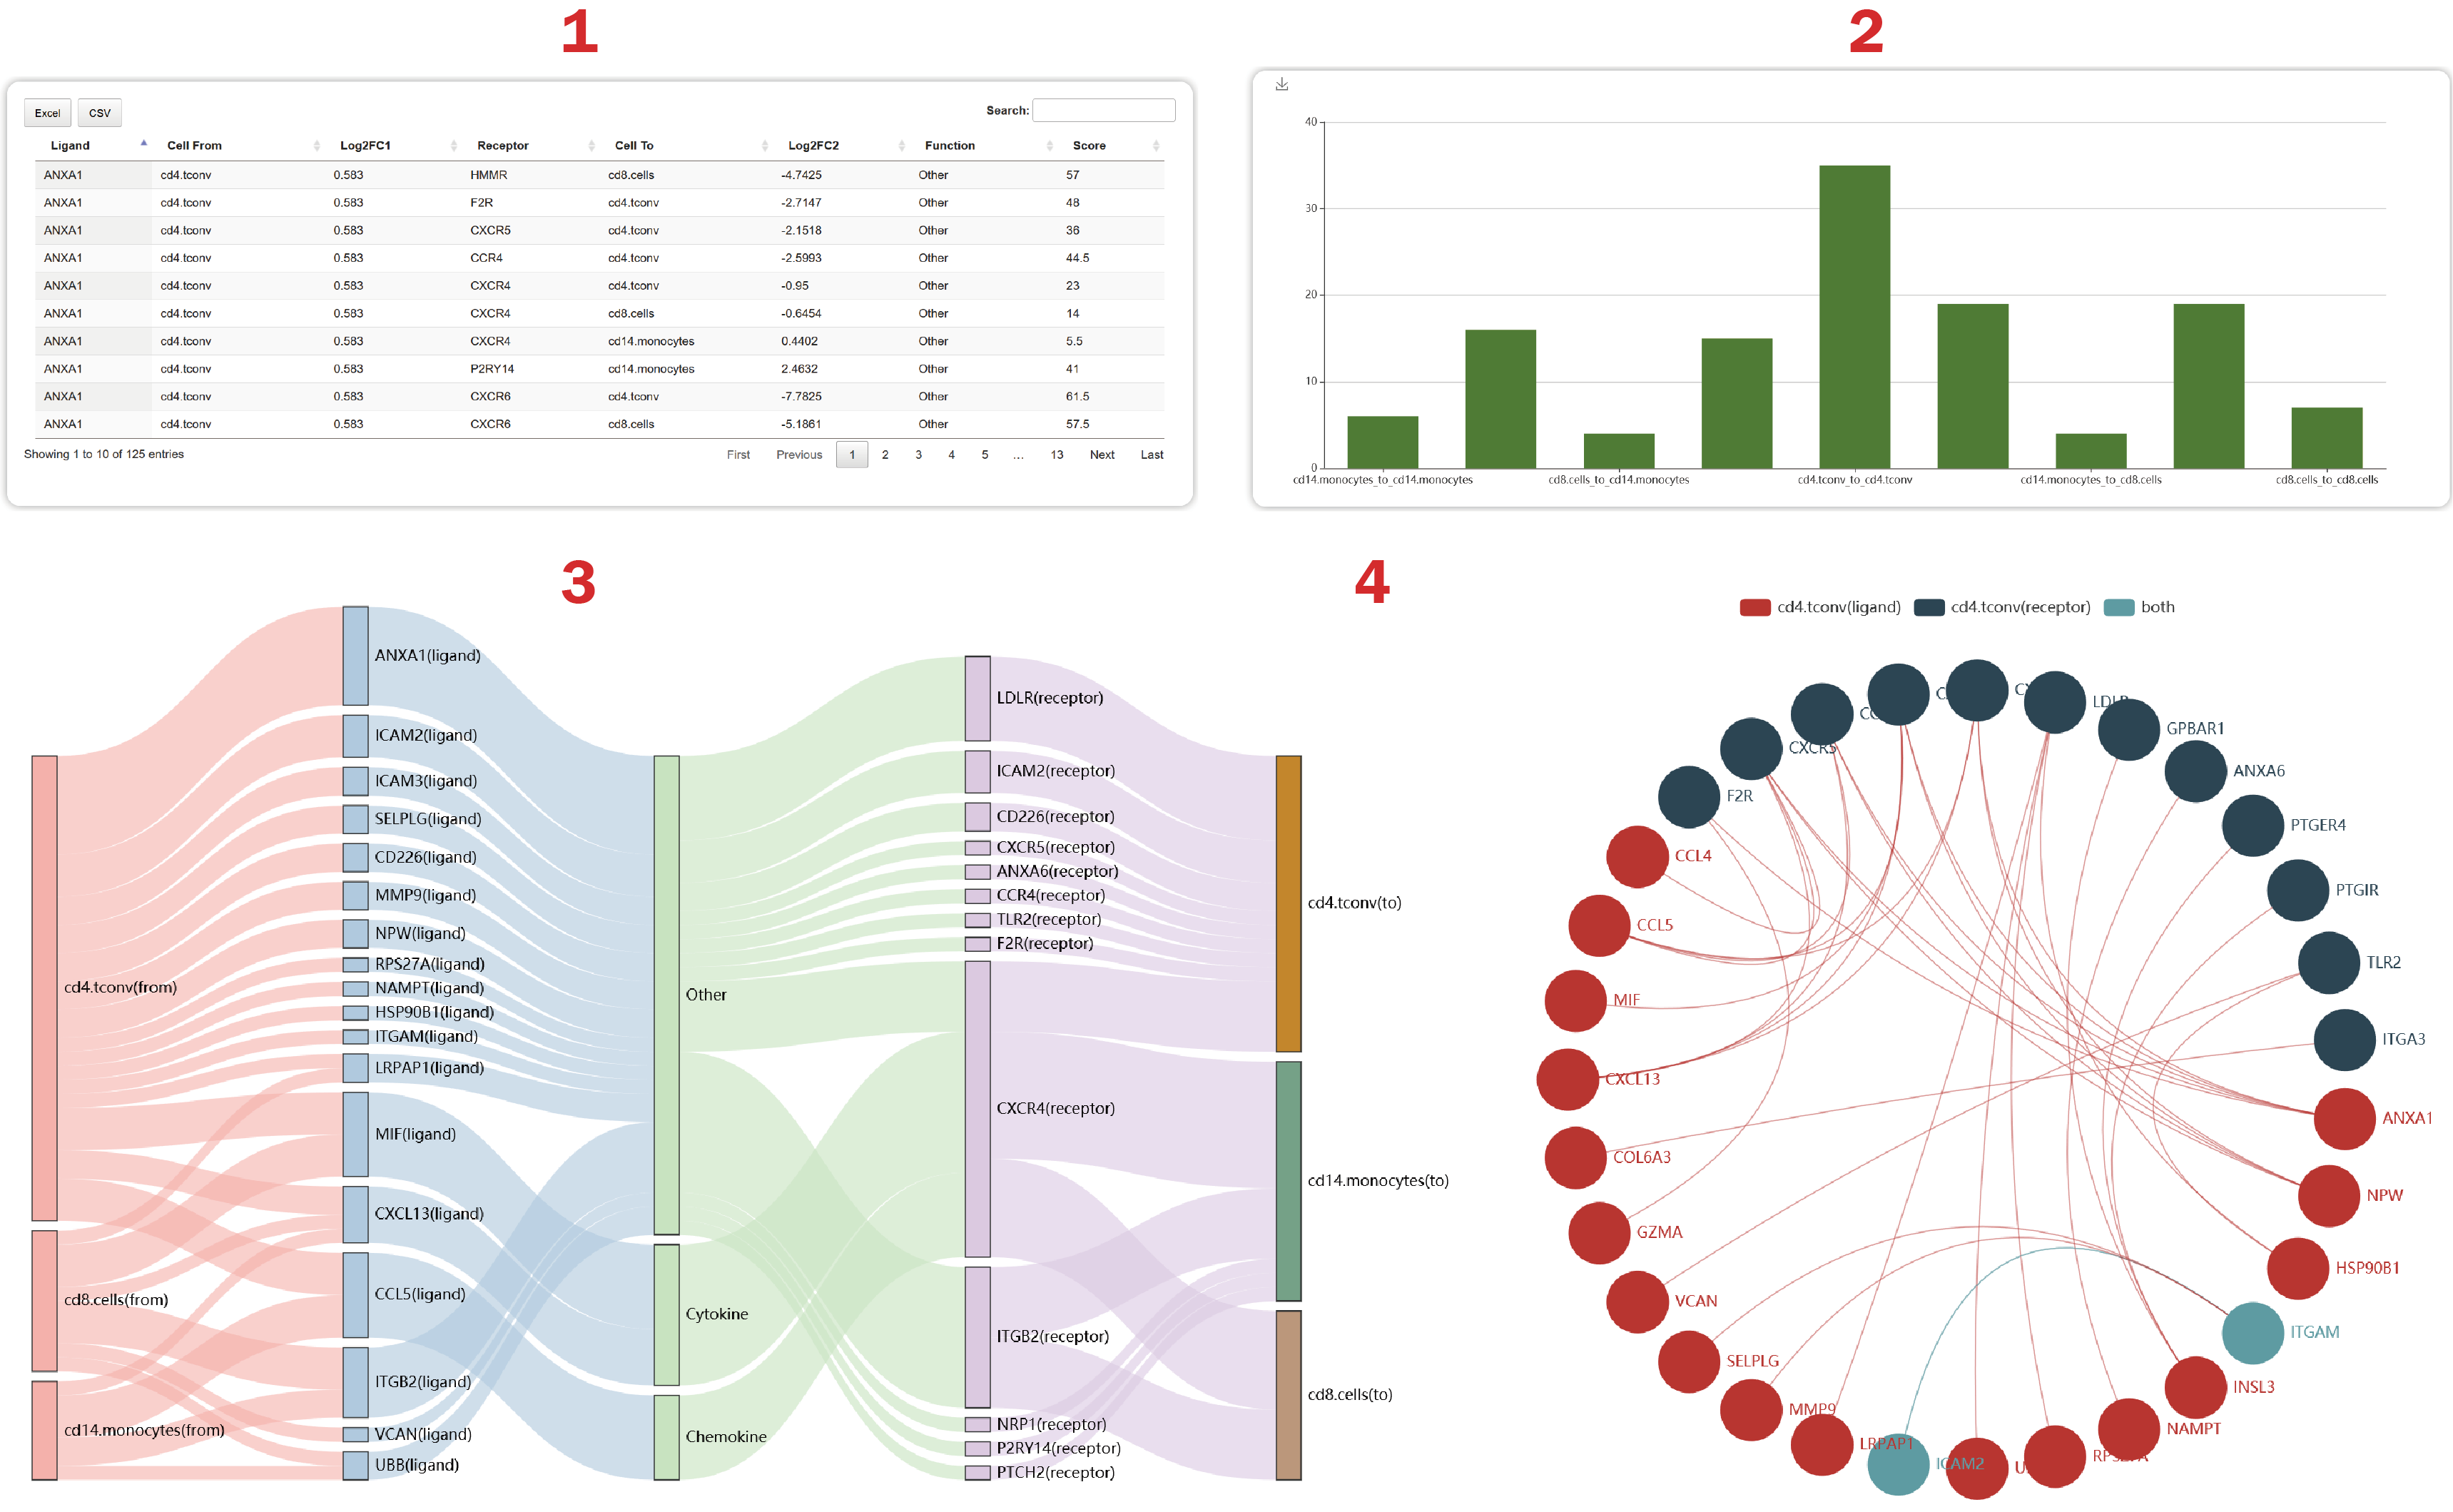
1. Users can get the log2FC, functions and scores of ligand-receptor interactions. The score is calculated as the mean rank of the log2FC of a ligand in a cell type and the log2FC of a receptor in another cell type.
2. Users can get the number of L-R interactions regulating each cell-cell pair.
3. Users can see 50 significant interacting gene pairs sorted by the “score” at most.
4. Users can get a cell-cell crosstalk mediated by the most L-R interactions
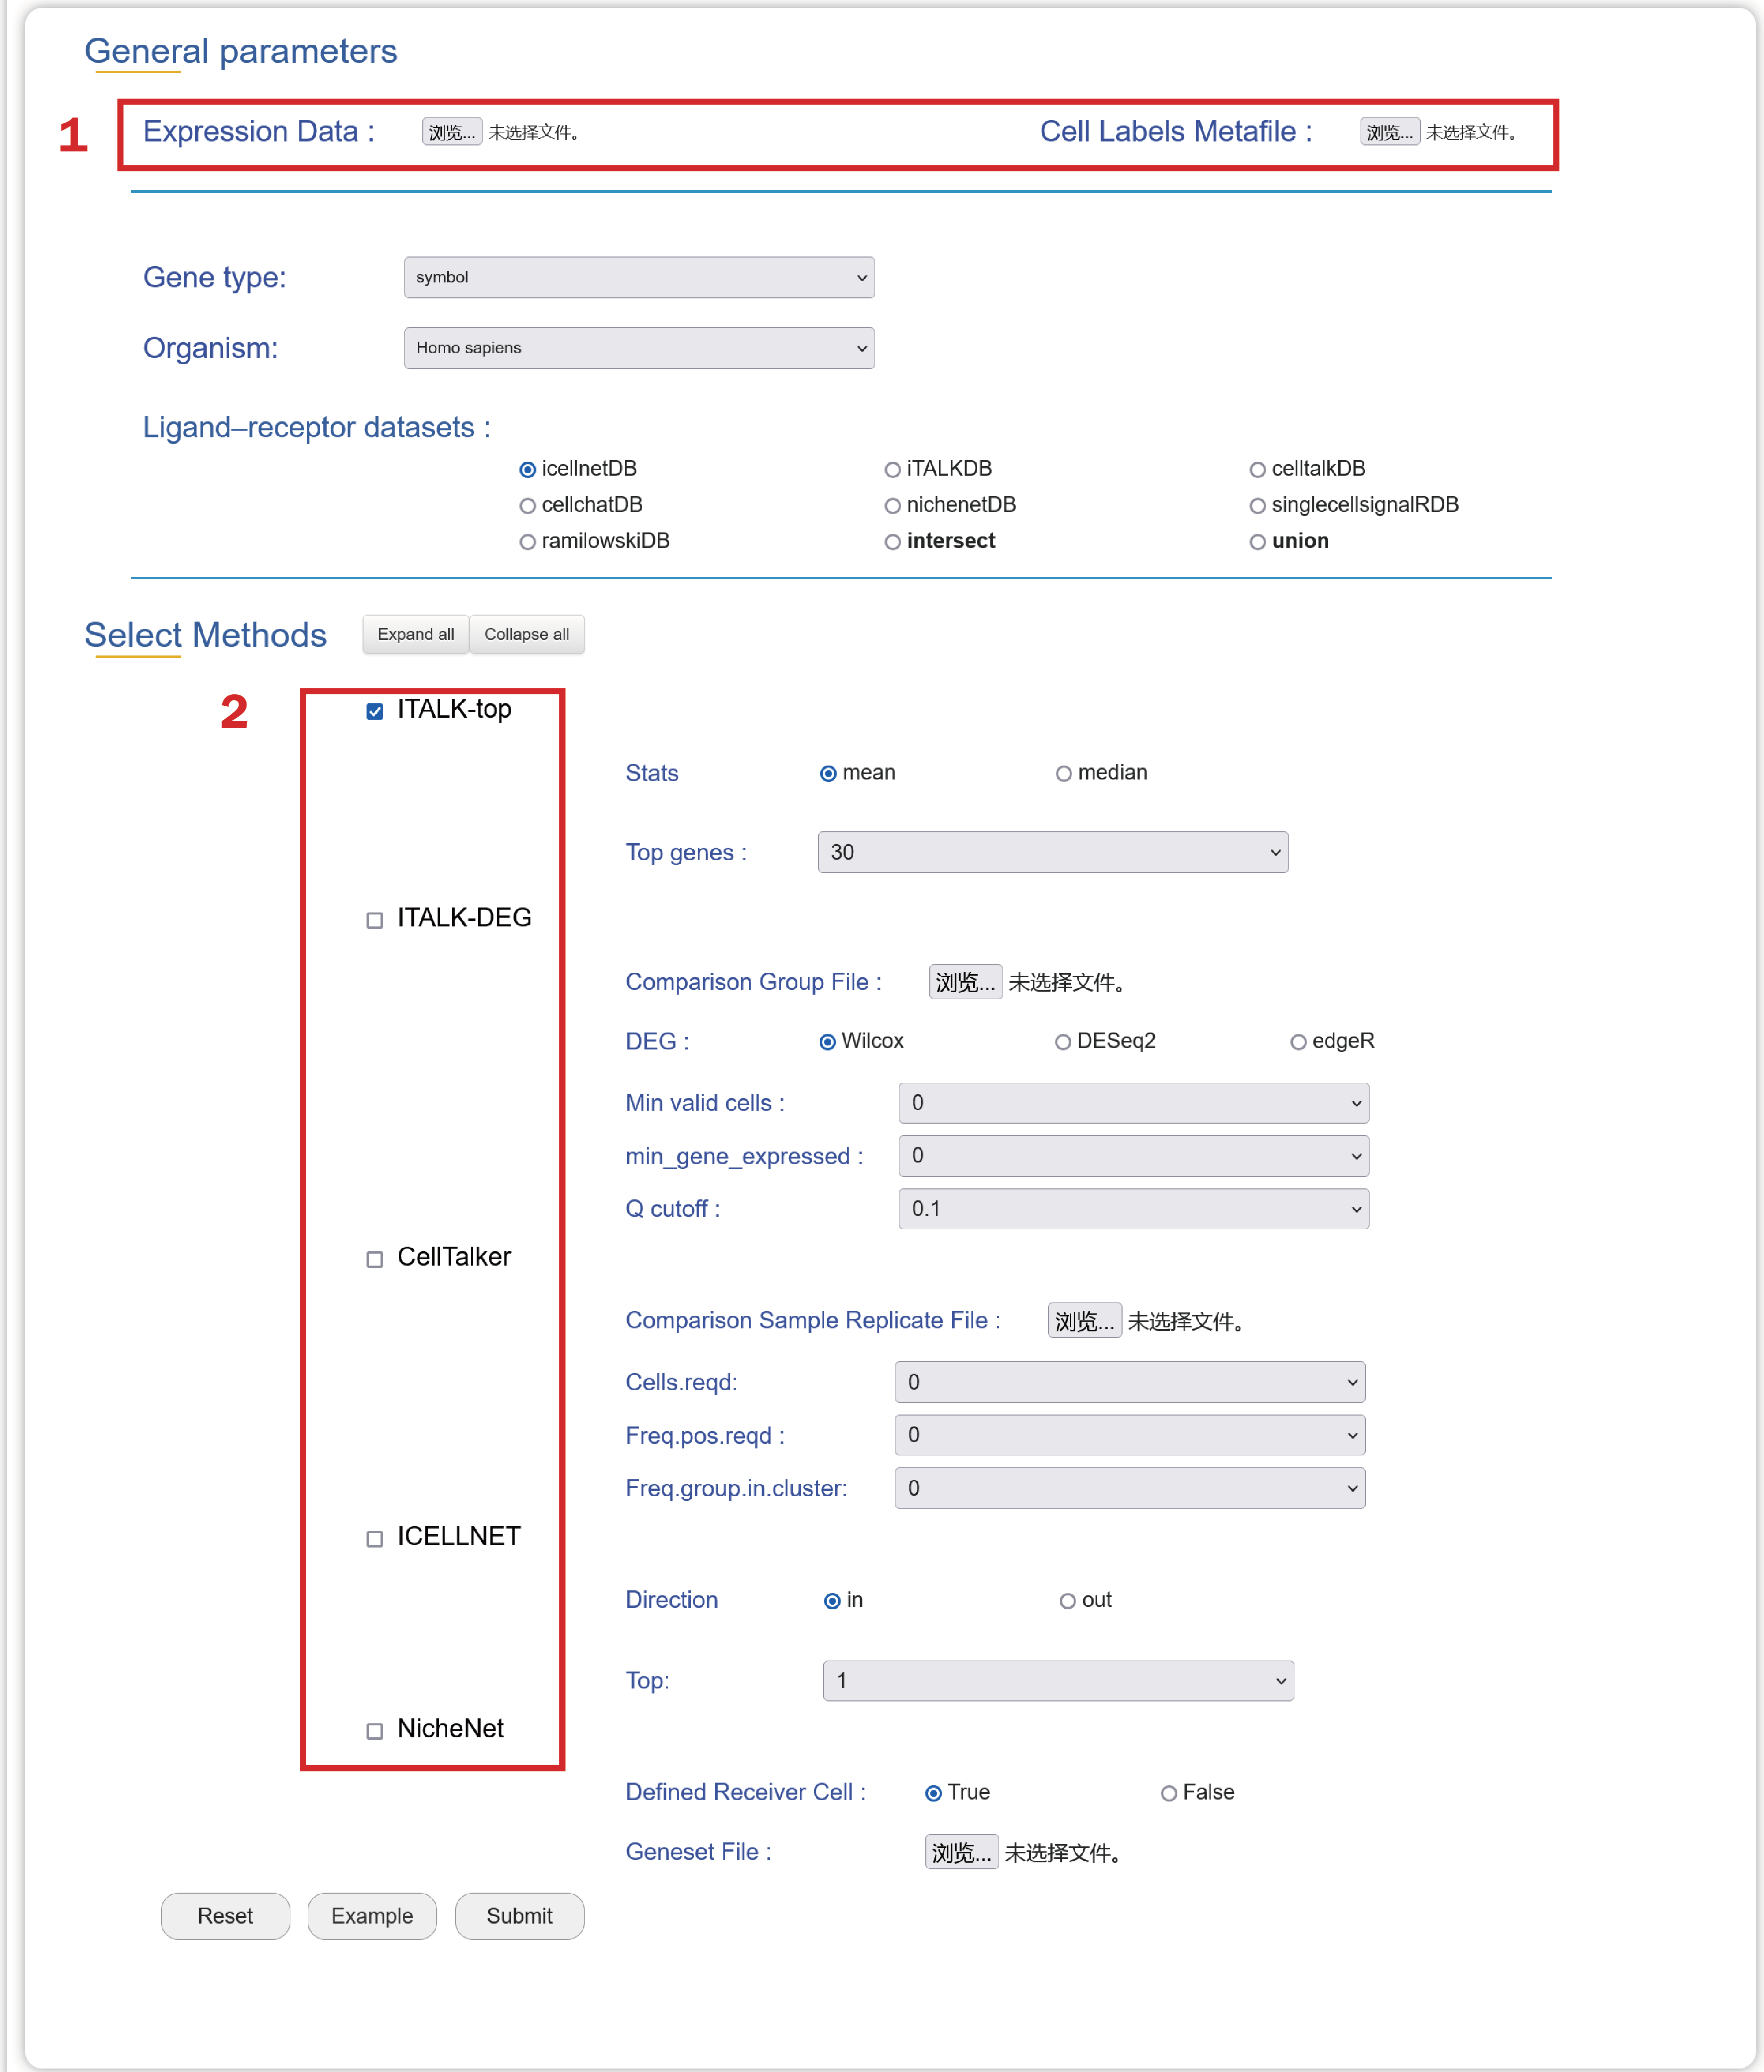
1. Upload an Expression Data, a Cell Labels Metafile in compliance with the general format.
2. Choose several algorithms and corresponding parameters.
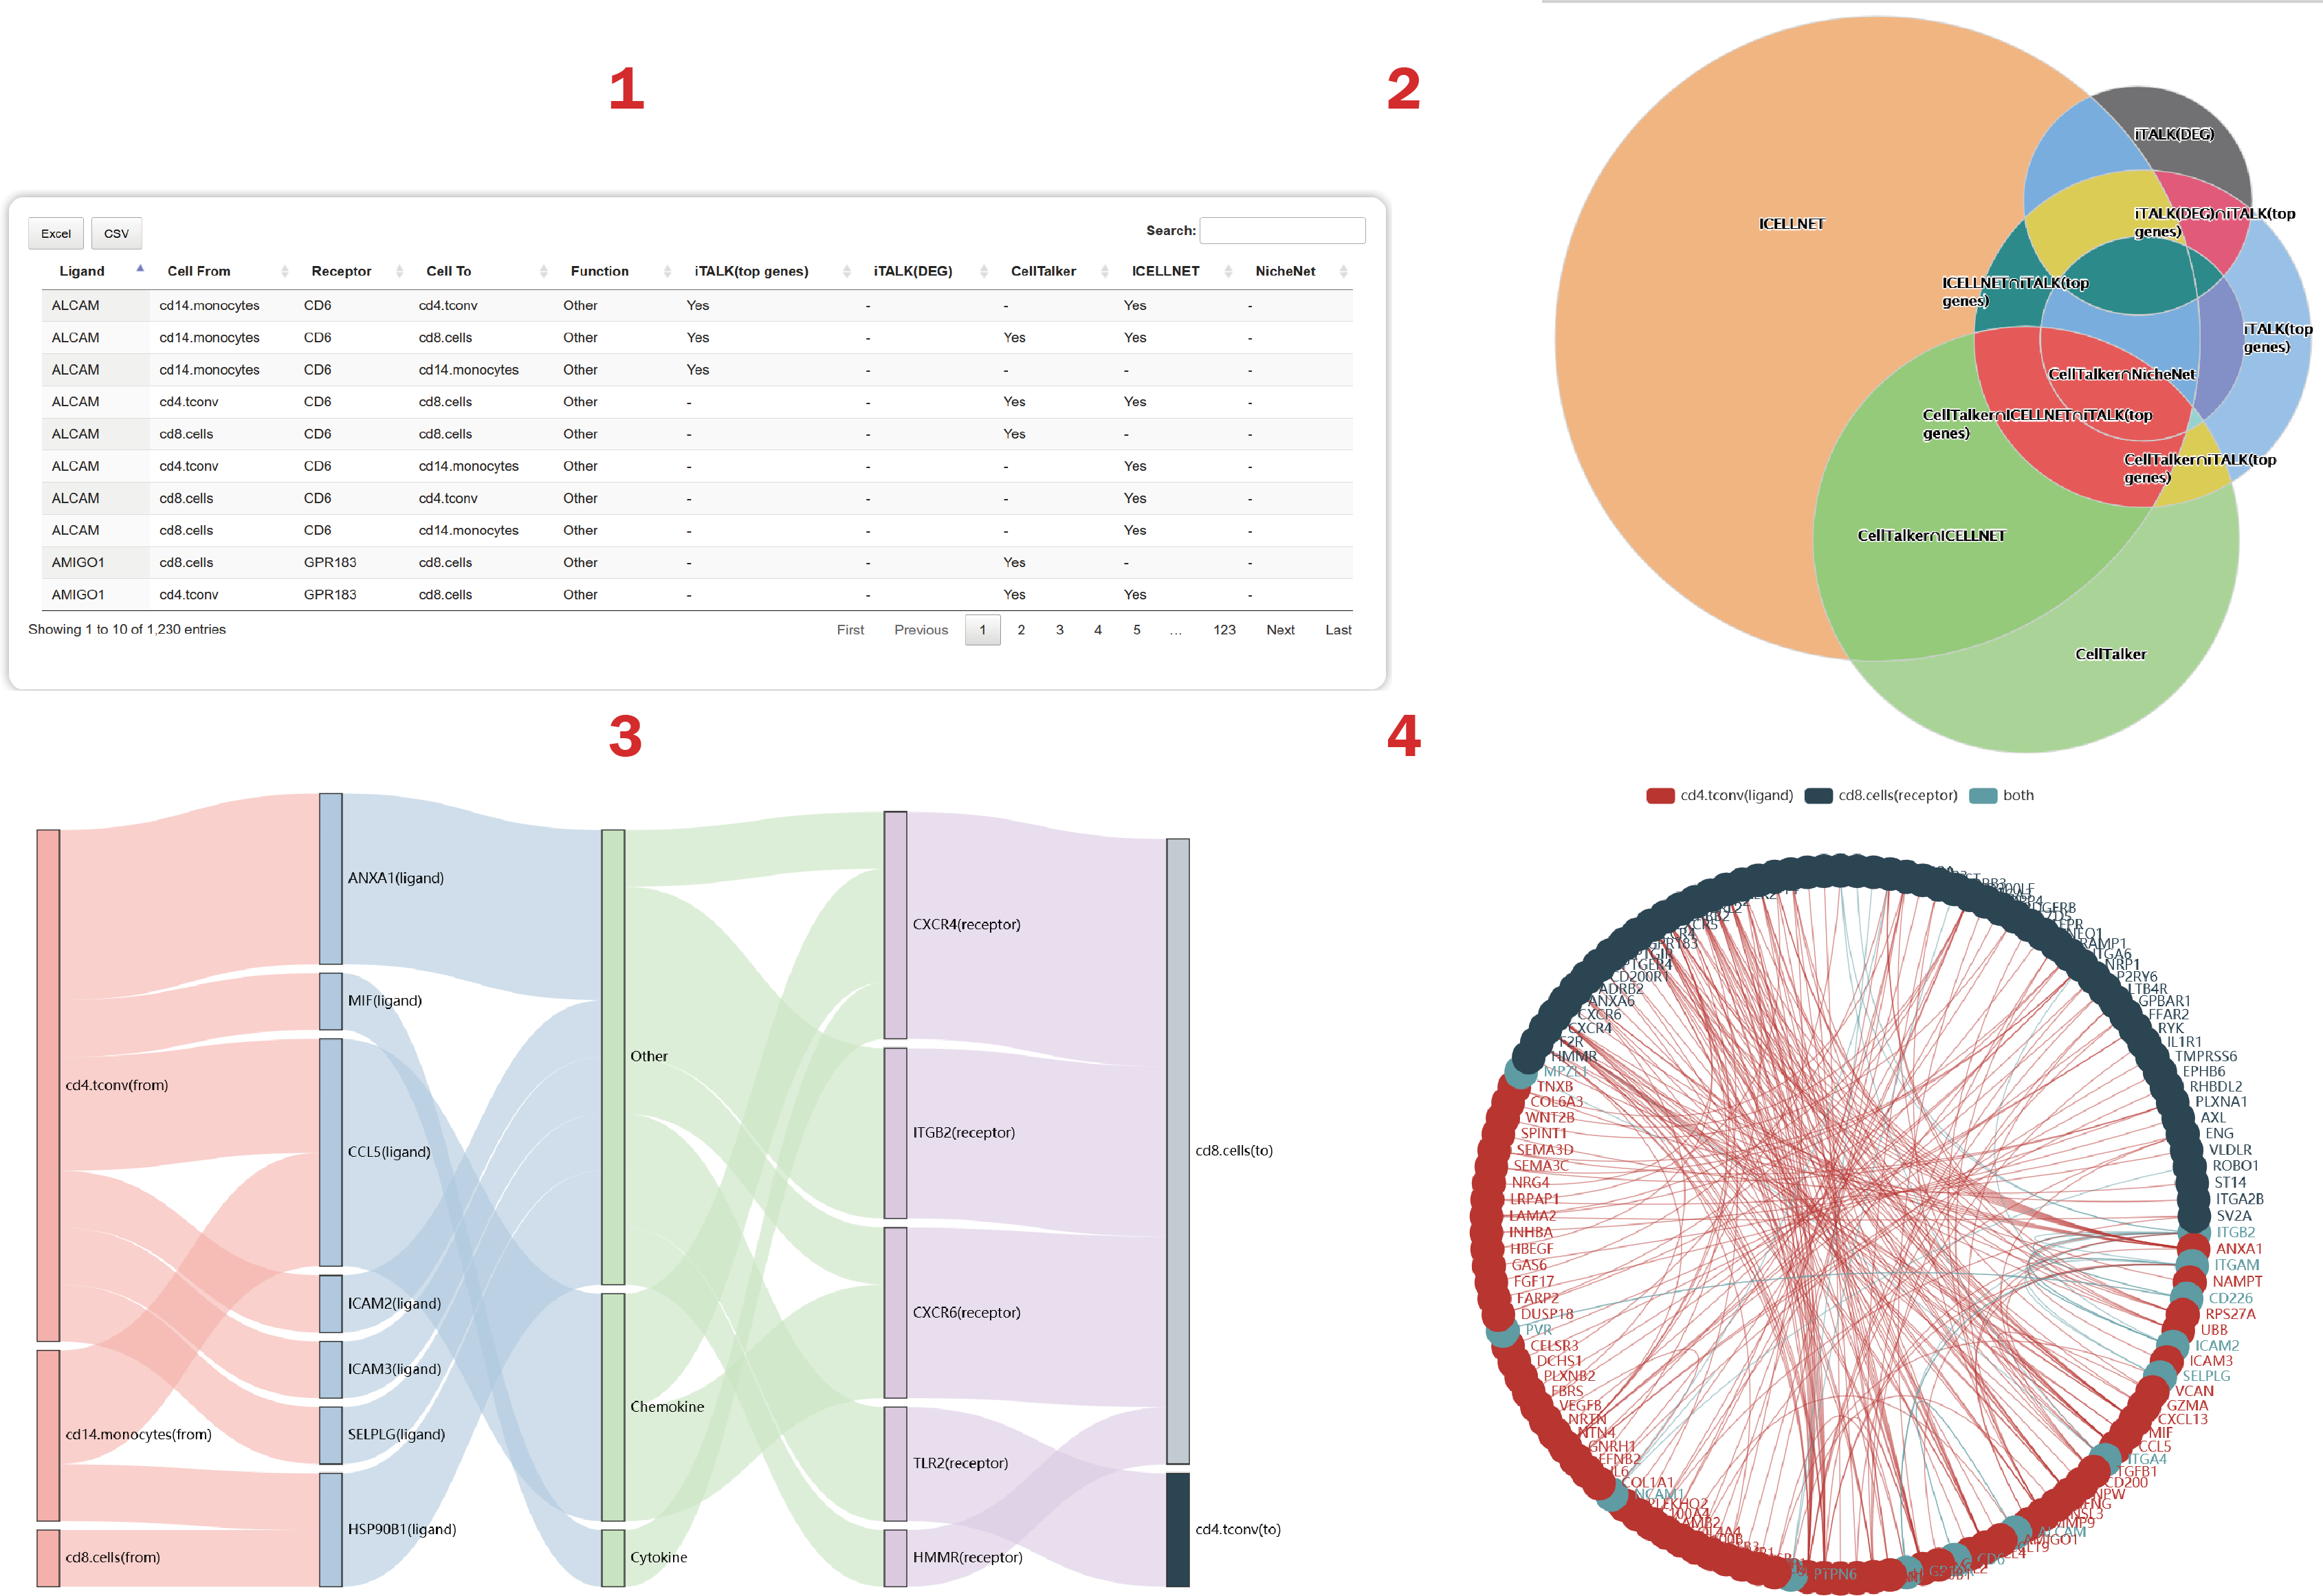
In the result page of Integration, users can get a summary of integrated results from multiple methods.
1. Users can obtain cell-cell communications and ligand-receptor interactions predicted by each method.
2. Users can calculate the intersection(s) of list of results from each method.
3. Users can illustrate the common interactions predicted by the most methods.
4. Users can get a cell-cell crosstalk mediated by the most ligand-receptor interactions from the integrated result.
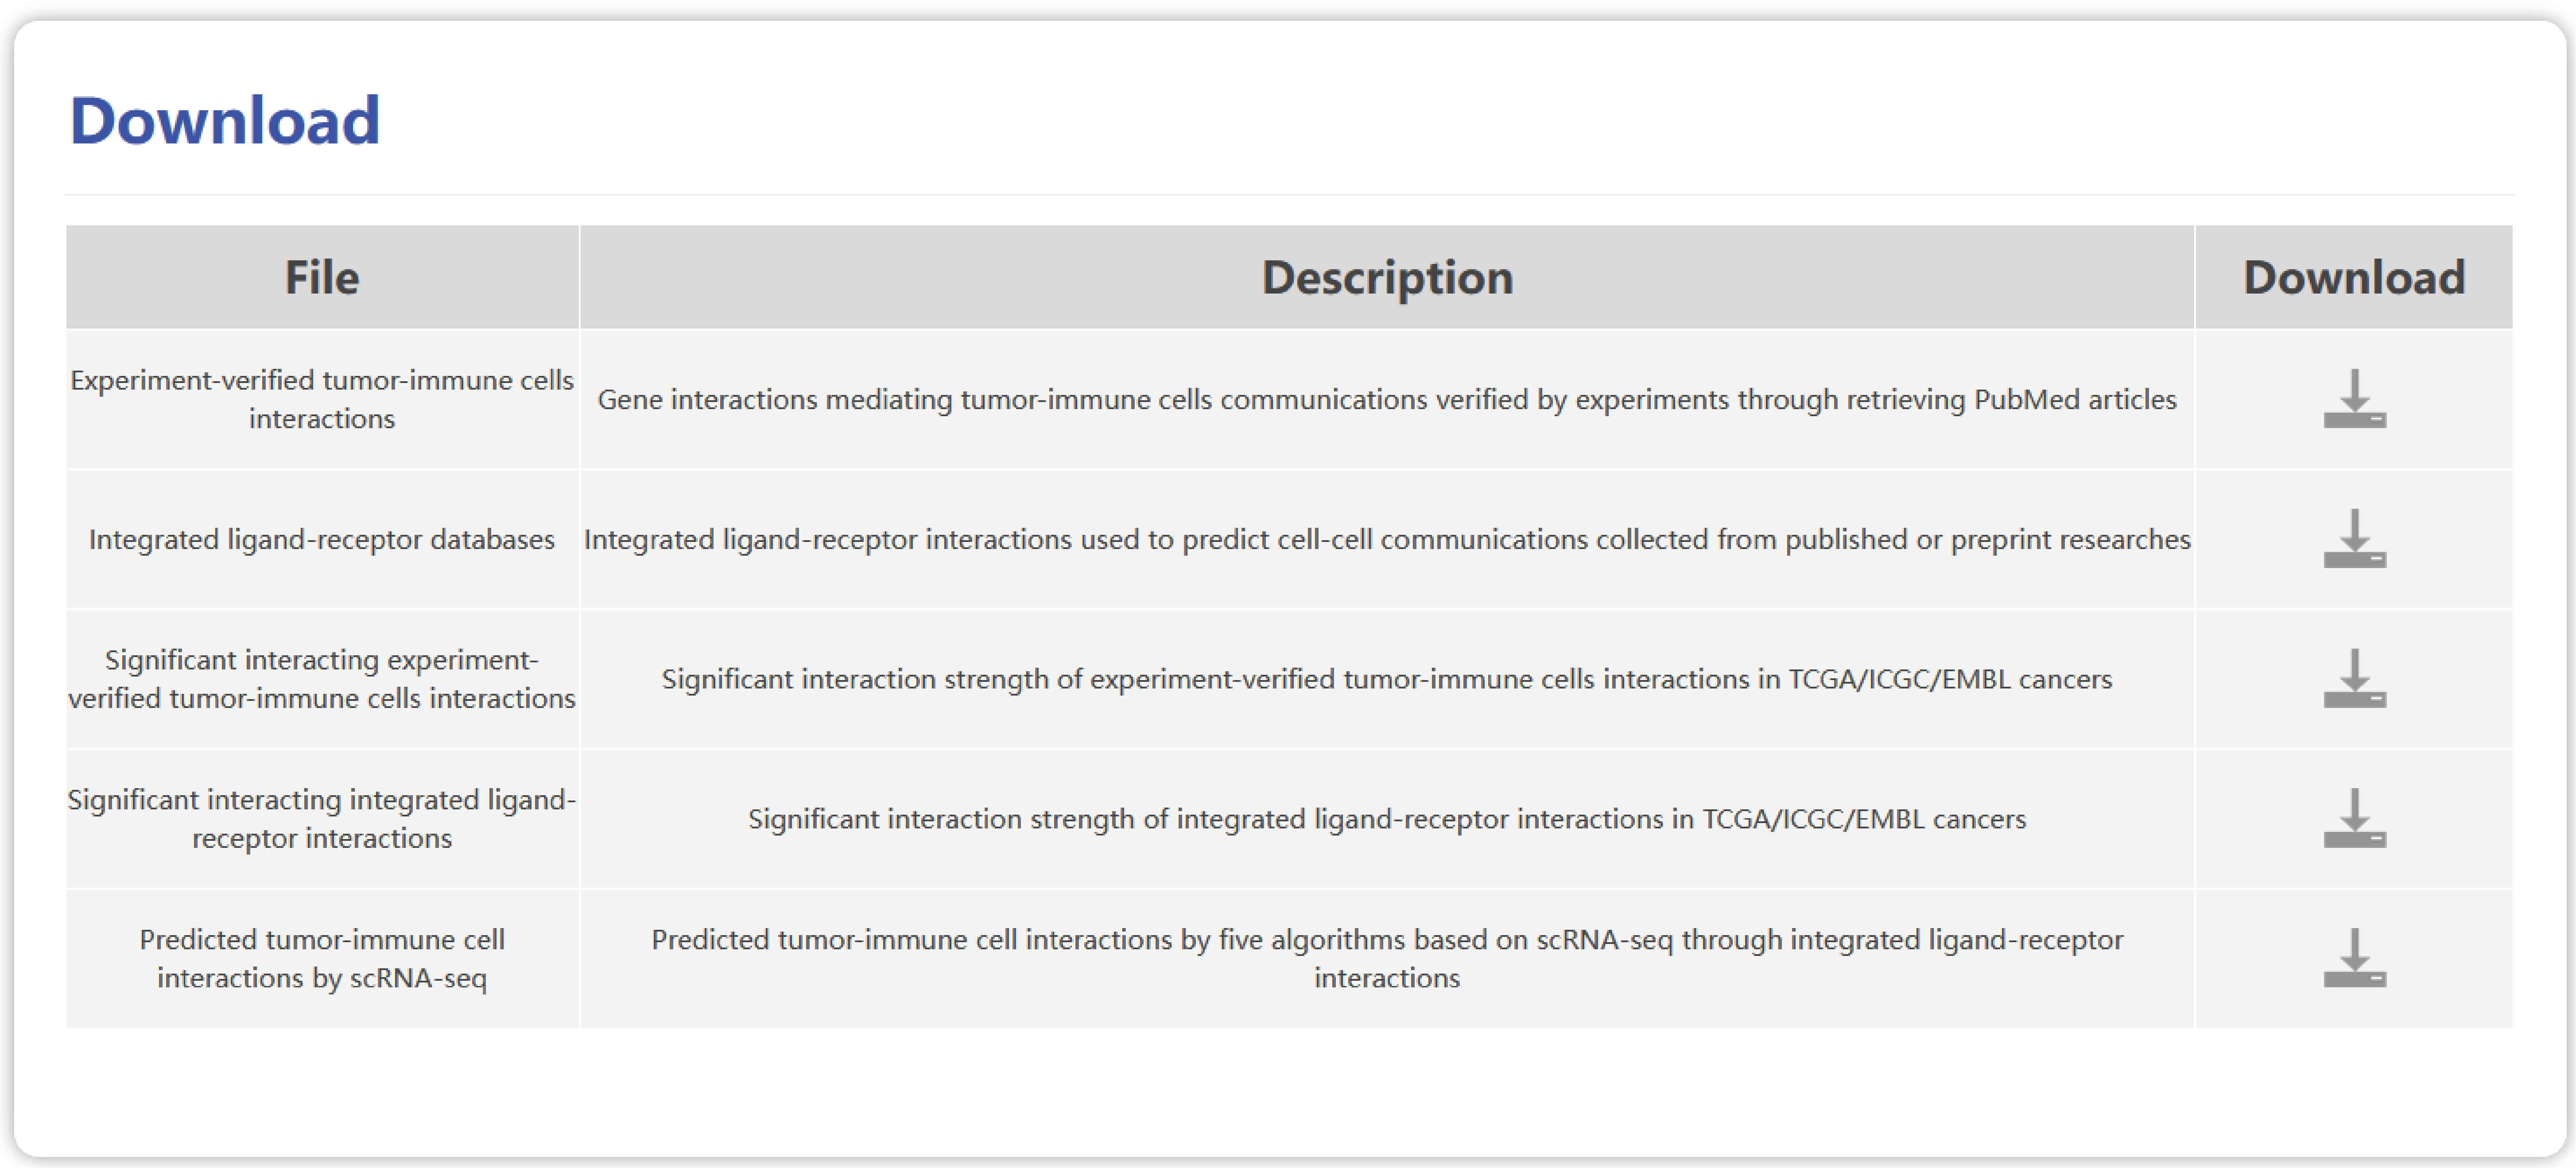
1. Users can download the data which you are interested in from download page.