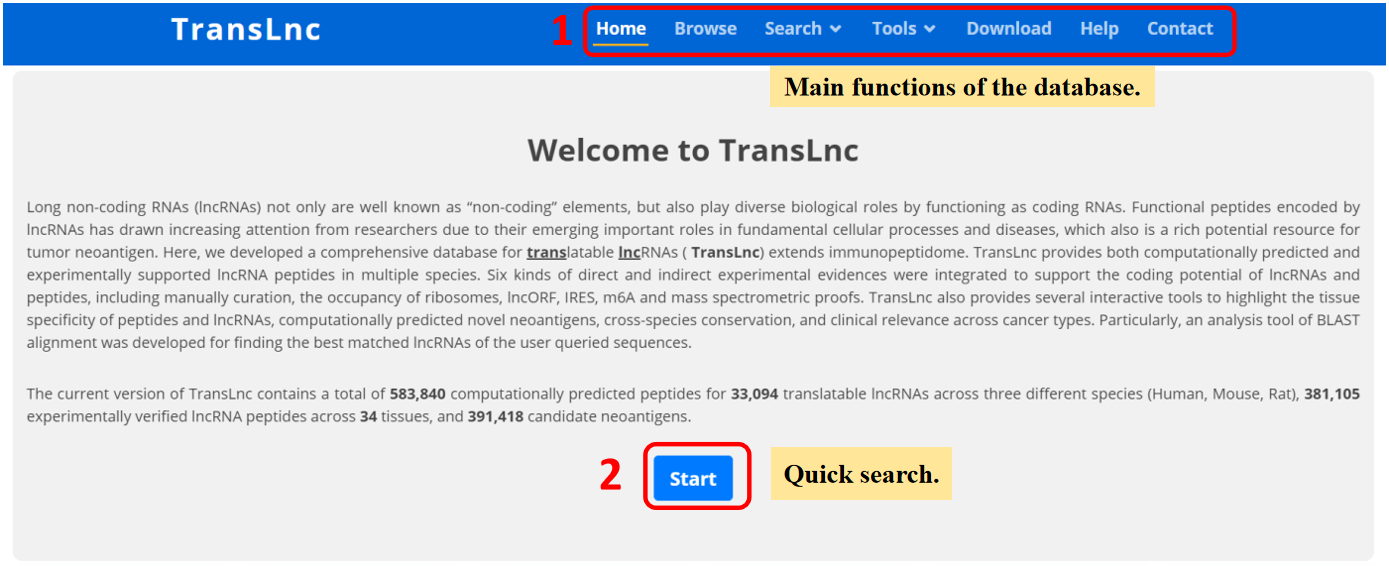
TransLnc provides a user-friendly searching interface.
Long non-coding RNAs (lncRNAs) not only are well known as “non-coding” elements,
but also play diverse biological roles via encoding peptides. Functional peptides encoded by lncRNAs have drawn increasing
attentions from researchers, which are also a rich potential resource for tumor neoantigens.
Here, we developed a comprehensive database for translatable lncRNAs (TransLnc), which extends cancer immunopeptidome.
TransLnc provides both computationally predicted and experimentally supported lncRNA peptides in multiple species.
Six kinds of direct and indirect experimental evidences were integrated to support the coding potential of lncRNAs and peptides,
including manually curation, the occupancy of ribosomes, lncORF, IRES, m6A and mass spectrometric proofs.
TransLnc also provides several interactive tools to highlight the tissue specificity of peptides and lncRNAs,
computationally predicted novel neoantigens, cross-species conservation, and clinical relevance across cancer types.
Particularly, an analysis tool of BLAST alignment was developed for finding the best matched lncRNAs of the user queried sequences.
1. Main functions of the database are provided in menu bar form.
2. Click "Start" button to start a quick search.
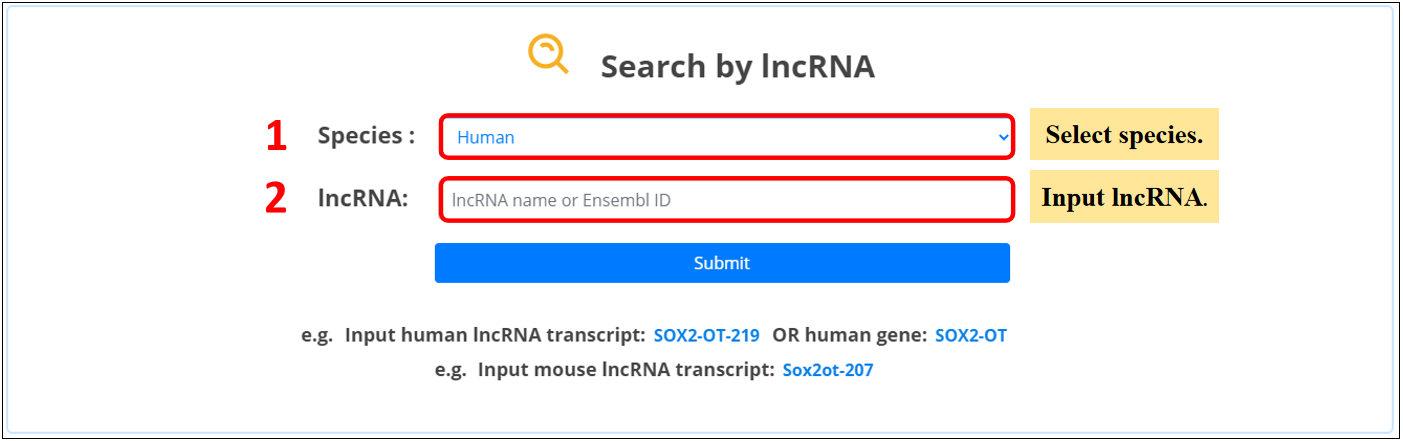
Three ways are provided to query the peptides encoded by lncRNAs.
1. Select species.
2. Input the lncRNA (or lncRNA transcript) ID or name.
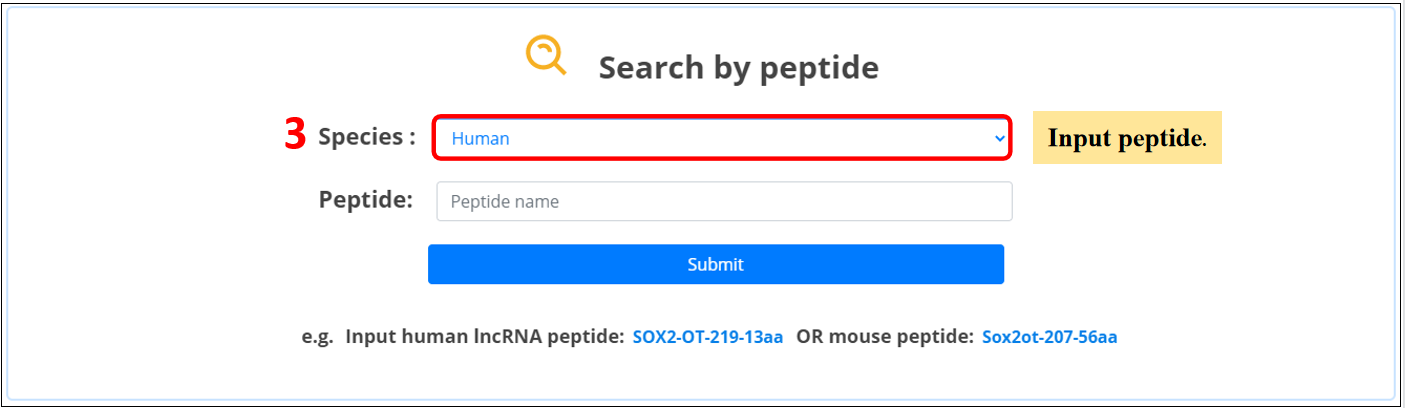
3. Input the peptide name.
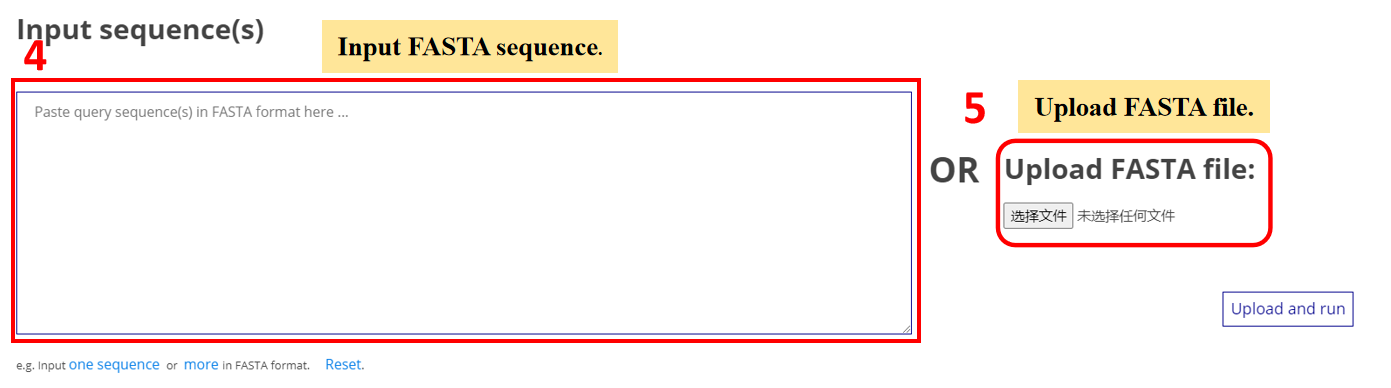
4. Input the nucleotide sequence(s) of one or more transcripts.
5. Upload nucleotide sequence in FASTA file.
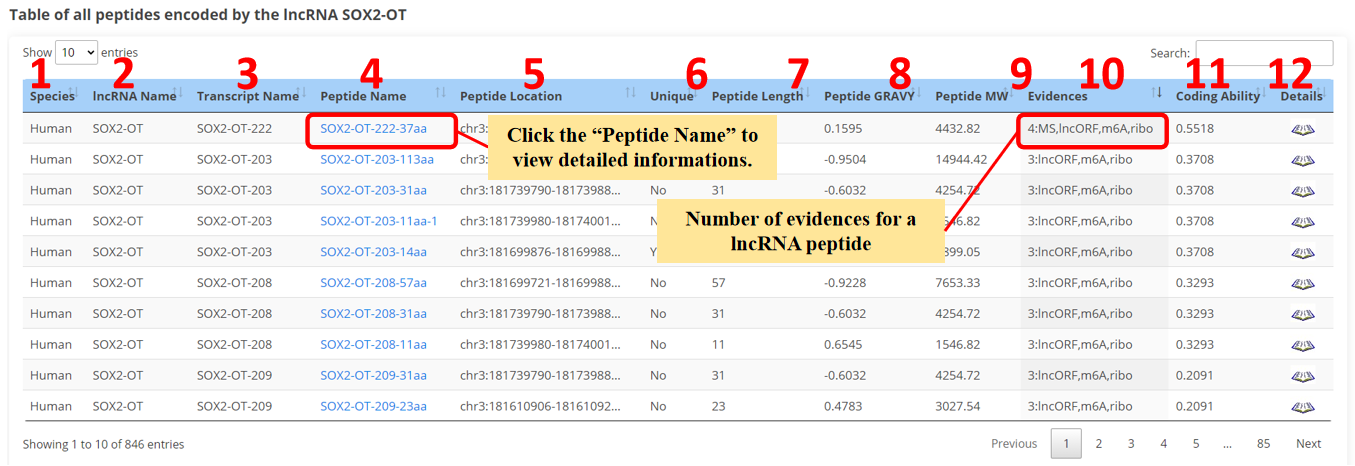
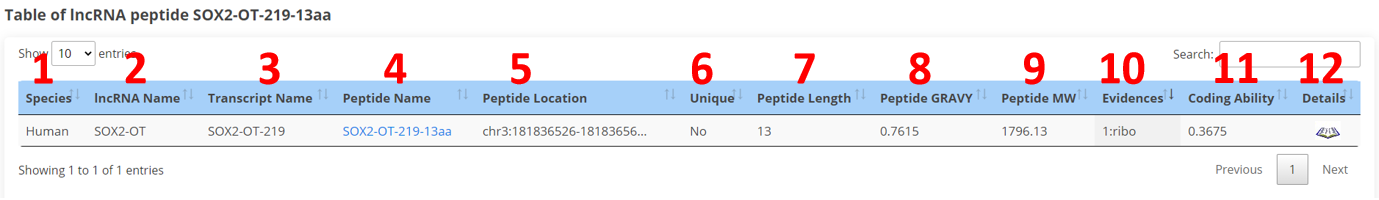
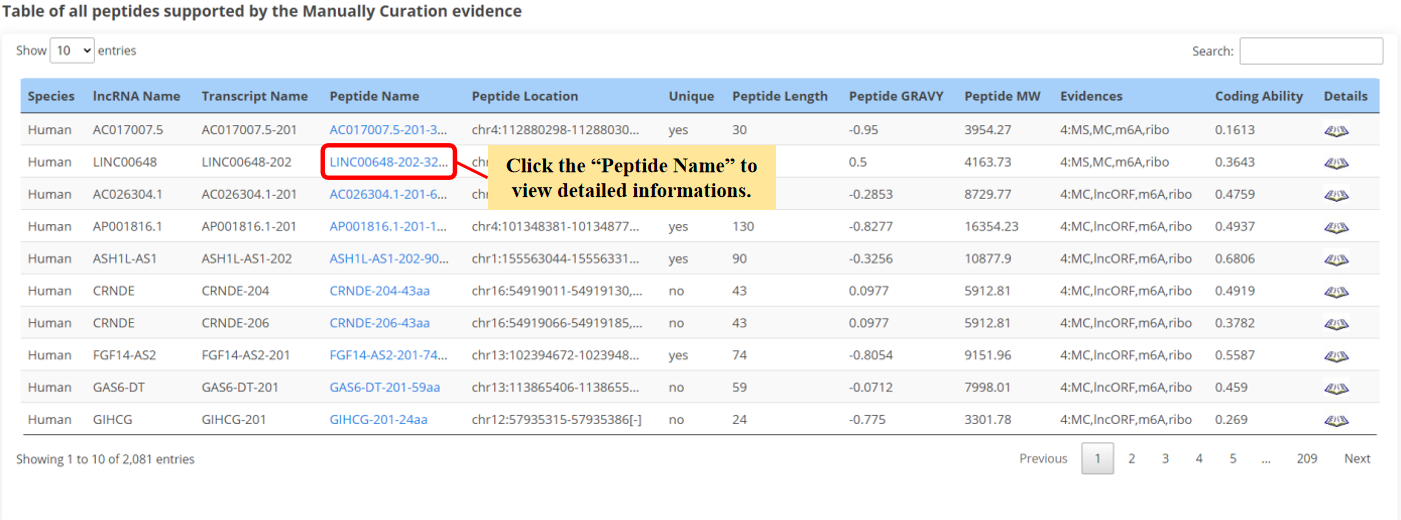
The result page of peptides is displayed as below.
1. Species.
2. lncRNA name.
3. lncRNA transcript name.
4. Peptide name.
5. Genome position of lncRNA peptides.
6. Sequence uniqueness of lncRNA peptides.
7. Length of lncRNA peptides.
8. Grand average of hydropathicity of lncRNA peptides.
9. Relative Molecular Mass of lncRNA peptides.
10. The numbers of evidences for lncRNA peptides.
11. Coding ability of lncRNA transcripts.
12. Click to view the detail informations.
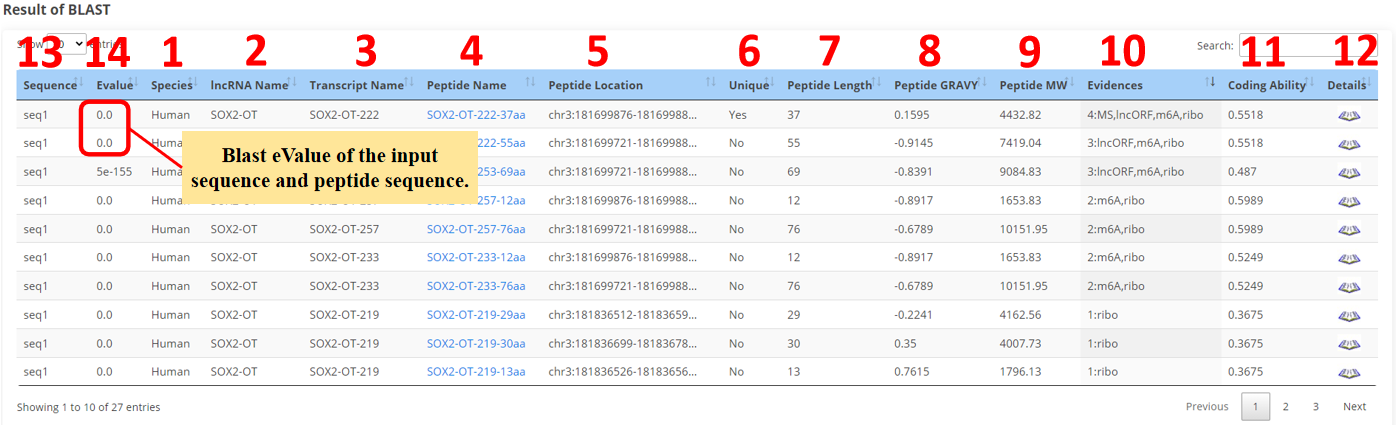
13. Sequence name.
14. Blast eValue of the input sequence and peptide sequence.
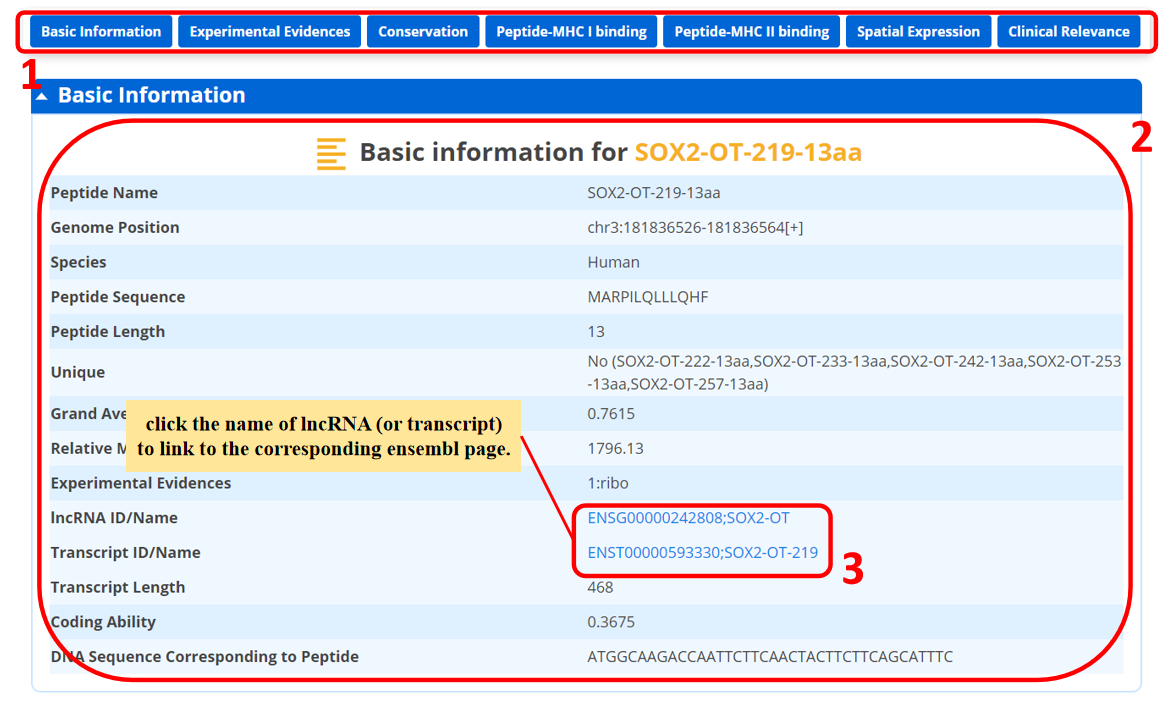
For each peptide, we provide basic information, which is displayed as below.
1. You could directly go to the module of interest by click the axis.
2. The basic information of the peptide.
3. Click the name of lncRNA (or transcript) for linking the corresponding Ensembl page.
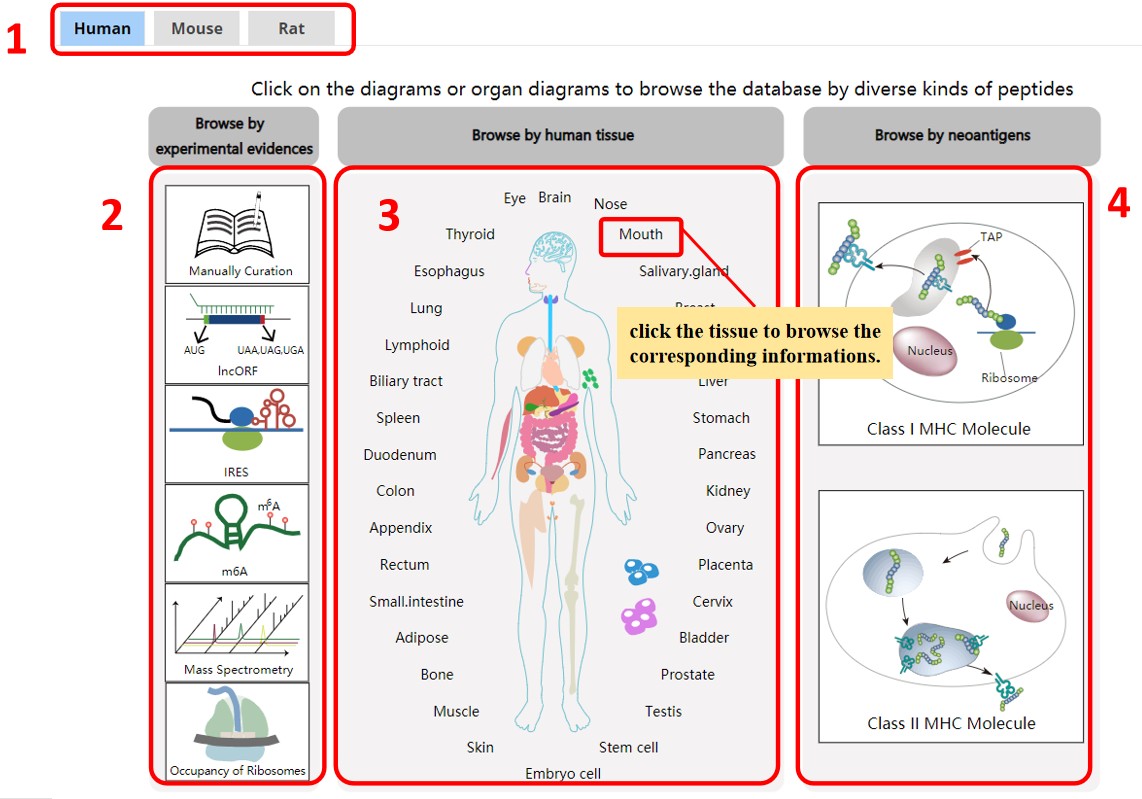
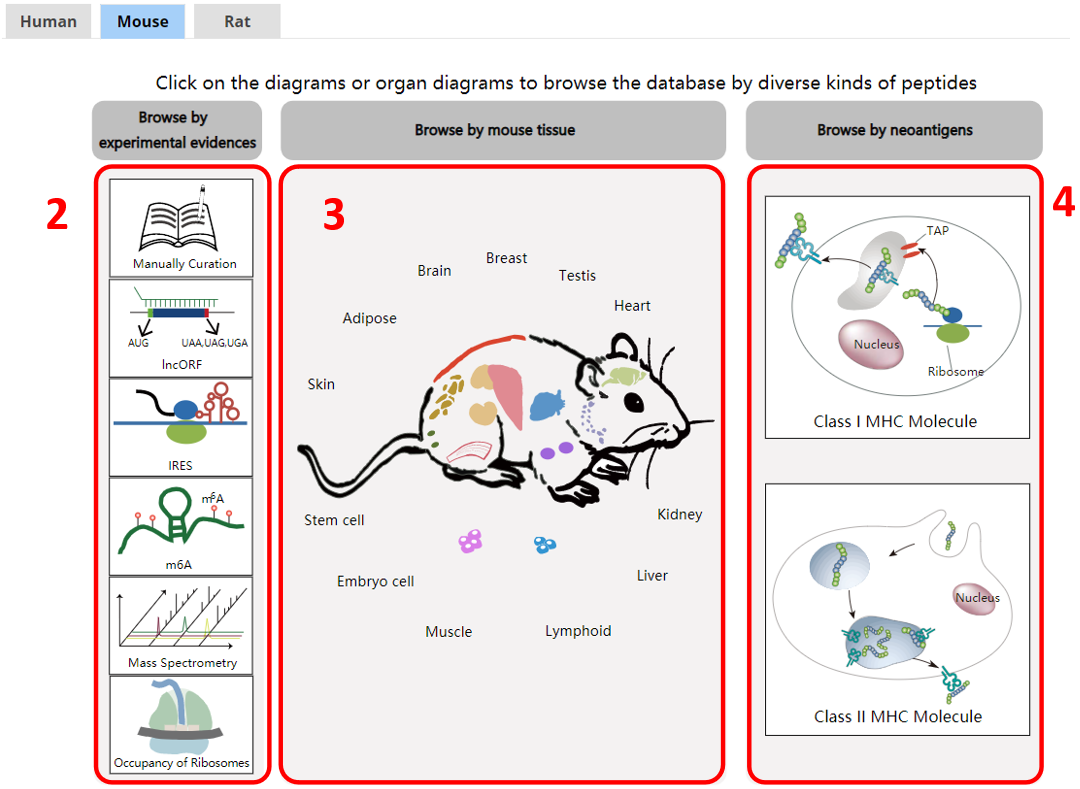
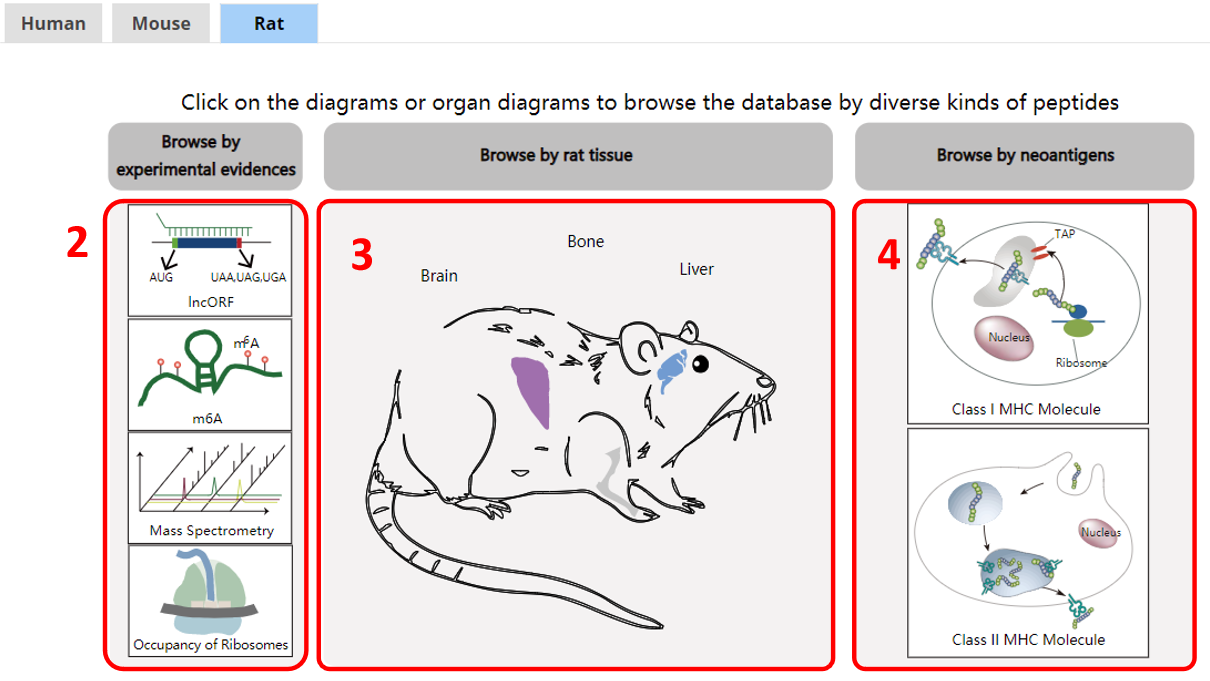
For the browse page, we provide lncRNA encoded peptides by species, tissues, or by experimental evidences, or by peptides bound by MHC I or II.
1. Species.
2. Browse by experimental evidences.
3. Browse by tissue.
4. Browse by novel neoantigens.
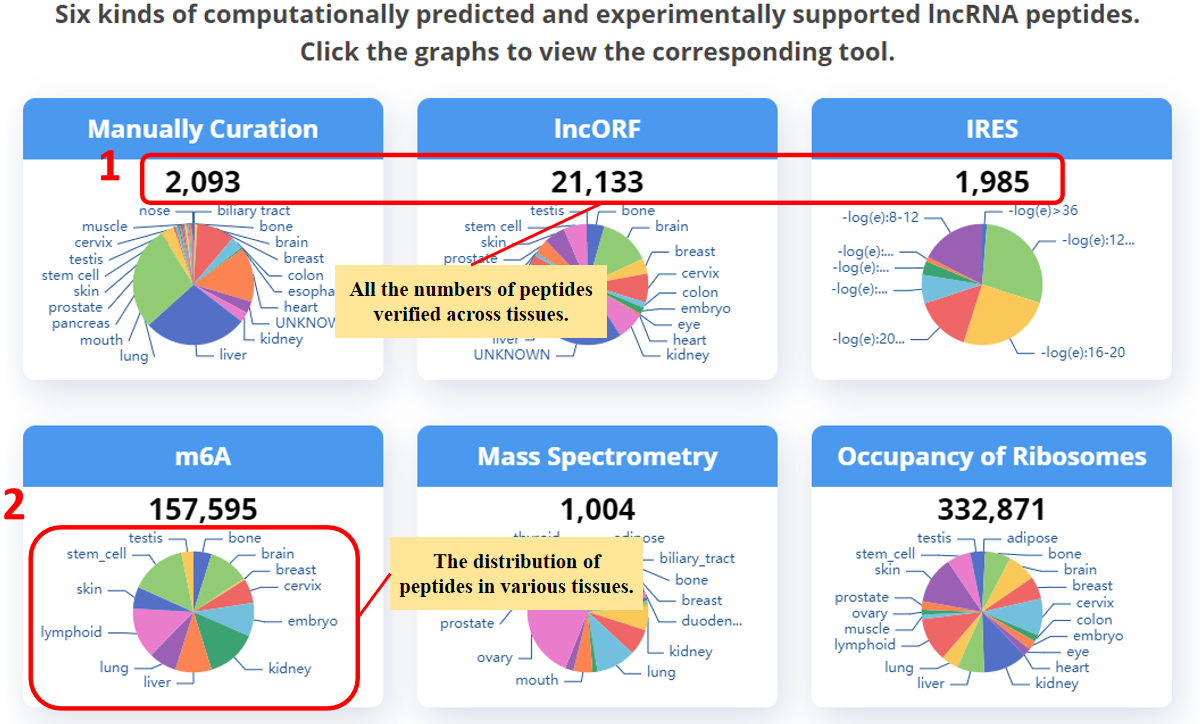
Six kinds of direct and indirect evidences for supporting the encoding potential of lncRNAs.
1. The page displays the number of peptides supported by various experimental evidences.
You can click the graphs to view the corresponding tool.
2. The pie chart shows the distribution of peptides across tissues, except for IRES, which shows the -log10 (eValue) distribution of BLAST alignment results.
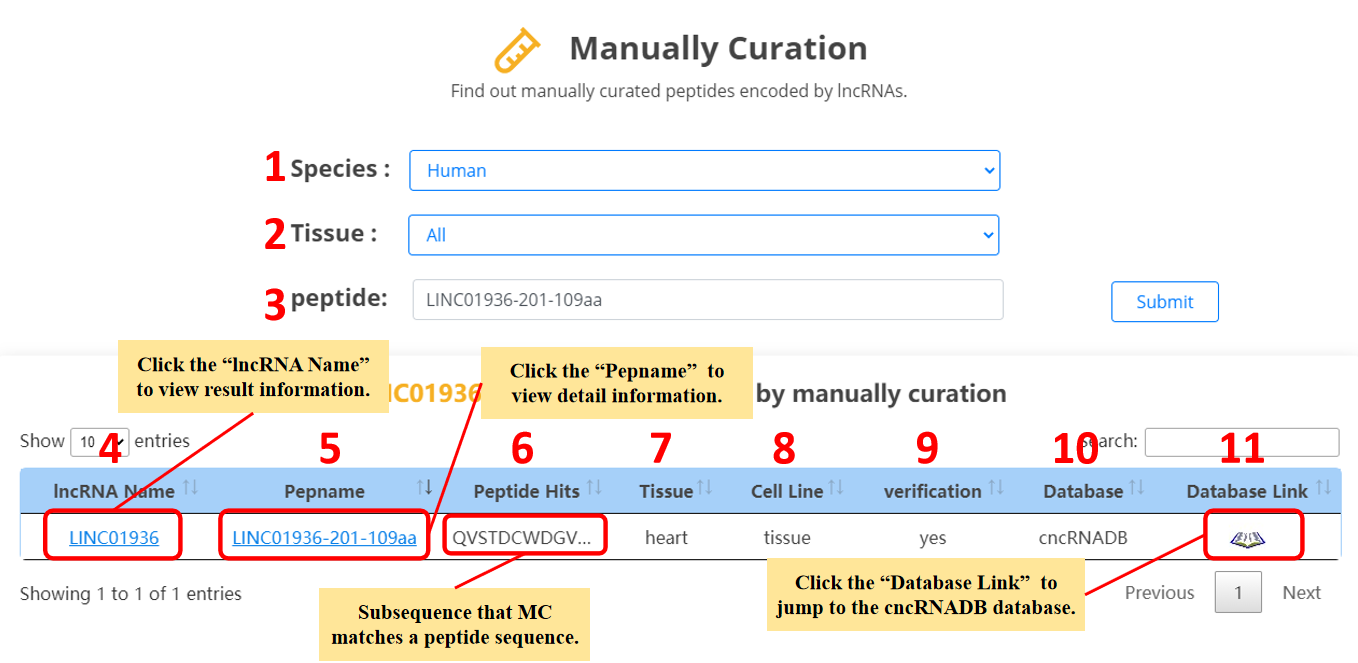
For the lncRNA peptides, we provide manually curated evidences.
1. Select the species.
2. Select the specific tissue or all tissues.
3. Input the peptide name.
4. lncRNA name.
5. Peptide name.
6. The overlap of cncRNADB,EVlncRNA,ncEP or FunCPEP peptides and lncRNA peptides.
7. Tissue.
8. Cell line.
9. Verification.
10. Manually curated database.
11. The link of manually curated database.
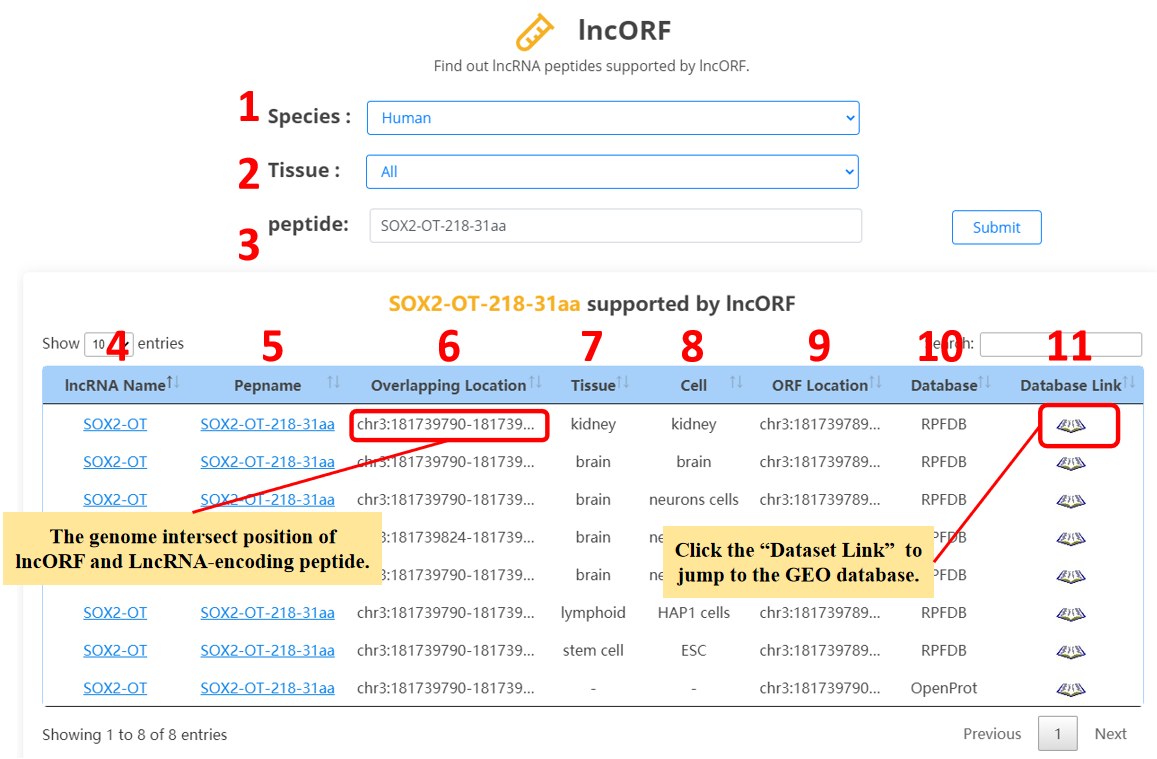
For the lncRNA peptides, we provide lncORF evidences.
1. Select the species.
2. Select the specific tissue or all tissues.
3. Input the peptide name.
4. lncRNA name.
5. Peptide name.
6. The overlap of lncORF and lncRNA peptides.
7. Tissue.
8. Cell line.
9. Genome position of lncORF.
10. Database.
11. Database link.
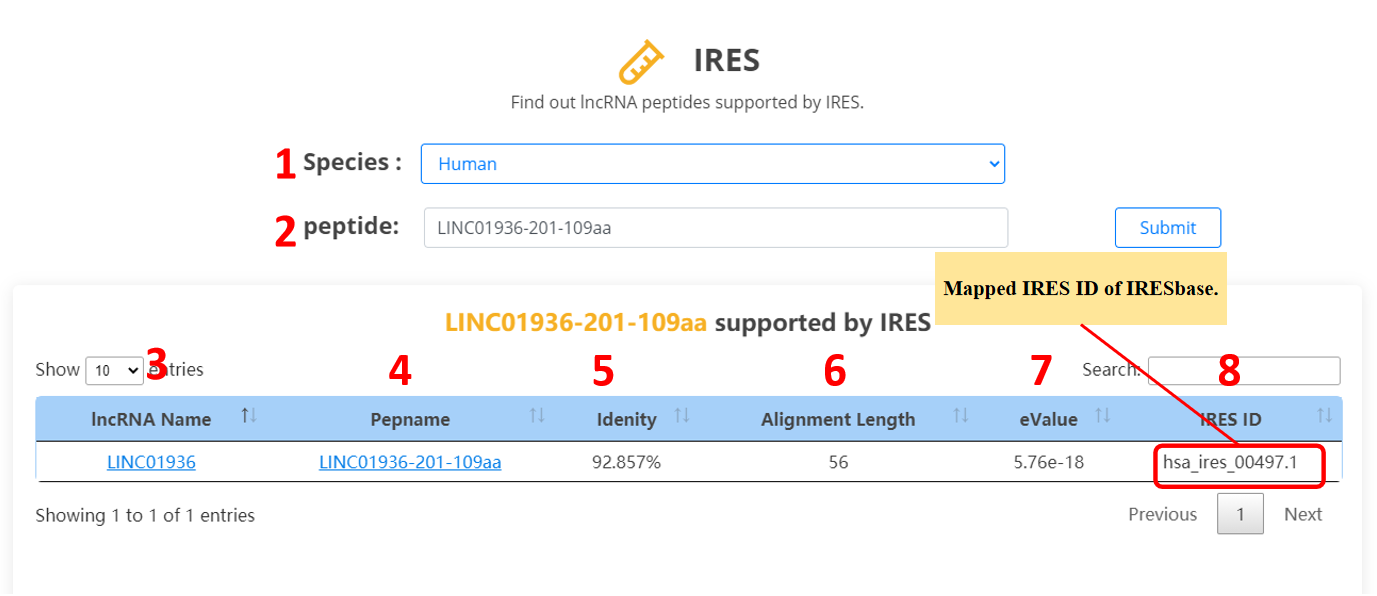
For the lncRNA peptides, we provide IRES evidences.
1. Select the species.
2. Input the peptide name.
3. lncRNA name.
4. Peptide name.
5. Percentage of matching sequence alignment.
6. Length of matching sequence alignment.
7. The possibility of a random match. The higher the eValue, the greater the chance of a random match. If the value is close to zero, the degree of the specific match is higher.
8. The record ID of IRES database.
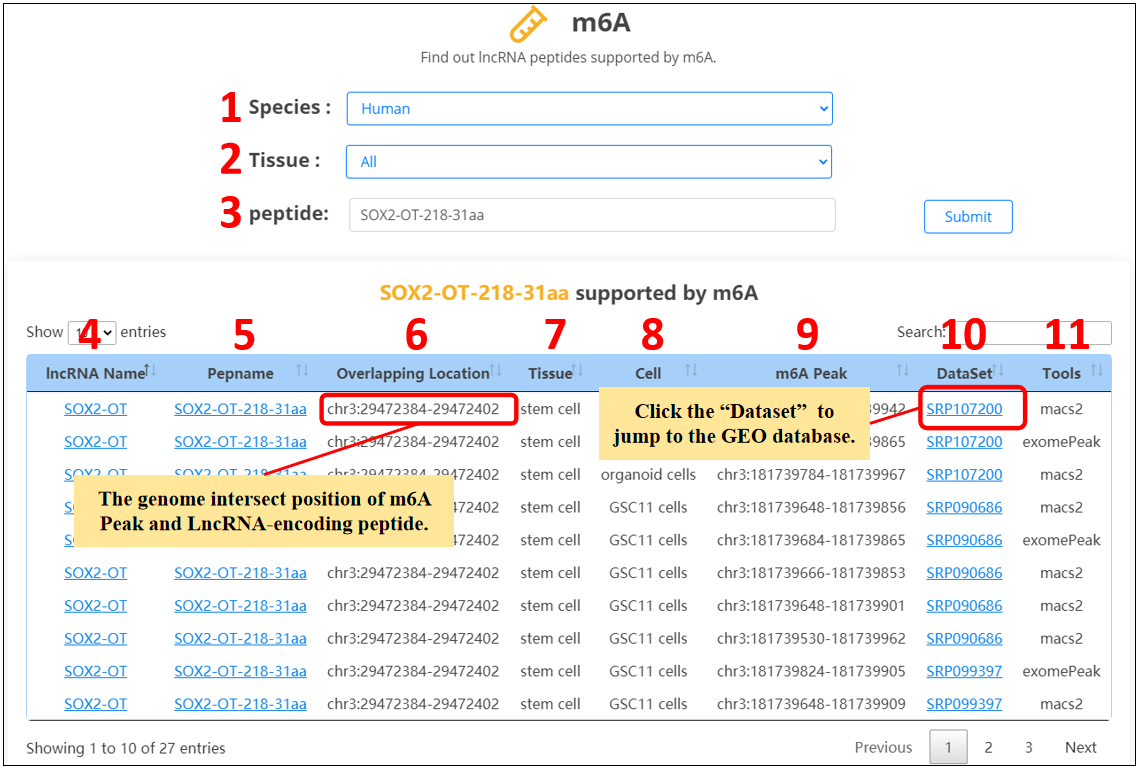
For the lncRNA peptides, we provide m6A evidences.
1. Select the species.
2. Select the specific tissue or all tissues.
3. Input the peptide name.
4. lncRNA name.
5. Peptide name.
6. The overlap of m6A peaks and lncRNA peptides.
7. Tissue.
8. Cell line.
9. Genome position of m6A peaks.
10. SRA or GEO dataset ID.
11. Tools for identifying m6A peaks.
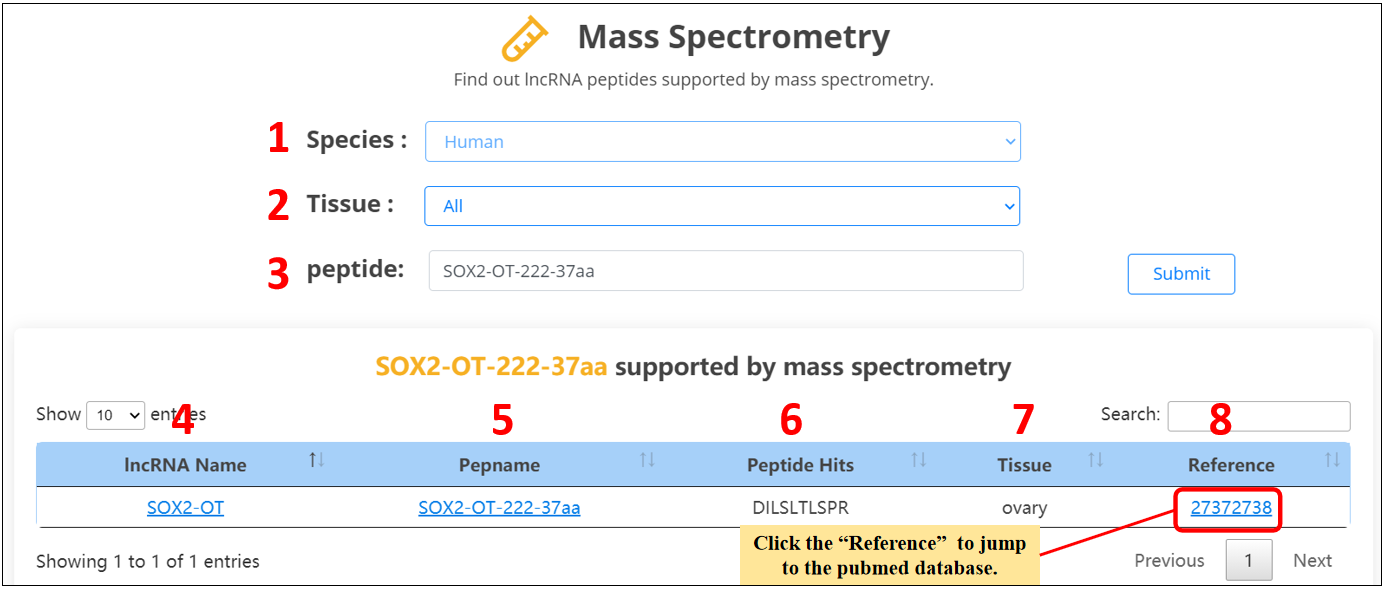
For the lncRNA peptides, we provide mass spectrometry evidences.
1. Select the species.
2. Select the specific tissue or all tissues.
3. Input the peptide name.
4. lncRNA name.
5. Peptide name.
6. The overlap of mass spectrometric peptides and lncRNA peptides.
7. Tissue.
8. Mass spectrometric dataset PubMed ID.
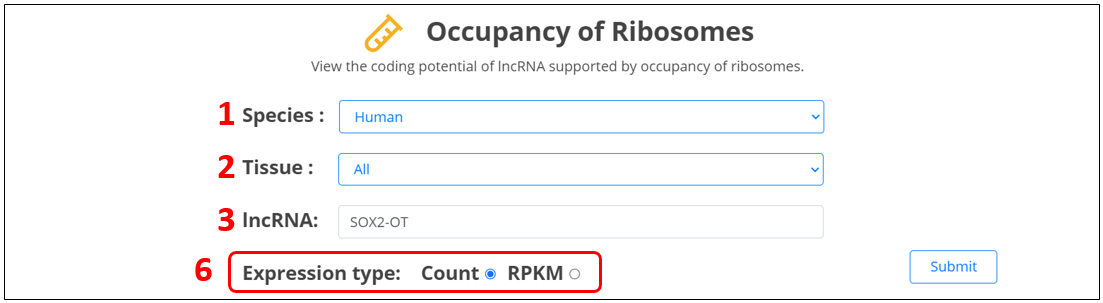
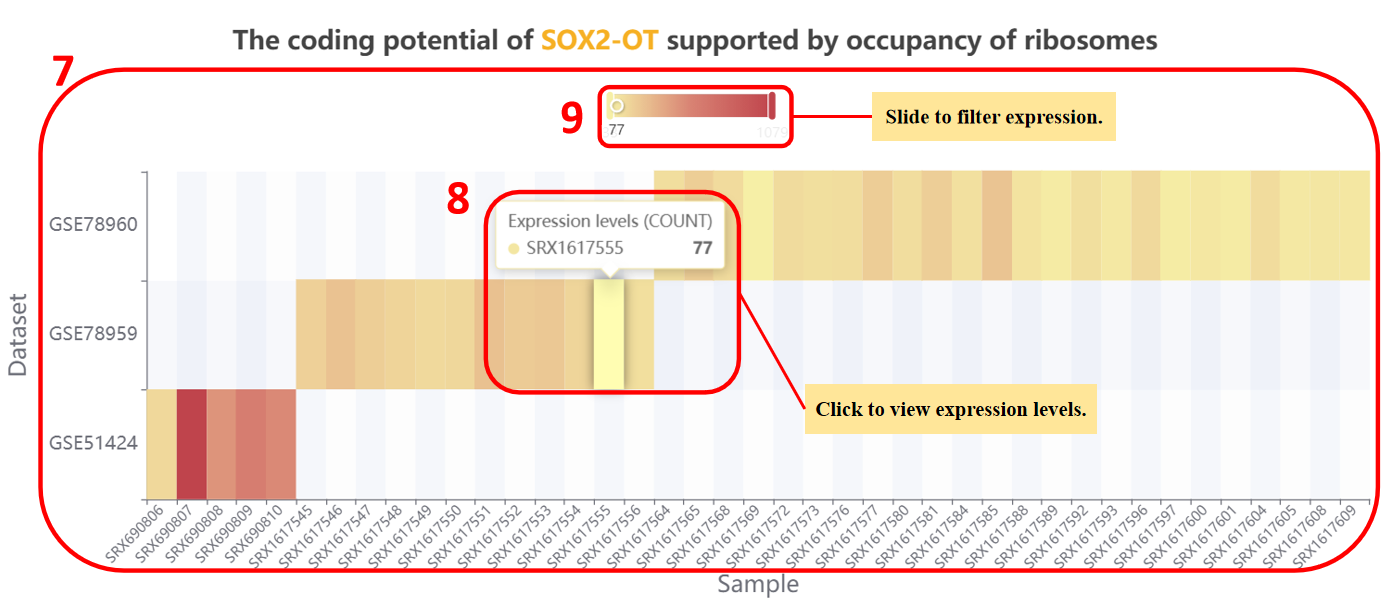
For the coding potential of lncRNA, we provide evidences of occupancy of ribosomes.
1. Select the species.
2. Select the specific tissue or all tissues, if you select “all”, we will show you histogram of lncRNA expression in all tissues;
otherwise, we will only show you heatmap of lncRNA expression in specific tissue.
3. Input the peptide name.
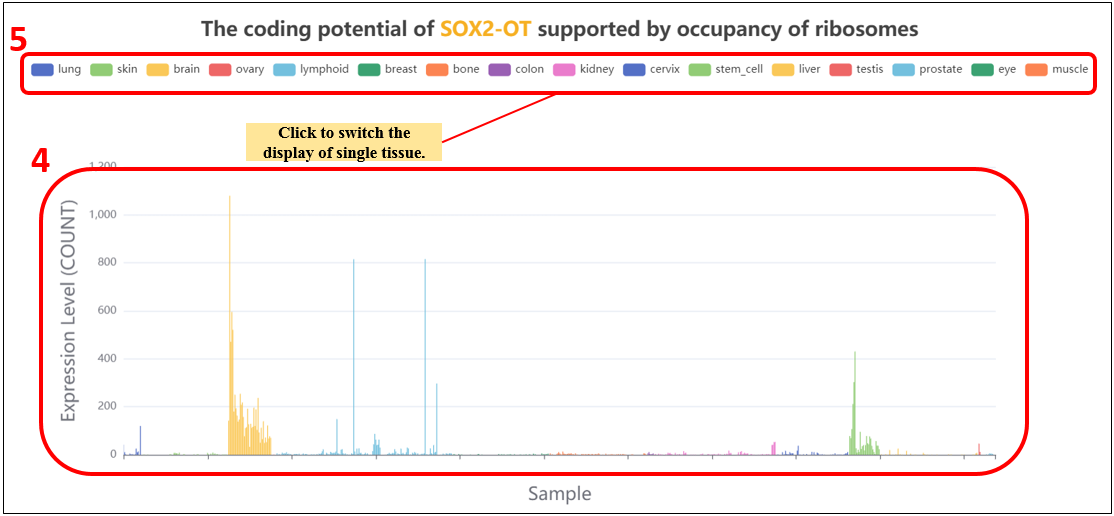
4. The expression levels of lncRNA in all tissues.
5. Click to switch the display of single tissue.
6. Select RPKM or count option and click submit to switch the type of expression value.
7. The expression levels of lncRNA in single tissue.
8. Place the mouse on the color block of the heatmap to display the specific expression level.
9. Drag the slider to change the range of expression.
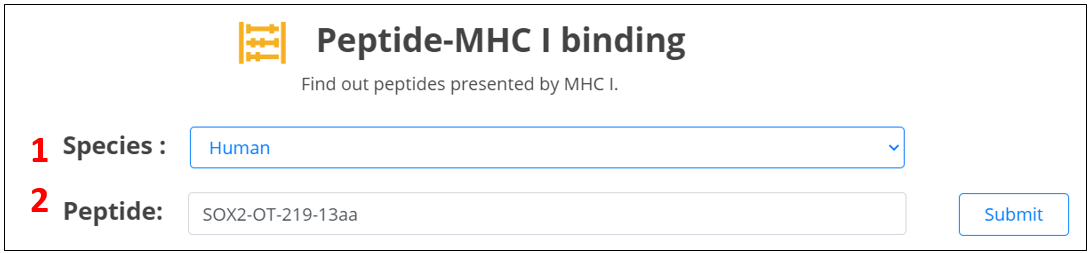
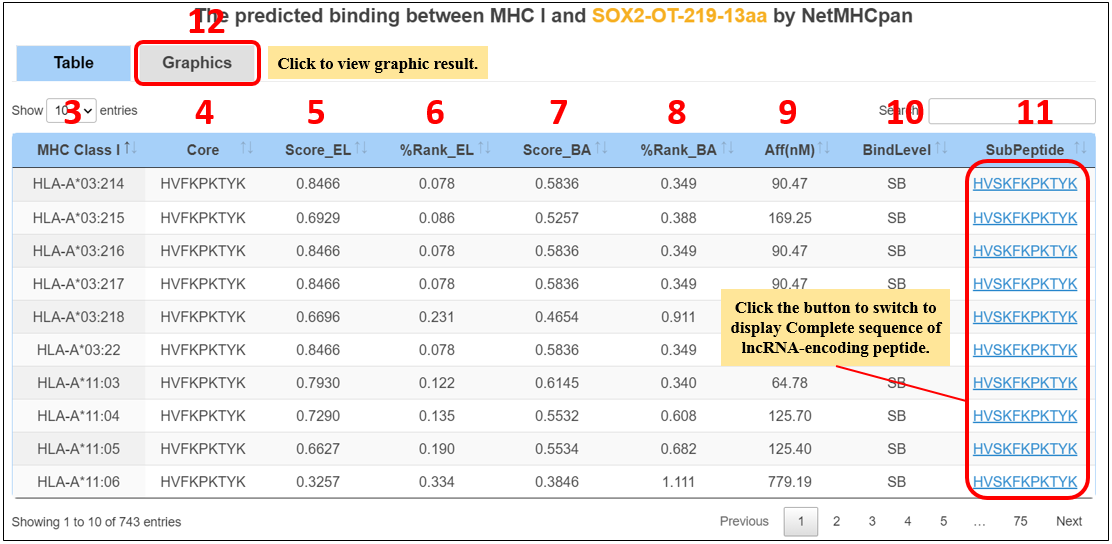
For the lncRNA peptides, we provide candidate neoantigens binding major histocompatibility complex (MHC) class I proteins.
1. Select the species.
2. Input the peptide name.
3. MHC-I alleles.
4. The minimal 9 amino acid binding core directly in contact with the MHC.
5. Eluted ligand prediction score.
6. Rank of predicted affinity compared to a set of 100,000 random natural peptides.
7. The raw prediction score.
8. Percential rank BA value.
9. Predicted IC50 values.
10. SB: strong binder; WB: weak binder.
11. A part of lncRNA peptide sequence.
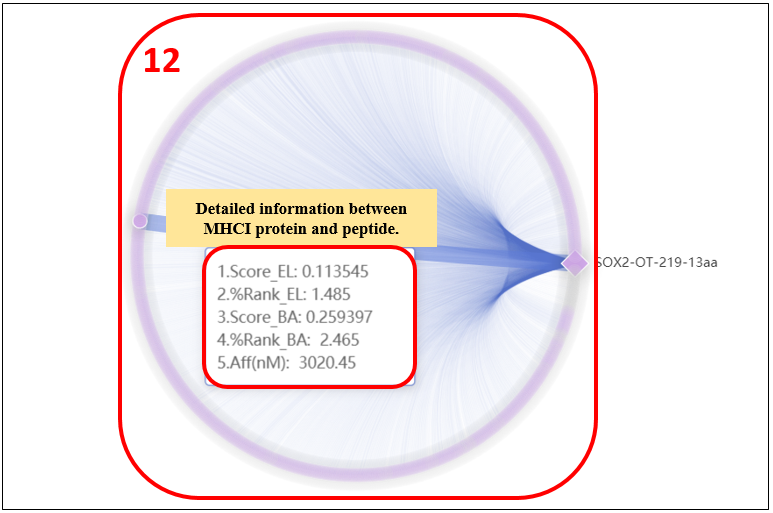
12. Click on the “Graphics” to display graphic results.
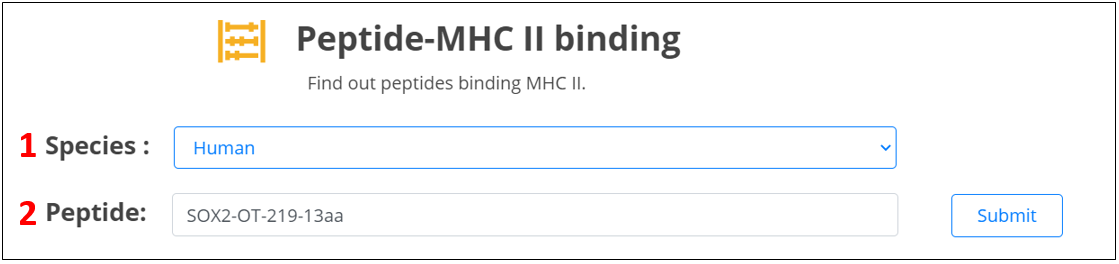
For the lncRNA peptides, we provide candidate neoantigens binding major histocompatibility complex (MHC) class II proteins.
1. Select the species.
2. Input the peptide name.
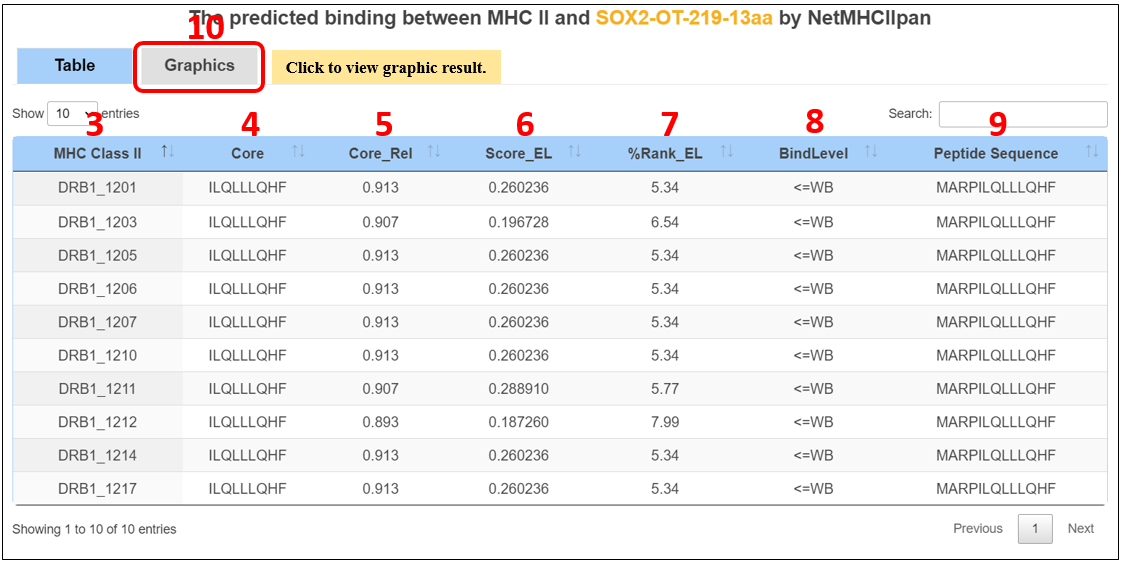
3. MHC-II alleles.
4. The minimal 9 amino acid binding core directly in contact with the MHC.
5. Reliability of the binding core, expressed as the fraction of networks in the ensemble selecting the optimal core.
6. Eluted ligand prediction score.
7. Rank of predicted affinity compared to a set of 100.000 random natural peptides.
This measure is not affected by inherent bias of certain molecules towards higher or lower mean predicted affinities.
8. SB: strong binder; WB: weak binder.
9. Peptide sequences.
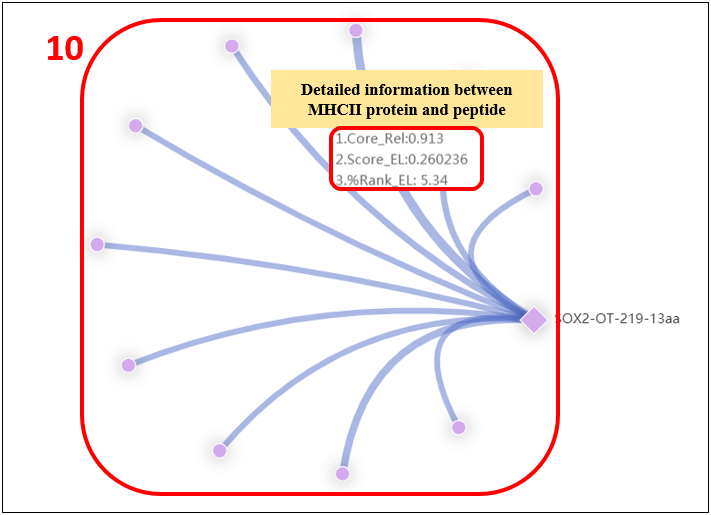
10. Click on the “Graphics” to display graphic result.
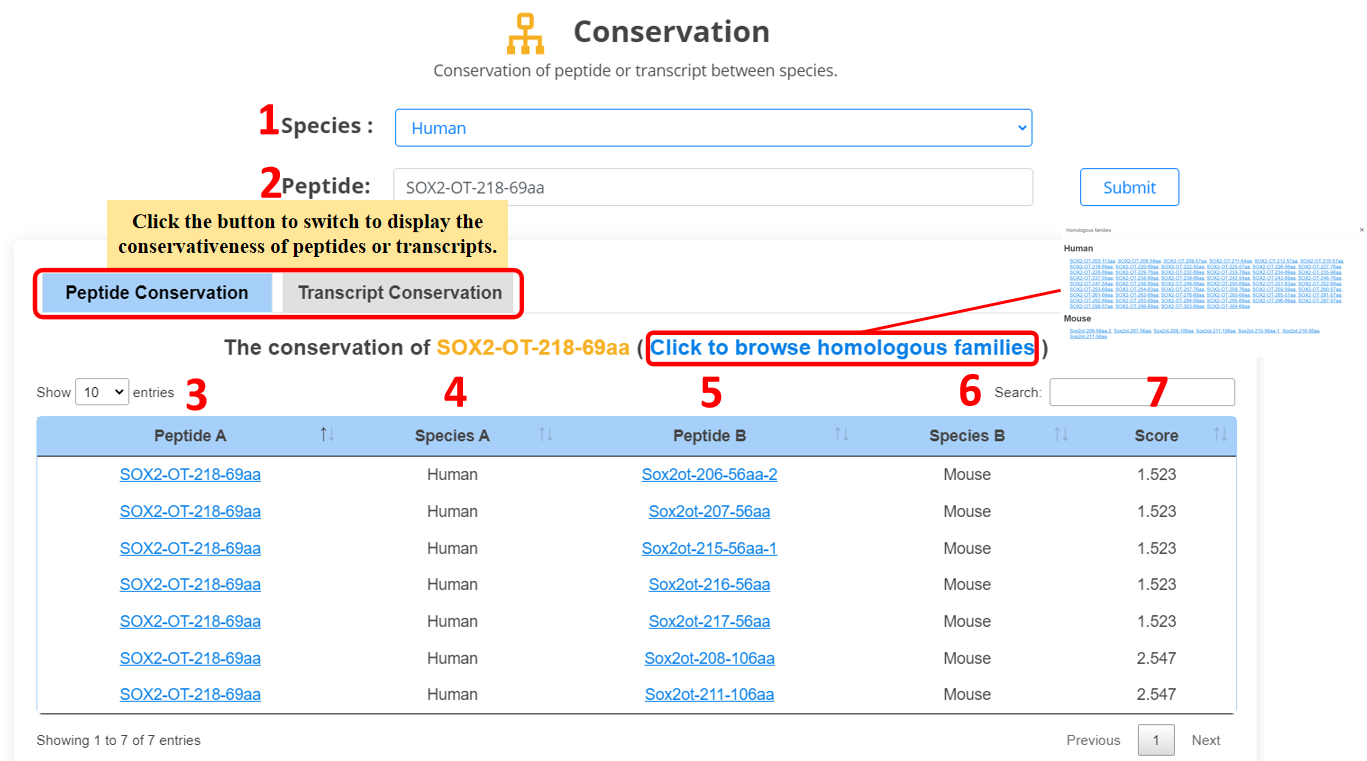
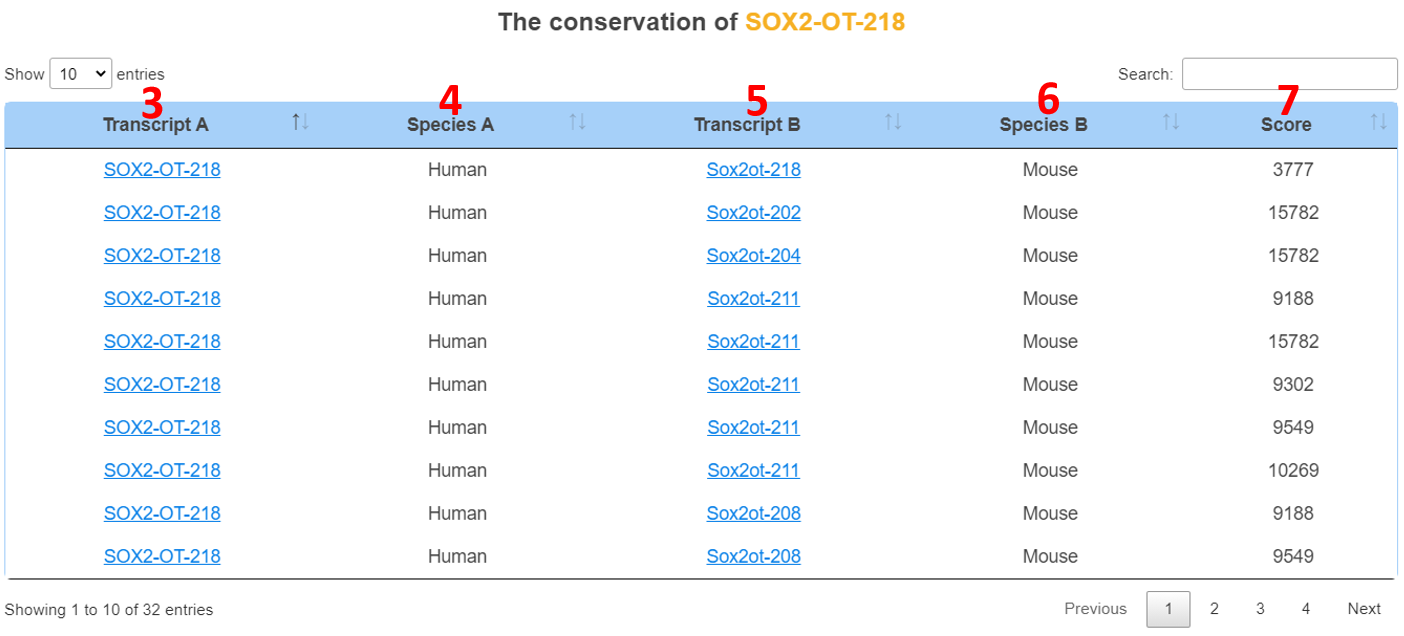
For the lncRNA peptides and lncRNA transcripts,
we provide conservative relationship of lncRNA across three different species.
1. Select the species.
2. Input the peptide name.
3. Peptide/transcript name.
4. Species.
5. Homologous peptide/transcript name.
6. Homologous species.
7. Conservation score (slncky: transcript conservation score; orthoMCL: peptide conservation score).
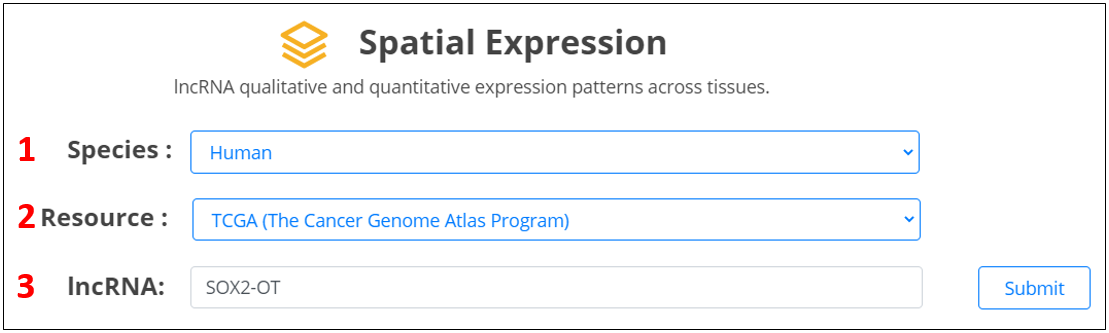
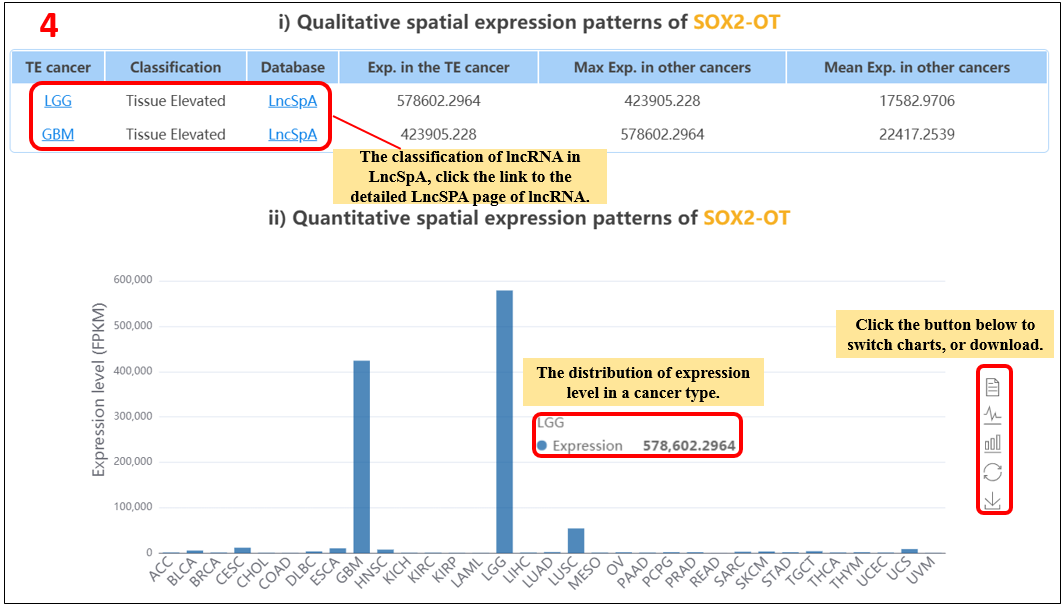
For the lncRNA, we provide qualitative and quantitative expression features of queried lncRNAs across different tissues.
1. Select the species.
2. Select the resource.
3. Input the lncRNA.
4. Show qualitative and quantitative expression patterns of lncRNA across different tissues.
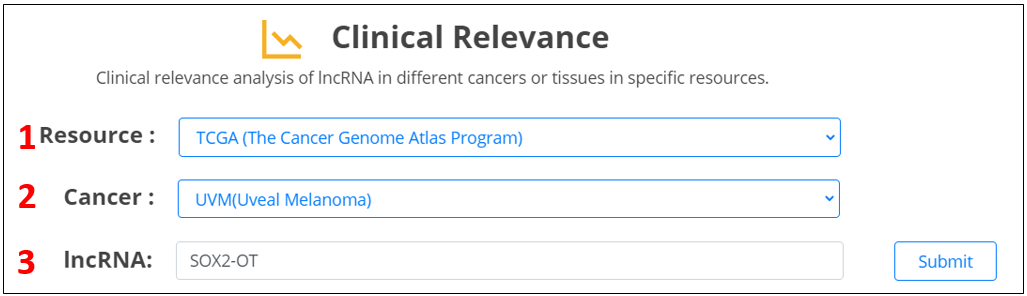
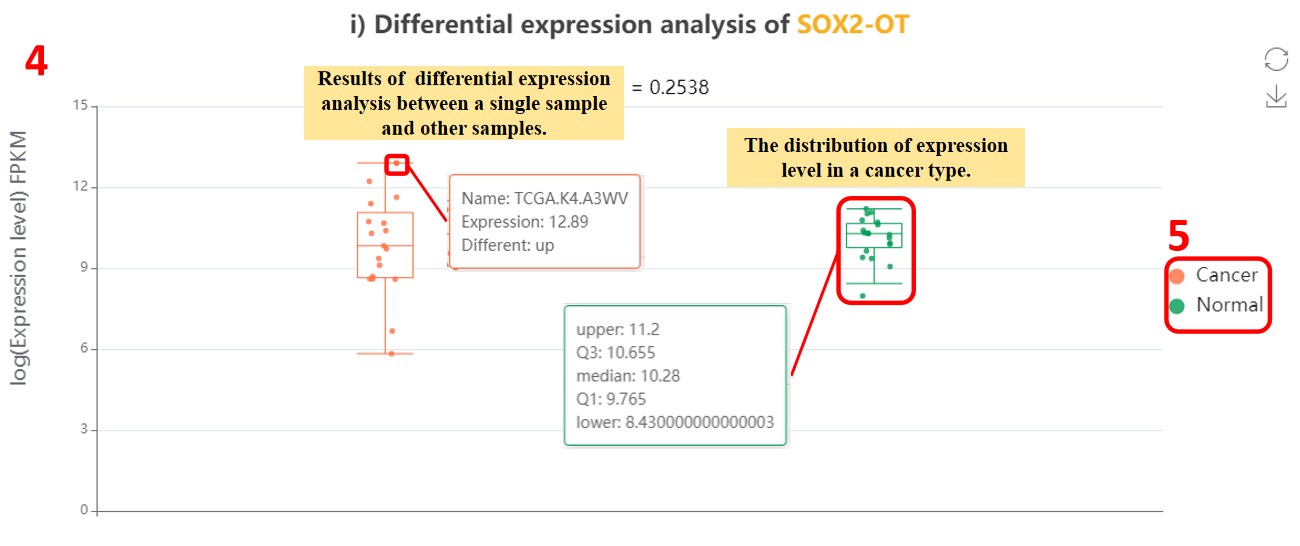
For the lncRNA, we provide differential expression analysis and survival analysis across major types of malignant cancers.
1. Select the resource.
2. Select the cancer.
3. Input the lncRNA.
4. Different expression of lncRNA across cancer types.
5. Click the “cancer” or “normal” button to switch the display of cancer or normal samples.
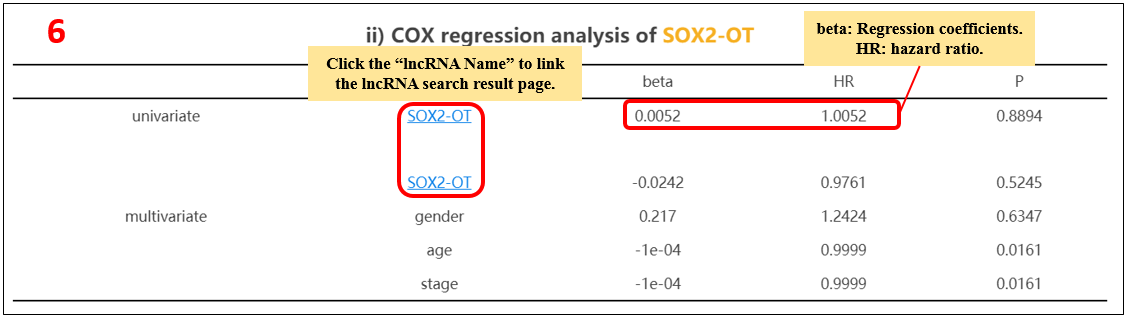
6. Cox regression analysis of the lncRNA.
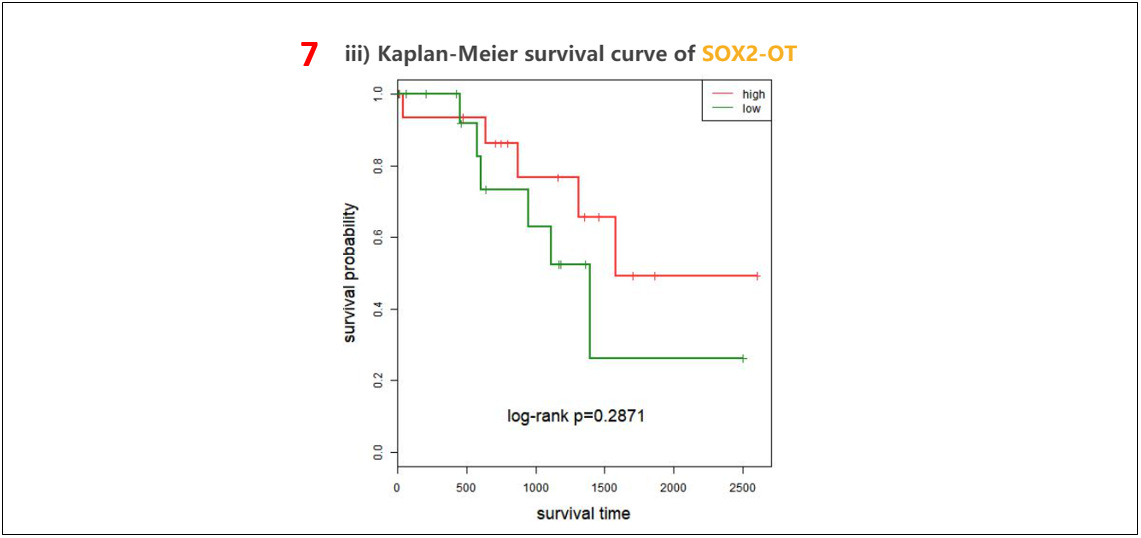
7. Kaplan-Meier survival curve of the lncRNA.