| Home | Analyze | Help | Contact |
How to use lncSubpathway1.data input Click on the "Analyze" button to upload files to website first. Users need to submit three files, including the Gene dataset, LncRNA dataset and corresponding sample labels, then click on the "submit" for further information(Figure 1). It will cost about ten minutes to get the result. |
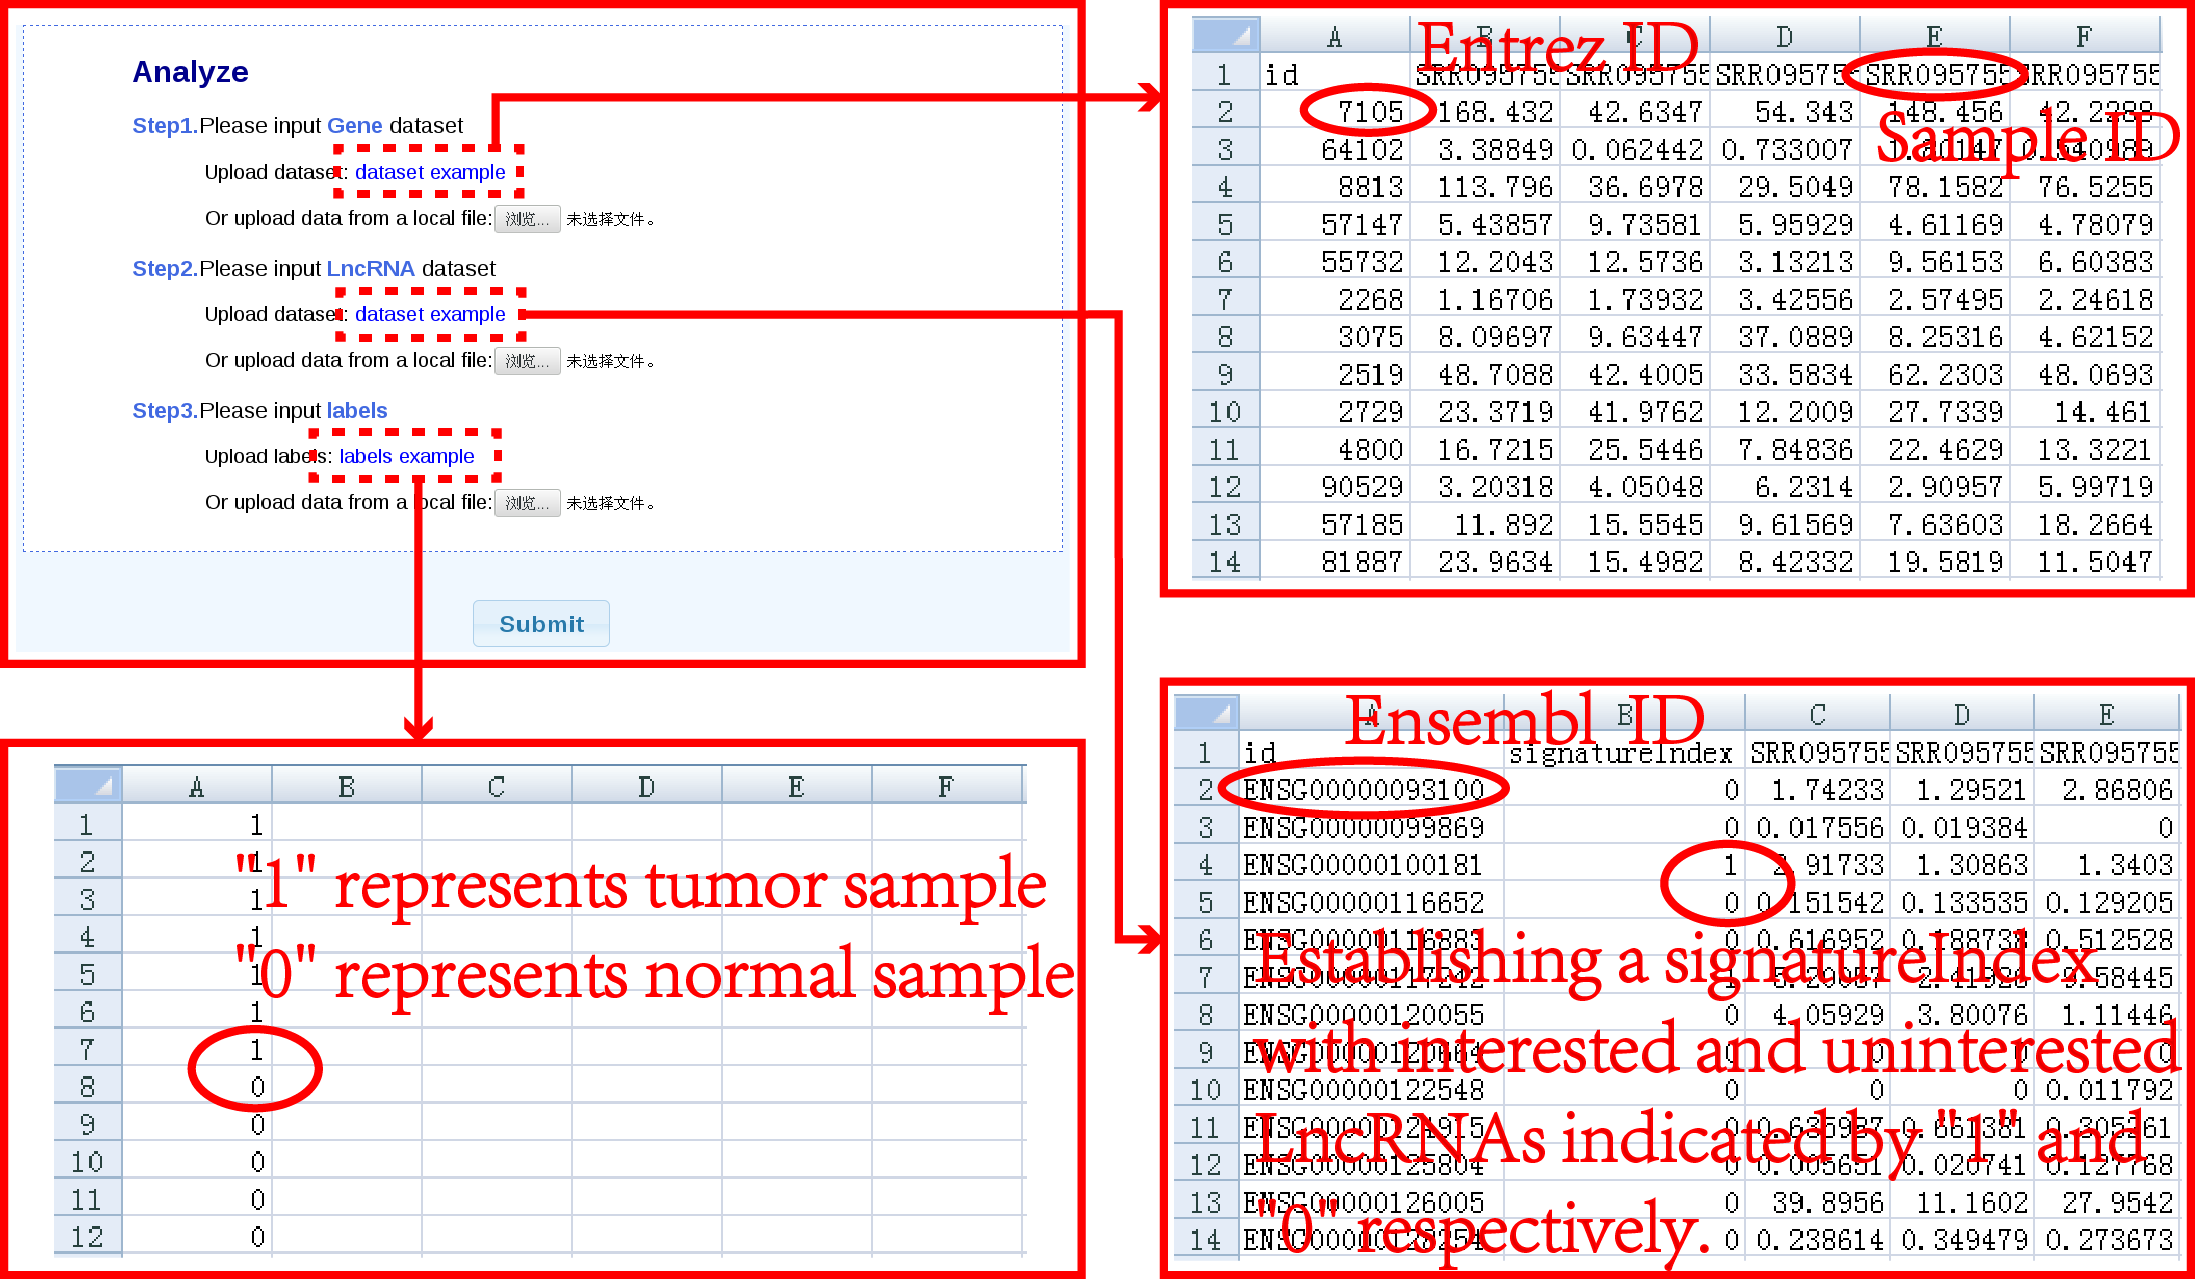 |
| Figure 1. Data input and parameter selection. |
|
2.result display A data table shows when the job is accomplished. The descriptions of each entry are contained PathwayID, PathwayName, view, ComponentNum, Pvalue.Node and Pvalue.Edge. Click on the "PathwayName" or "view" in entries can visualize subpathway graphs in KEGG or Cytoscape respectively. The result will be show as below(Figure 2). PathwayID: the subpathway ID PathwayName: the subpathway name View: click to visualize subpathways ComponentNum: the number of PCGs in subpathways and the number of lncRNAs/ key lncRNAs associated with the corresponding subpathway Pvalue.Node: P-value that obtained by node permutation Pvalue.Edge: P-value that obtained by edge permutation Pvalue.Combined: the joint Pvalue of subpathway FDR.Combined: the correction for Pvalue.joint by using ‘BY’ method |
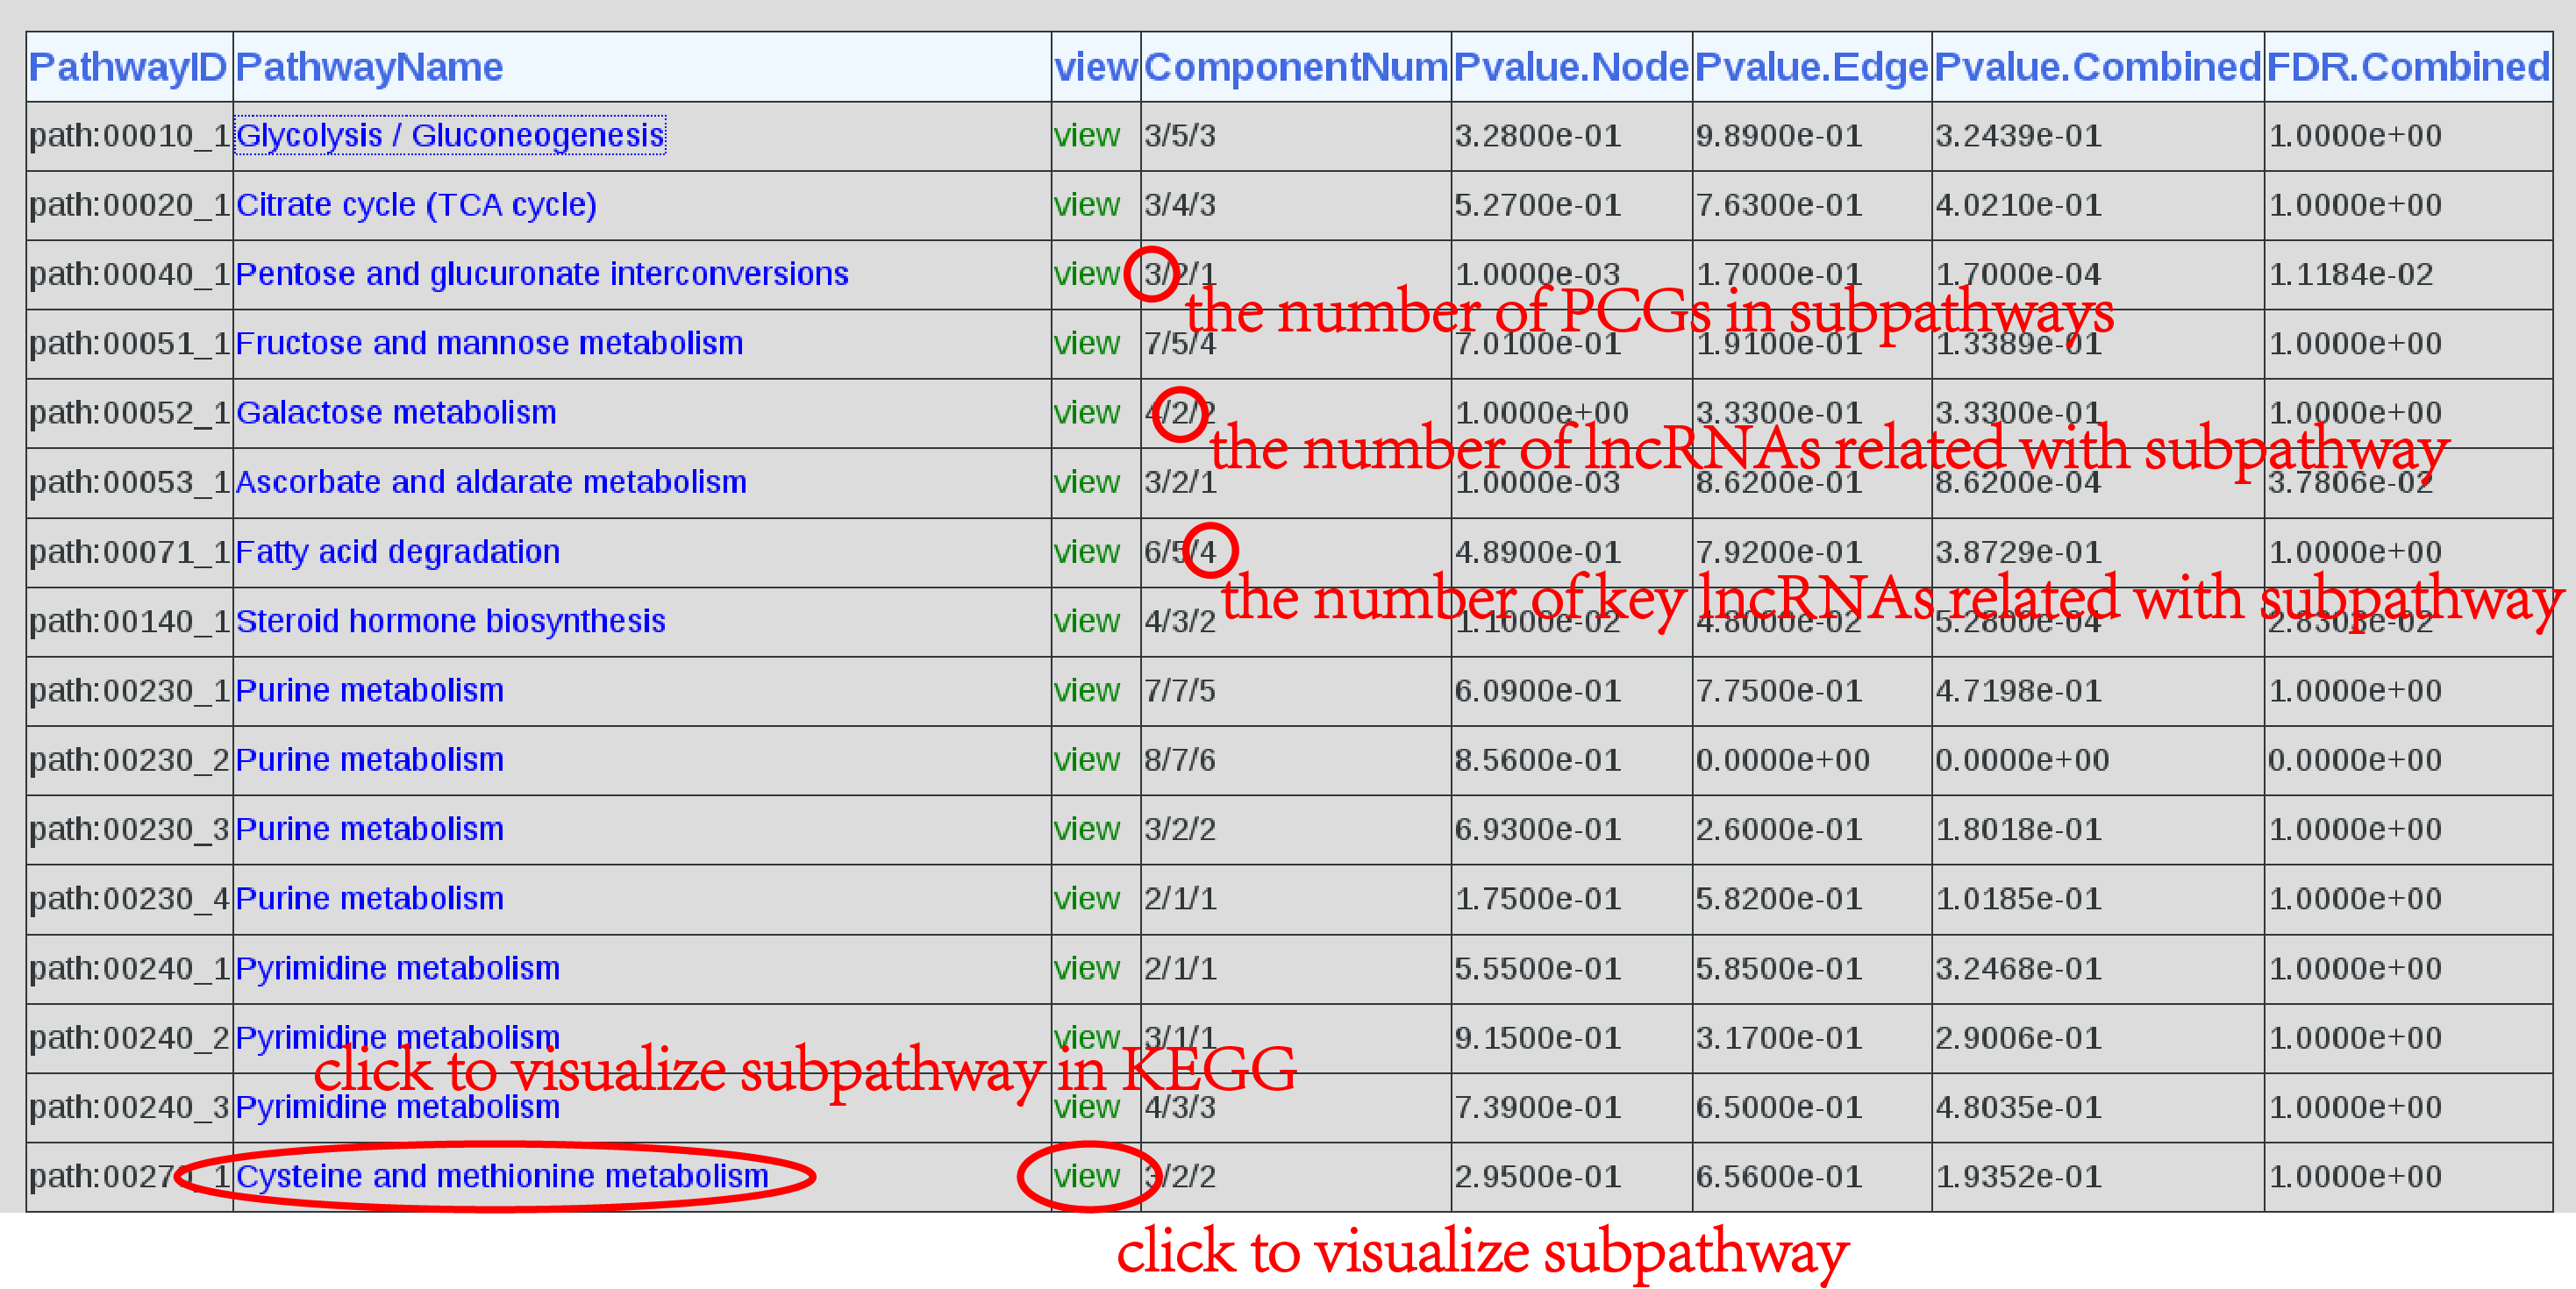 |
| Figure 2. Result. |
|
3.Visualization The LncSubpathway system provides two flexible ways to visualize subpathways. By clicking on the names of pathways in the result table, another page shows(Figure 3). There is corresponding subpathway graph in KEGG with annotated nodes in red. The node color correspond to node weight which is obtained by considering the differential expression of gene between the study condition and corresponding control state, the differential expression of lncRNAs related with the given gene node and the change of the correlation between gene and lncRNAs. |
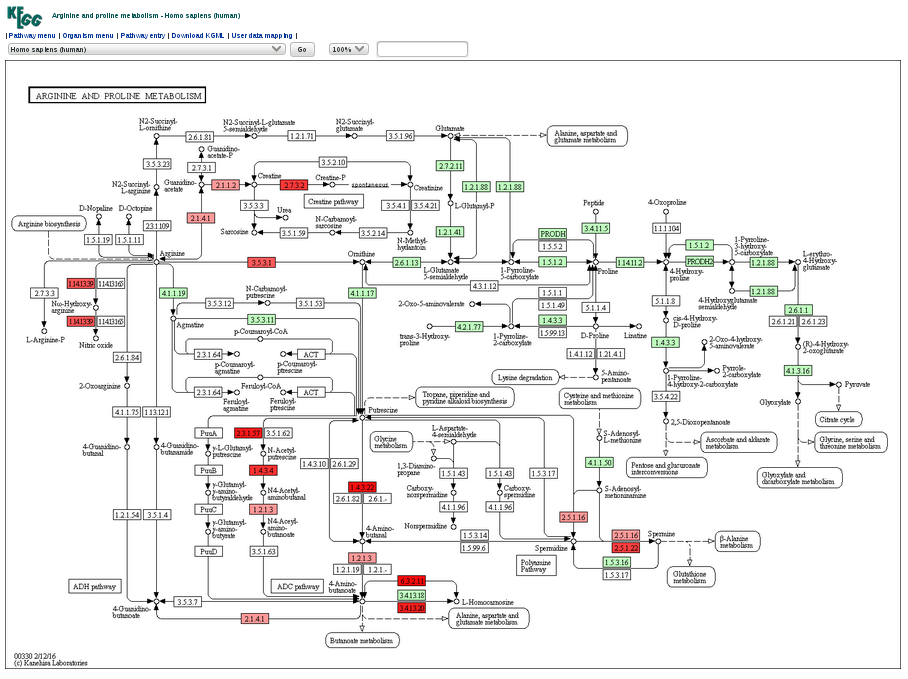 |
| Figure 3.KEGG Graph. |
| By clicking on the “view” button in the result table, it will open another page that displays a subpathway graph with all annotated nodes created by R and displayed by cytoscape plugin(Figure 4). It is a user friendly graph, the nodes can be dragged to anywhere and the graph size can also be modulated by a menu at the bottom right of the graph. |
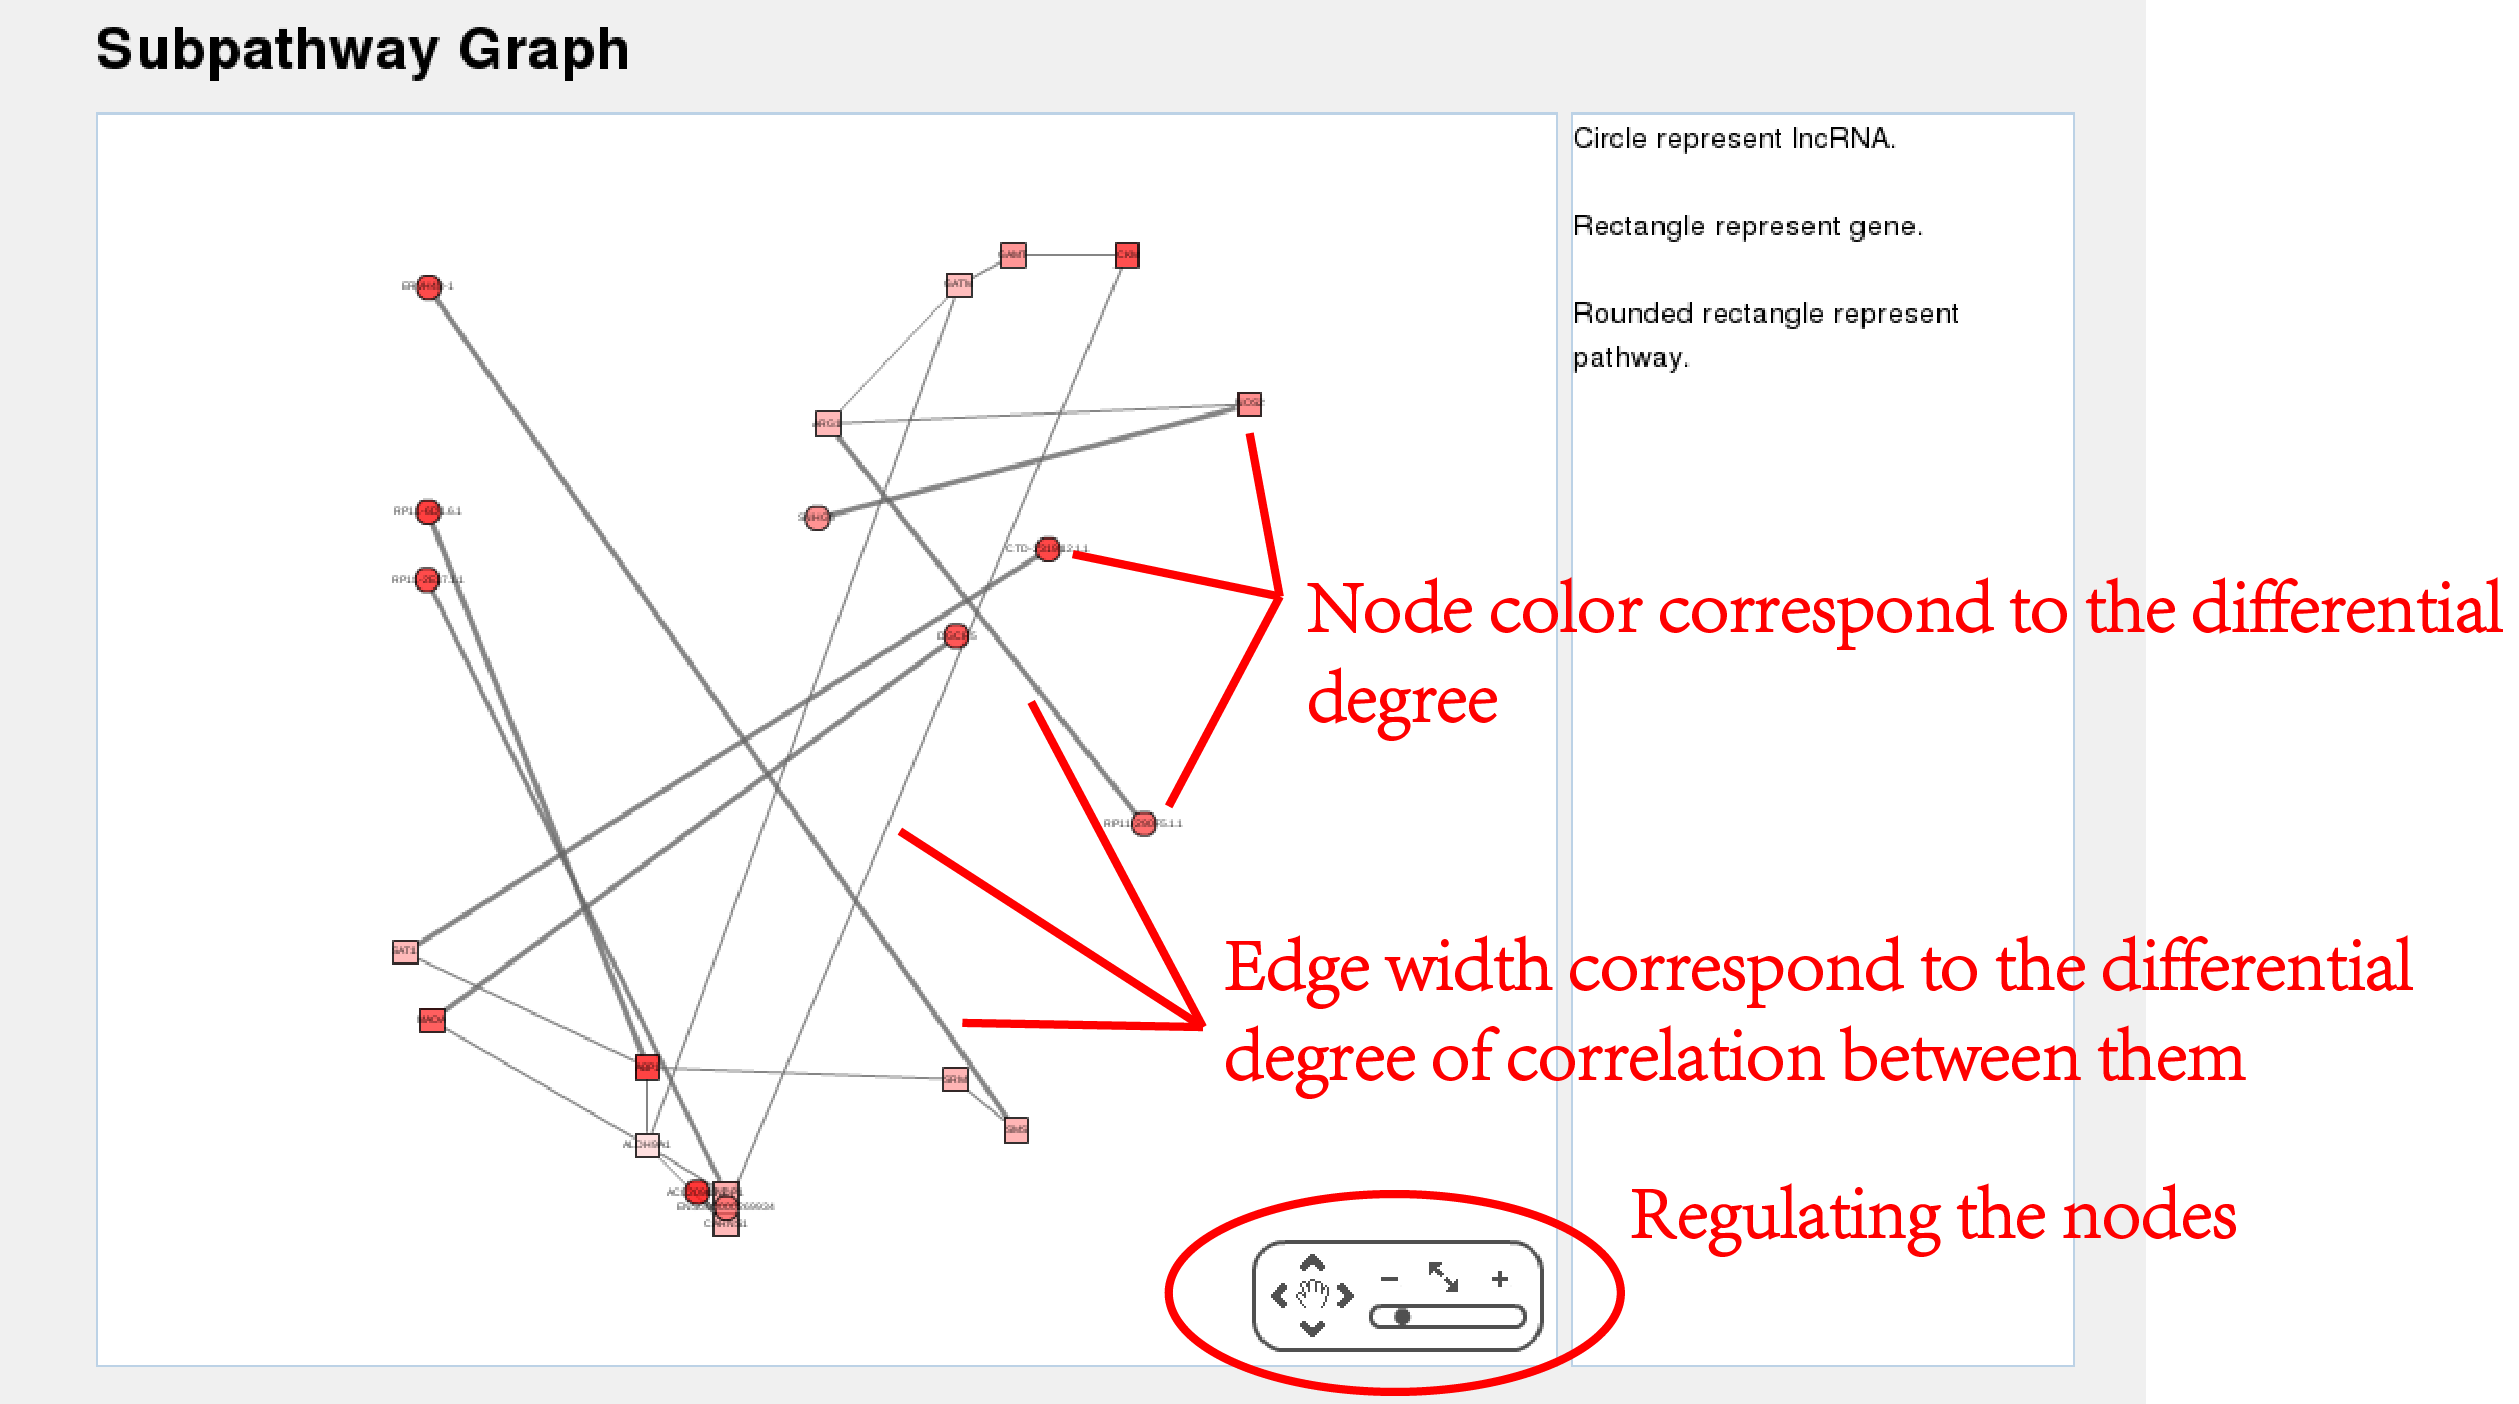 |
| Figure 4.Subpathway Graph. |
4.Download all result. At the botton of the page,clicking on "Download"(Figure 5). |
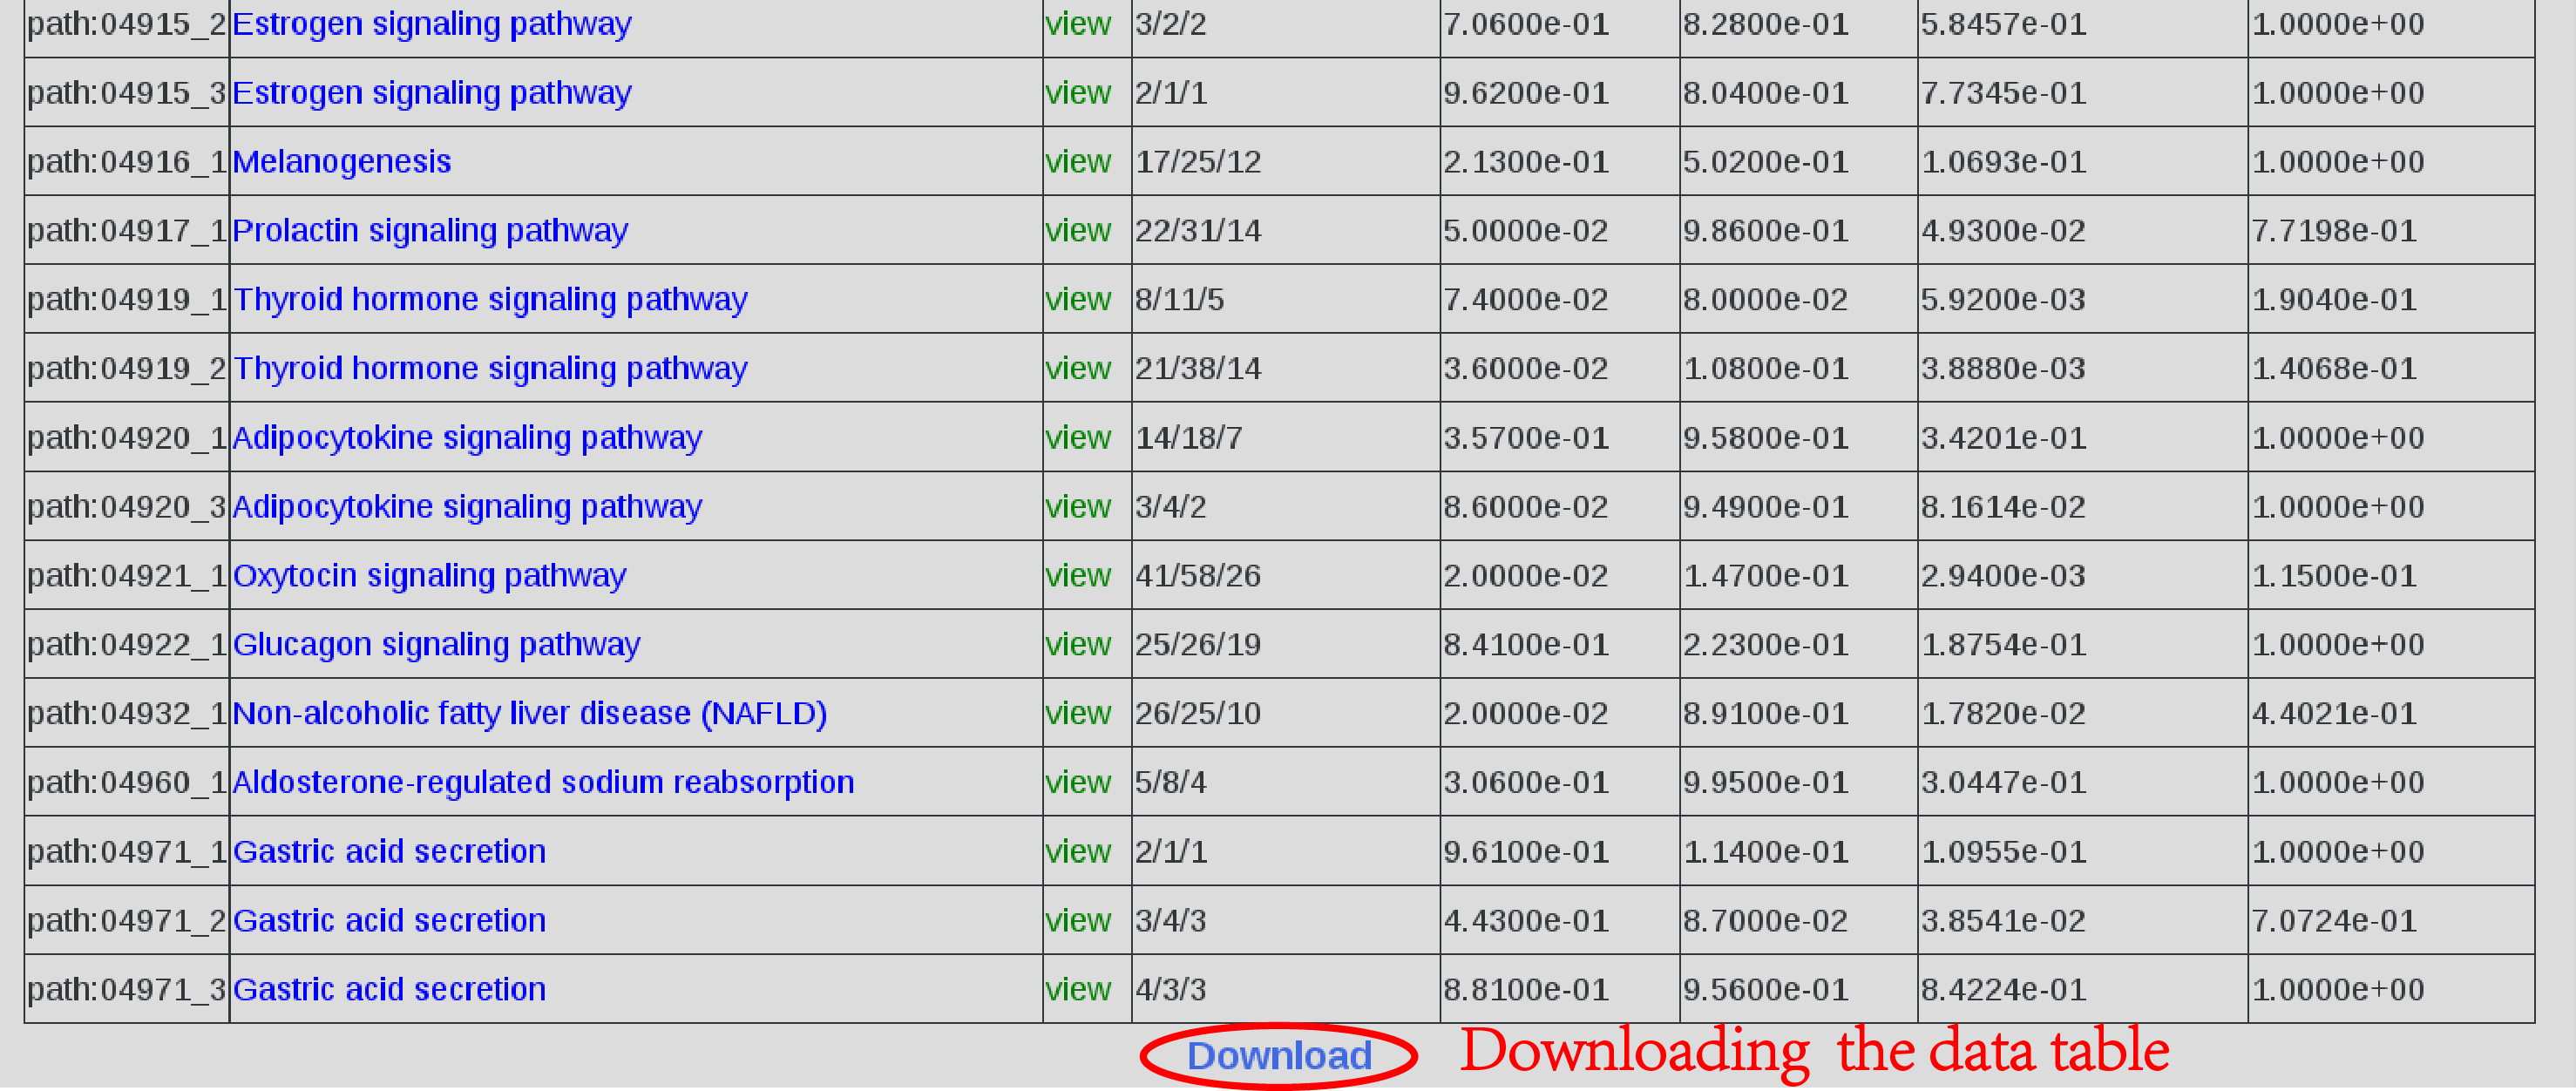 |
| Figure 5.Download. |
|
|||

