RNAactDrug 2.0 Introduction
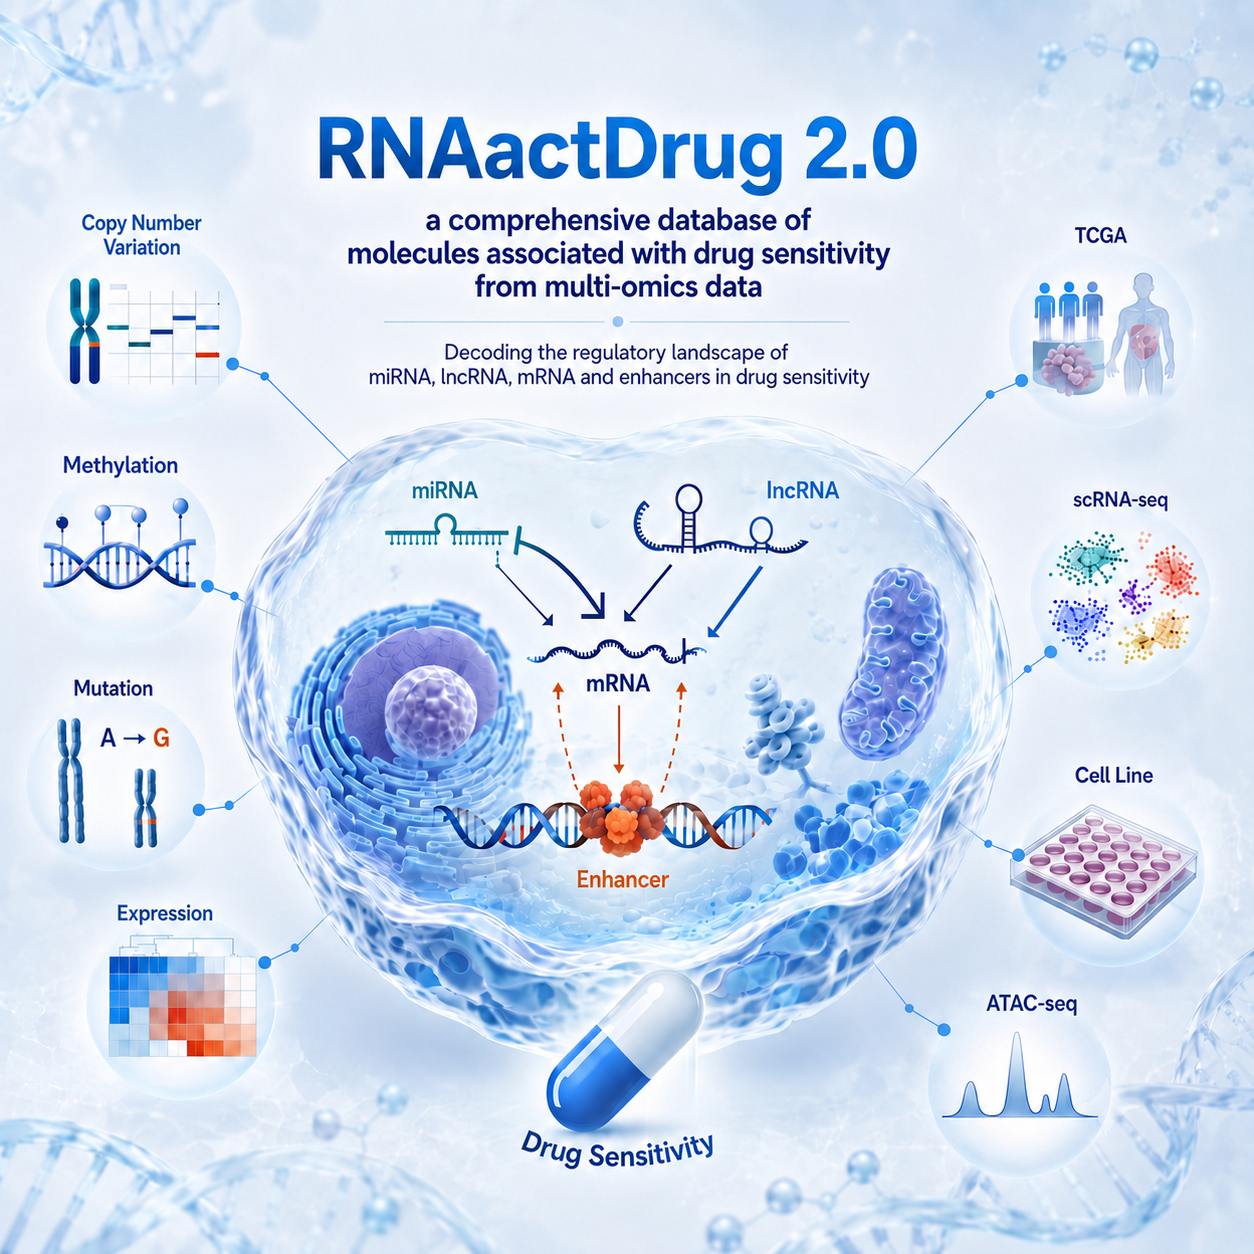
RNAactDrug 2.0 is an updated resource for systematically exploring RNA molecules and enhancer regulatory elements associated with drug sensitivity from multi-omics data. 
We construct a public database, RNAactDrug 2.0, an updated public database for systematically exploring RNA molecules and enhancer regulatory elements associated with drug sensitivity across multi-omics datasets.
RNAactDrug 2.0 represents a major update to our previously published RNAactDrug database, featuring substantial improvements in data scale, molecular coverage and analytical capacity. The original resource was introduced in the paper RNAactDrug: a comprehensive database of RNAs associated with drug sensitivity derived from multi-omics data. Since its publication, this work has attracted widespread attention and accumulated 54 citations. Notably, 46% of these citations were obtained in the past two years, and its citation count is around 6.6 times the average number of citations for papers in the same research field.
main
Cancer drug sensitivity research is critical for advancing personalized therapy and precision medicine. Tumor drug resistance is a major challenge in cancer therapy and a key cause of treatment failure and poor clinical outcomes. Studies have shown that drug sensitivity are closely associated with molecular dysregulation across multiple omics layers, including expression, copy number variation, methylation, and mutation, and are also profoundly influenced by aberrant remodeling of enhancer regulatory networks. Given the complexity of drug response mechanisms, integrative multi-omics analysis is essential for systematically understanding resistance mechanisms. RNAactDrug 1.0 has been widely used as an important resource for drug–RNA association studies. Therefore, with the rapid growth of pharmacogenomics and multi-omics data, there is an urgent need to upgrade RNAactDrug to version 2.0, providing more comprehensive data support and enhanced analytical capabilities.
We have substantially upgraded the RNAactDrug 2.0 database through large-scale data expansion and enhanced analytical capabilities, including:
Integrates large-scale pharmacogenomic datasets from GDSC, CellMiner, CCLE, and PubChem, covering 1346 cancer cell line samples at four molecular levels (expression, copy number variation, methylation, and mutation) for systematic characterization of drug sensitivity-related molecular features.
Incorporates 30,890 drugs, 38,908 RNA molecules (including 19,887 mRNAs, 17,058 long non-coding RNAs (lncRNAs), and 1,963 microRNAs (miRNAs)), and 22,800,375 RNA molecule–drug sensitivity associations across four molecular layers.
Constructs an enhancer-mediated epigenetic regulation–drug sensitivity association landscape, incorporating 15,991 drugs, 54,393 enhancer elements, 25,889 enhancer target genes, and 23,635,715 enhancer–drug sensitivity associations.
Combines TCGA multi-omics data spanning 10,237 tumor samples, and matched clinical profiles, alongside 3,843,186 cells from 208 scRNA-seq datasets across 38 tissues and 44 cancer types for single-cell drug sensitivity analysis.
Upgrades search and browse functionalities to enable efficient and user-friendly data retrieval and exploration.
Provides 7 analytical tools for functional annotation, pan-cancer analysis, tumor microenvironment profiling, single-cell trajectory and CNV analysis, and enhancer regulatory network construction.
RNAactDrug 2.0 has evolved from a single drug–RNA association database into a comprehensive multi-omics and multi-scale analytical platform. Leveraging a substantially optimized multi-dimensional search system and massively expanded data resources, it enables efficient and systematic mining of drug sensitivity-related RNAs and enhancer regulatory elements, while providing crucial support for uncovering drug resistance biomarkers and developing personalized therapeutic strategies.
Search/Drug-RNA
The Drug-RNA module is designed to between RNA molecules and drug sensitivity based on multi-omics datasets, including expression, copy number variation (CNV), methylation, and mutation profiles.
The system provides two flexible search modes:
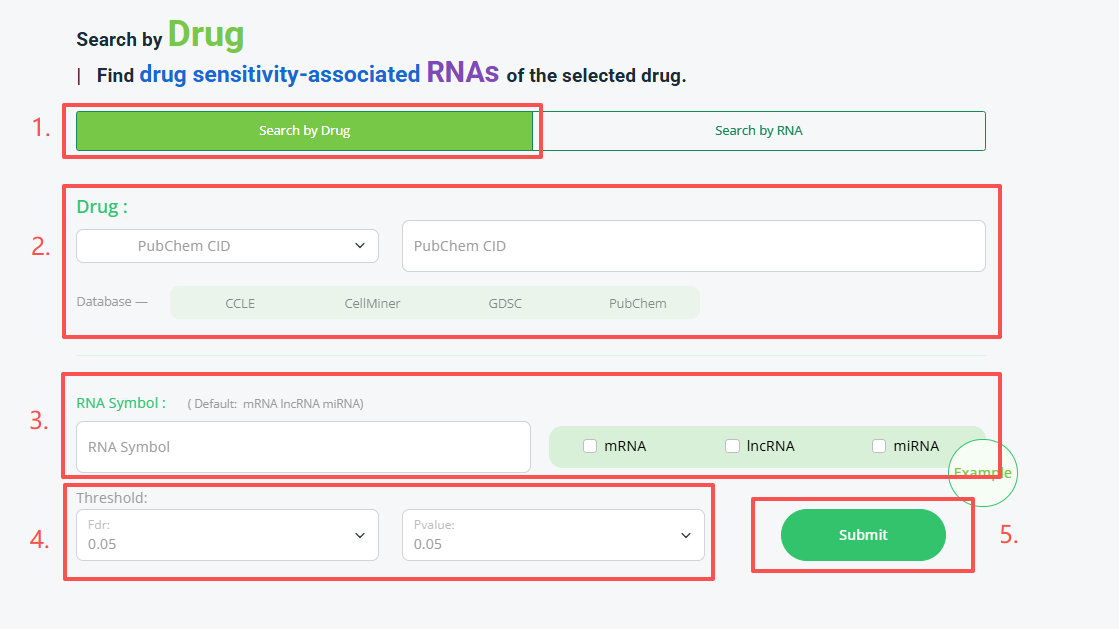
Search by Drug: Identify RNA molecules associated with a specific drug.
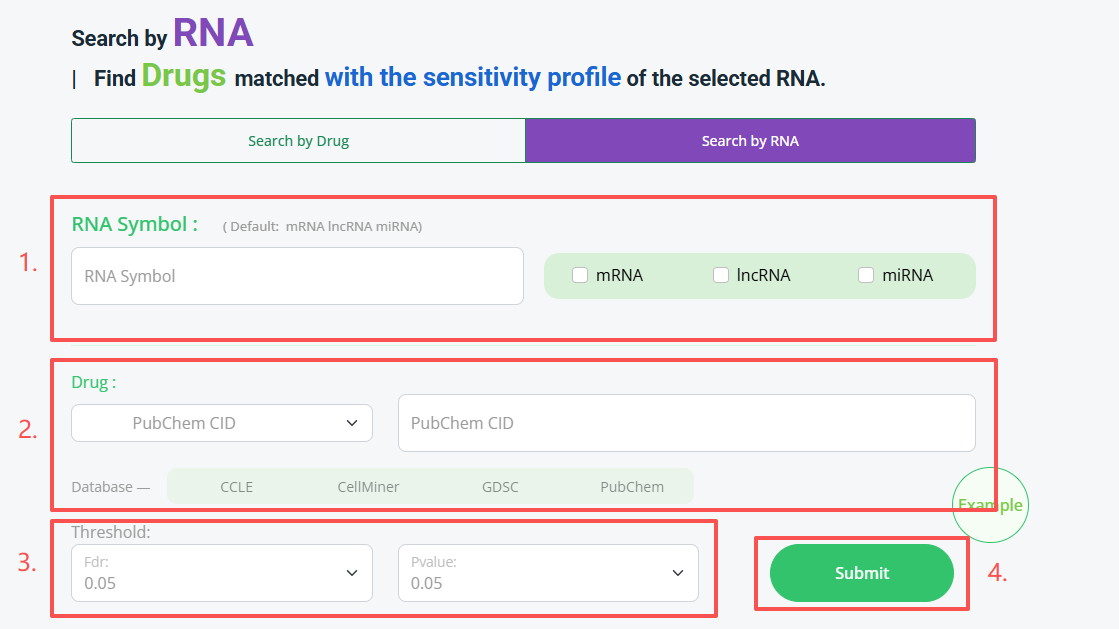
Search by RNA: Identify drugs associated with a specific RNA molecule.
Mode 1: Search by Drug
If you are interested in a specific drug and aim to identify potential RNA targets or molecular biomarkers associated with drug response, follow the steps below:
1. Select drug identifier type (required):
Select the drug identifier type from the Drug dropdown menu, including PubChem CID, Drug Name, and SMILES.
2. Enter drug information (required):
Enter drug-related keywords in the input box. The system will perform fuzzy matching based on the input and automatically display candidate drugs. The corresponding data sources of the selected drug, including CCLE, CellMiner, GDSC, and PubChem, will be automatically indicated.
3. Set RNA filtering conditions (optional):
Enter the target RNA name in the RNA Symbol input box to retrieve RNA molecules associated with the selected drug. If no matching RNA is found, the system will display “No result”. If the RNA Symbol field is left empty, all RNA molecules associated with the selected drug will be returned by default. Users can further filter RNA molecules by selecting RNA types, including mRNA, lncRNA, and miRNA. If no RNA type is selected, all RNA types will be searched by default.
4. Set statistical filtering thresholds (Threshold):
Select the desired FDR and P-value thresholds according to the analysis requirements. The system supports three significance levels: 0.05, 0.01, and 0.001.
5. Submit the search:
After completing all parameter settings, click the Submit button to retrieve drug–RNA association results that meet the specified criteria.
main
Mode 2: Search by RNA
If you are interested in a specific RNA molecule and want to identify drugs associated with its sensitivity profile, follow the steps below:
1. Enter RNA symbol (required):
Enter the RNA molecule name of interest in the RNA Symbol input box. The system will automatically match the corresponding RNA information. Users can also pre-select RNA types (mRNA, lncRNA, or miRNA) through the RNA Type option, and the input box will only match RNA Symbols belonging to the selected category. If no matching RNA is found, the system will display “No result”.
2. Set drug filtering conditions (optional):
Select the drug identifier type from the Drug dropdown menu, including PubChem CID, Drug Name, and SMILES, and enter the target drug information. If no drug condition is specified, the system will return all drugs associated with the selected RNA. If a specific drug is entered, only the association between the selected RNA and the specified drug will be displayed.
3. Set statistical filtering thresholds (Threshold):
Select the desired FDR and P-value thresholds according to the analysis requirements. The system supports three significance levels: 0.05, 0.01, and 0.001.
4. Submit the search:
After completing all parameter settings, click the Submit button to retrieve drug–RNA association results that satisfy the selected criteria.
main
Search/Drug-Enhancer
The Drug-Enhancer module is designed to explore the associations between enhancer regulatory elements and drug sensitivity. This module enables systematic identification of enhancer elements associated with drug response and facilitates the discovery of potential regulatory mechanisms underlying drug sensitivity.
The system provides two flexible search modes:
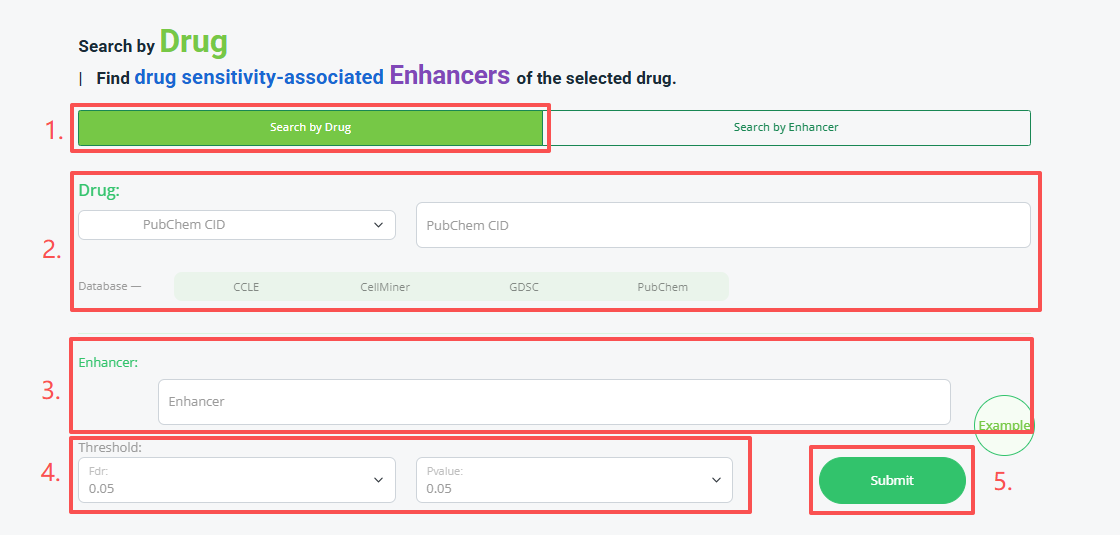
Search by Drug: Identify enhancer regulatory elements associated with a specific drug.
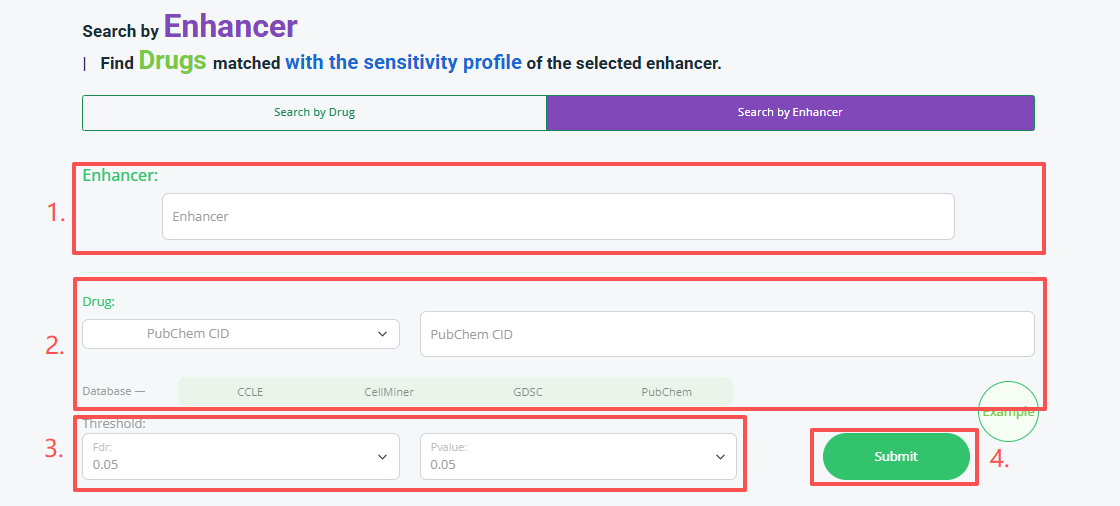
Search by Enhancer: Identify drugs associated with a specific enhancer regulatory element.
Mode 1: Search by Drug
If you are interested in a specific drug and aim to identify potential enhancer regulatory elements associated with its sensitivity profile, follow the steps below:
1. Select drug identifier type (required):
Select the drug identifier type from the Drug dropdown menu, including PubChem CID, Drug Name, and SMILES.
2. Enter drug information (required):
Enter drug-related keywords in the input box. The system will perform fuzzy matching and automatically display candidate drugs. The corresponding data sources of the selected drug, including CCLE, CellMiner, GDSC, and PubChem, will be automatically indicated.
3. Set enhancer filtering conditions (optional):
Enter the genomic location of the enhancer in the format chrom:start-end to retrieve enhancer elements associated with the selected drug. If the specified enhancer location matches available records, the corresponding drug–enhancer associations will be displayed; otherwise, the system will return “No result”. If the enhancer field is left empty, the system will return all enhancer regulatory elements associated with drug sensitivity across CCLE, CellMiner, GDSC, and PubChem datasets.
4. Set statistical filtering thresholds (Threshold):
Select the desired FDR and P-value thresholds according to the analysis requirements. The system supports three significance levels: 0.05, 0.01, and 0.001.
5. Submit the search:
After completing all parameter settings, click the Submit button to retrieve drug–enhancer association results that satisfy the selected criteria.
main
Mode 2: Search by Enhancer
If you are interested in a specific enhancer regulatory element and want to identify drugs associated with its sensitivity profile, follow the steps below:
1. Enter enhancer information (required):
Enter the genomic location of the enhancer (chrom:start-end) in the Enhancer input box. The system will automatically match the corresponding enhancer information. If no matching enhancer record is found, the system will display “No result”.
2. Set drug filtering conditions (optional):
Select the drug identifier type from the Drug dropdown menu, including PubChem CID, Drug Name, and SMILES, and enter the target drug information. If no drug condition is specified, the system will return all drugs associated with the selected enhancer. If a specific drug is entered, only the association between the selected enhancer and the specified drug will be displayed.
3. Set statistical filtering thresholds (Threshold):
Select the desired FDR and P-value thresholds according to the analysis requirements. The system supports three significance levels: 0.05, 0.01, and 0.001.
4. Submit the search:
After completing all parameter settings, click the Submit button to retrieve drug–enhancer association results that satisfy the selected criteria.
main
DrugRNA-Func
The DrugRNA-Func module is designed to explore the network of drug-targeted RNA molecular interactions and functional enrichment of drug-associated RNA molecules across different RNA types.
Users can access this function either by clicking the Tools
/tool-rst
option on the search results page, or via the ANALYSIS menu located in the top navigation bar.
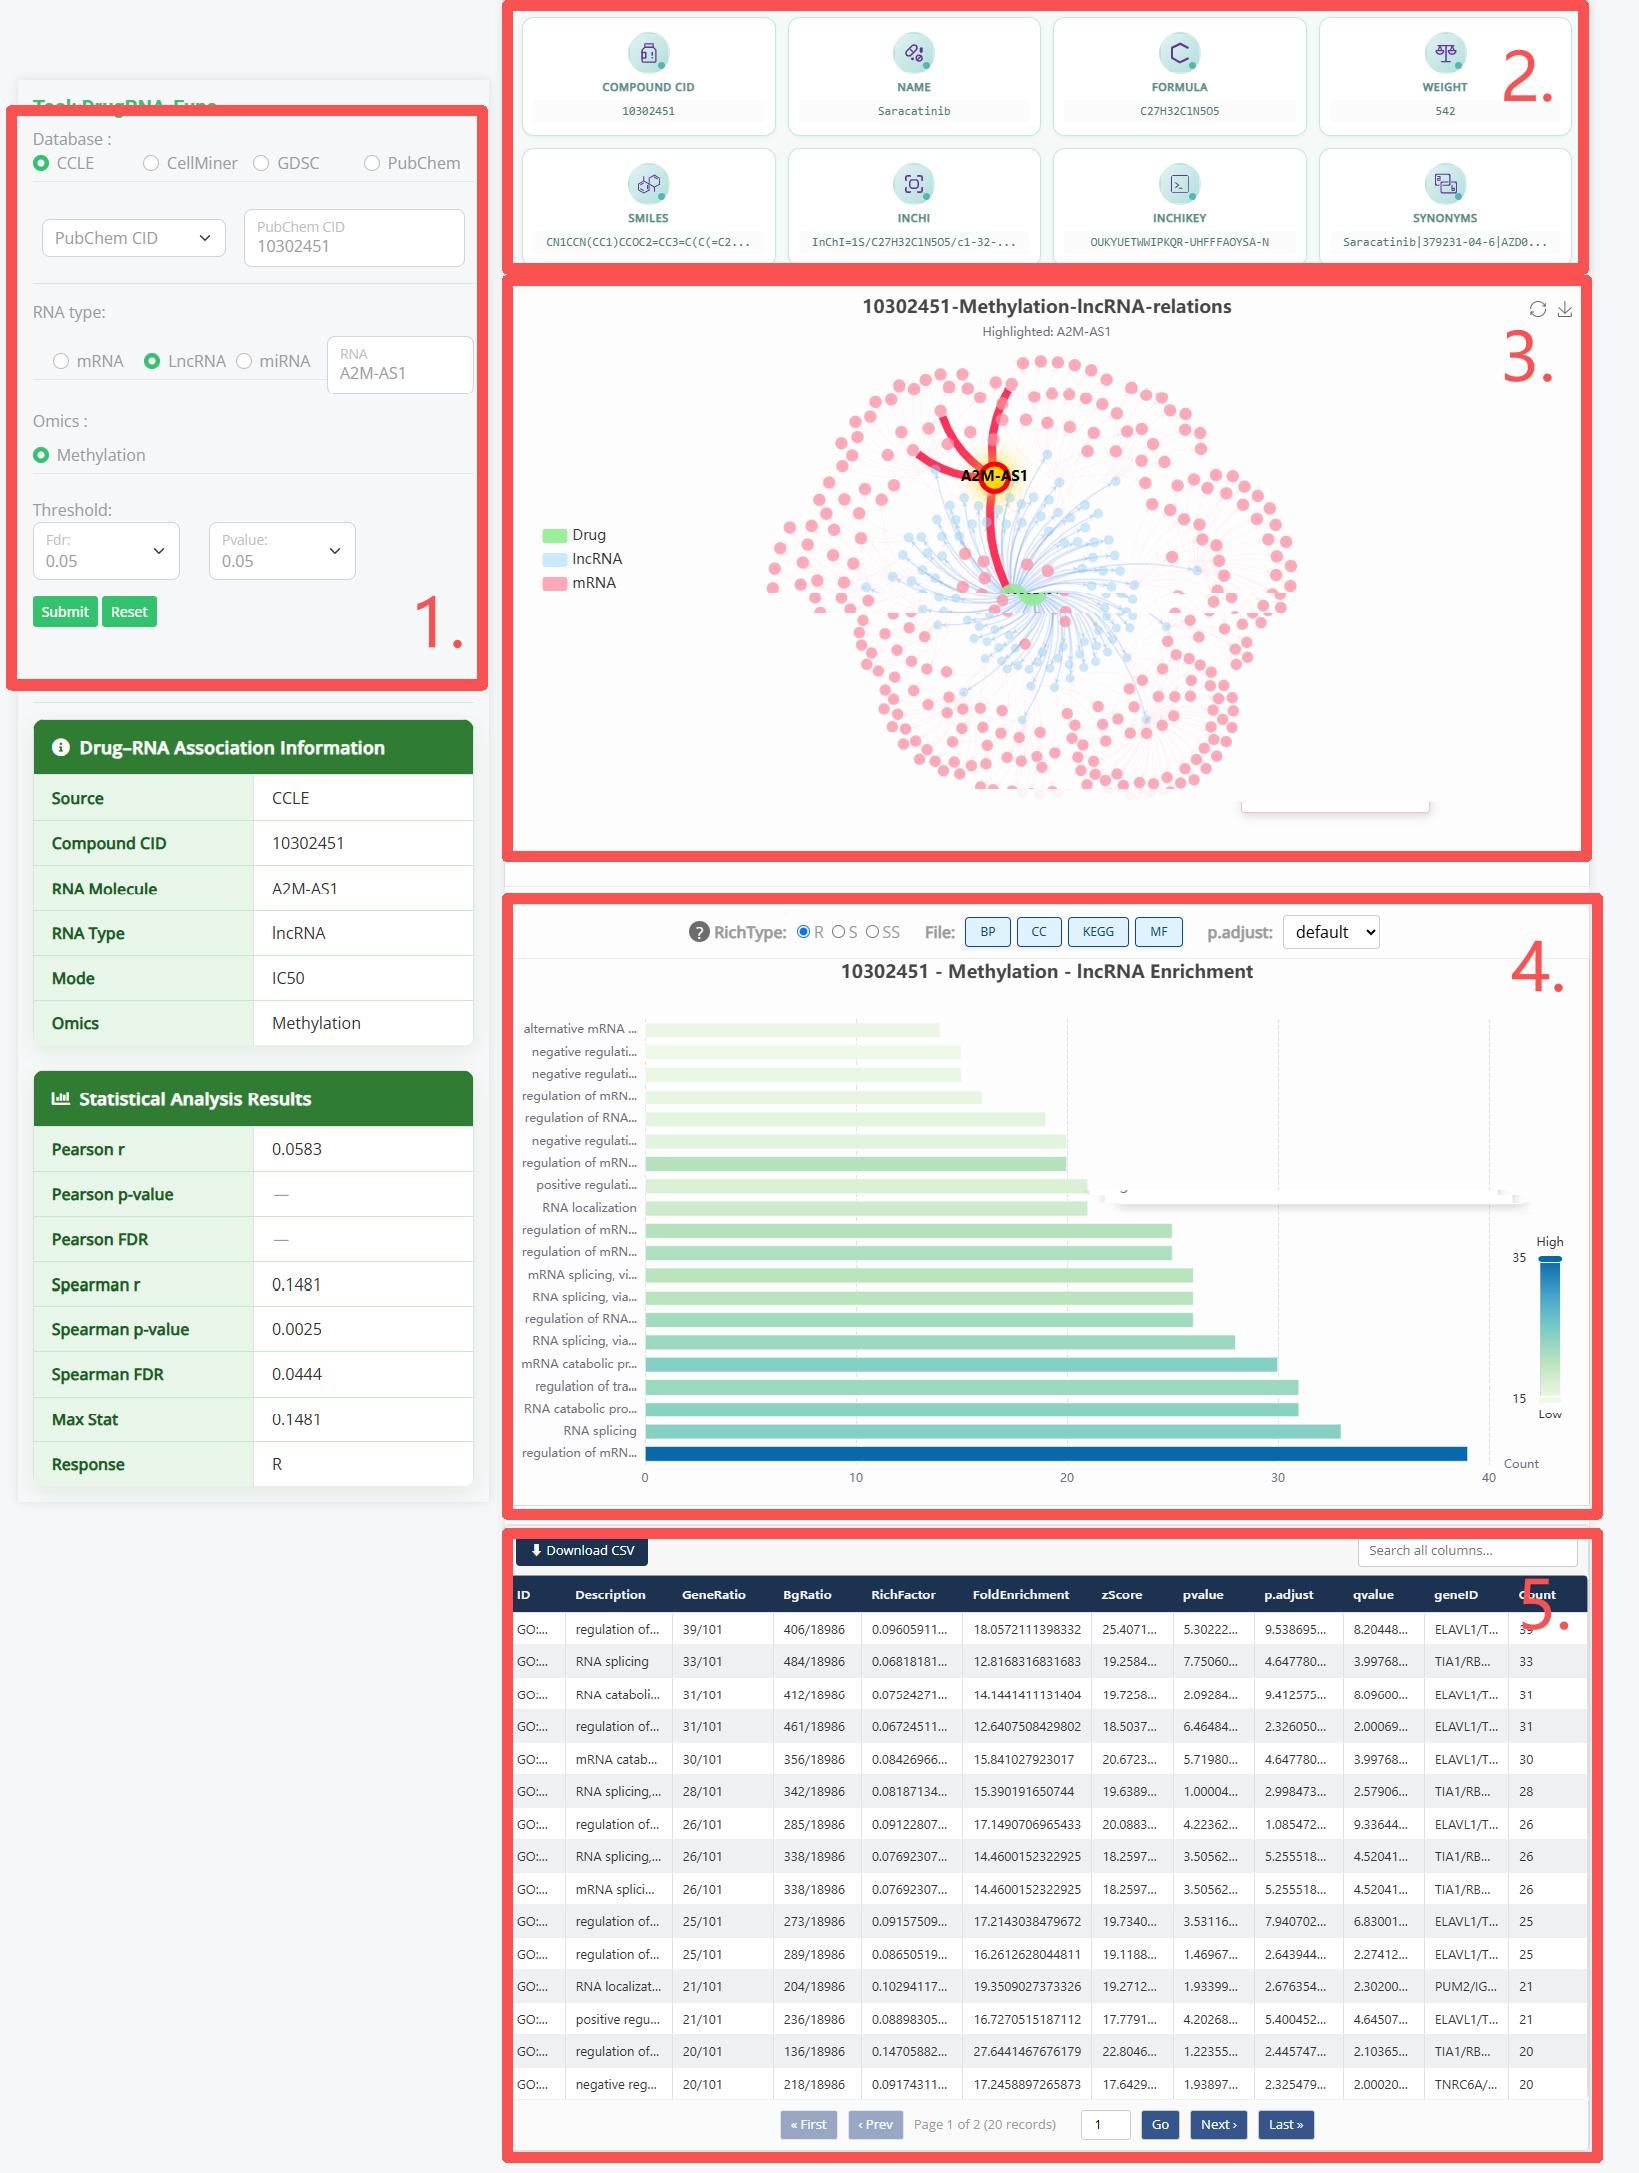
1. To configure parameters and submit your analysis, follow these steps:
i) select the database source (CCLE, CellMiner, GDSC, or PubChem);
ii) choose the drug identifier type (PubChem CID, Drug Name, or SMILES) and enter your drug query;
iii) specify the target RNA type (mRNA, lncRNA, or miRNA) along with the RNA Symbol;
iv) choose the desired omics data dimension (Expression, CNV, Methylation, or Mutation);
v) set the appropriate statistical significance thresholds for both FDR and P-value (0.05, 0.01, or 0.001);
vi) click the Submit button to generate the interactive visual analysis results. You can click the Reset button at any time to clear all configured parameters and restore the default settings.
2. Provide comprehensive table with detailed information of the selected drug.
3. Molecular interaction network of all drug-targeted RNAs, with bold colored edges highlighting the currently selected drug–RNA association pair.
4. Top 20 functional enrichment bar charts of GO (BP, CC, MF) and KEGG for drug-associated RNAs across R, S, RR and SS groups, including the lenient screening criterion (|r| > 0 for S/R groups) and high-confidence screening criterion (|r| > 0.4 for SS/RR groups).
5. Detailed table of Top 20 GO (BP, CC, MF) and KEGG functional enrichment results for drug-targeted RNAs.
tool-1
DrugRNA-TCGAPan
The DrugRNA-TCGAPan module is designed to explore pan-cancer multi-omics characterization and survival analysis of drug-associated RNA molecules across TCGA cohorts.
Users can access this function either by clicking the Tools
/tool-rst
option on the search results page, or via the ANALYSIS menu located in the top navigation bar.
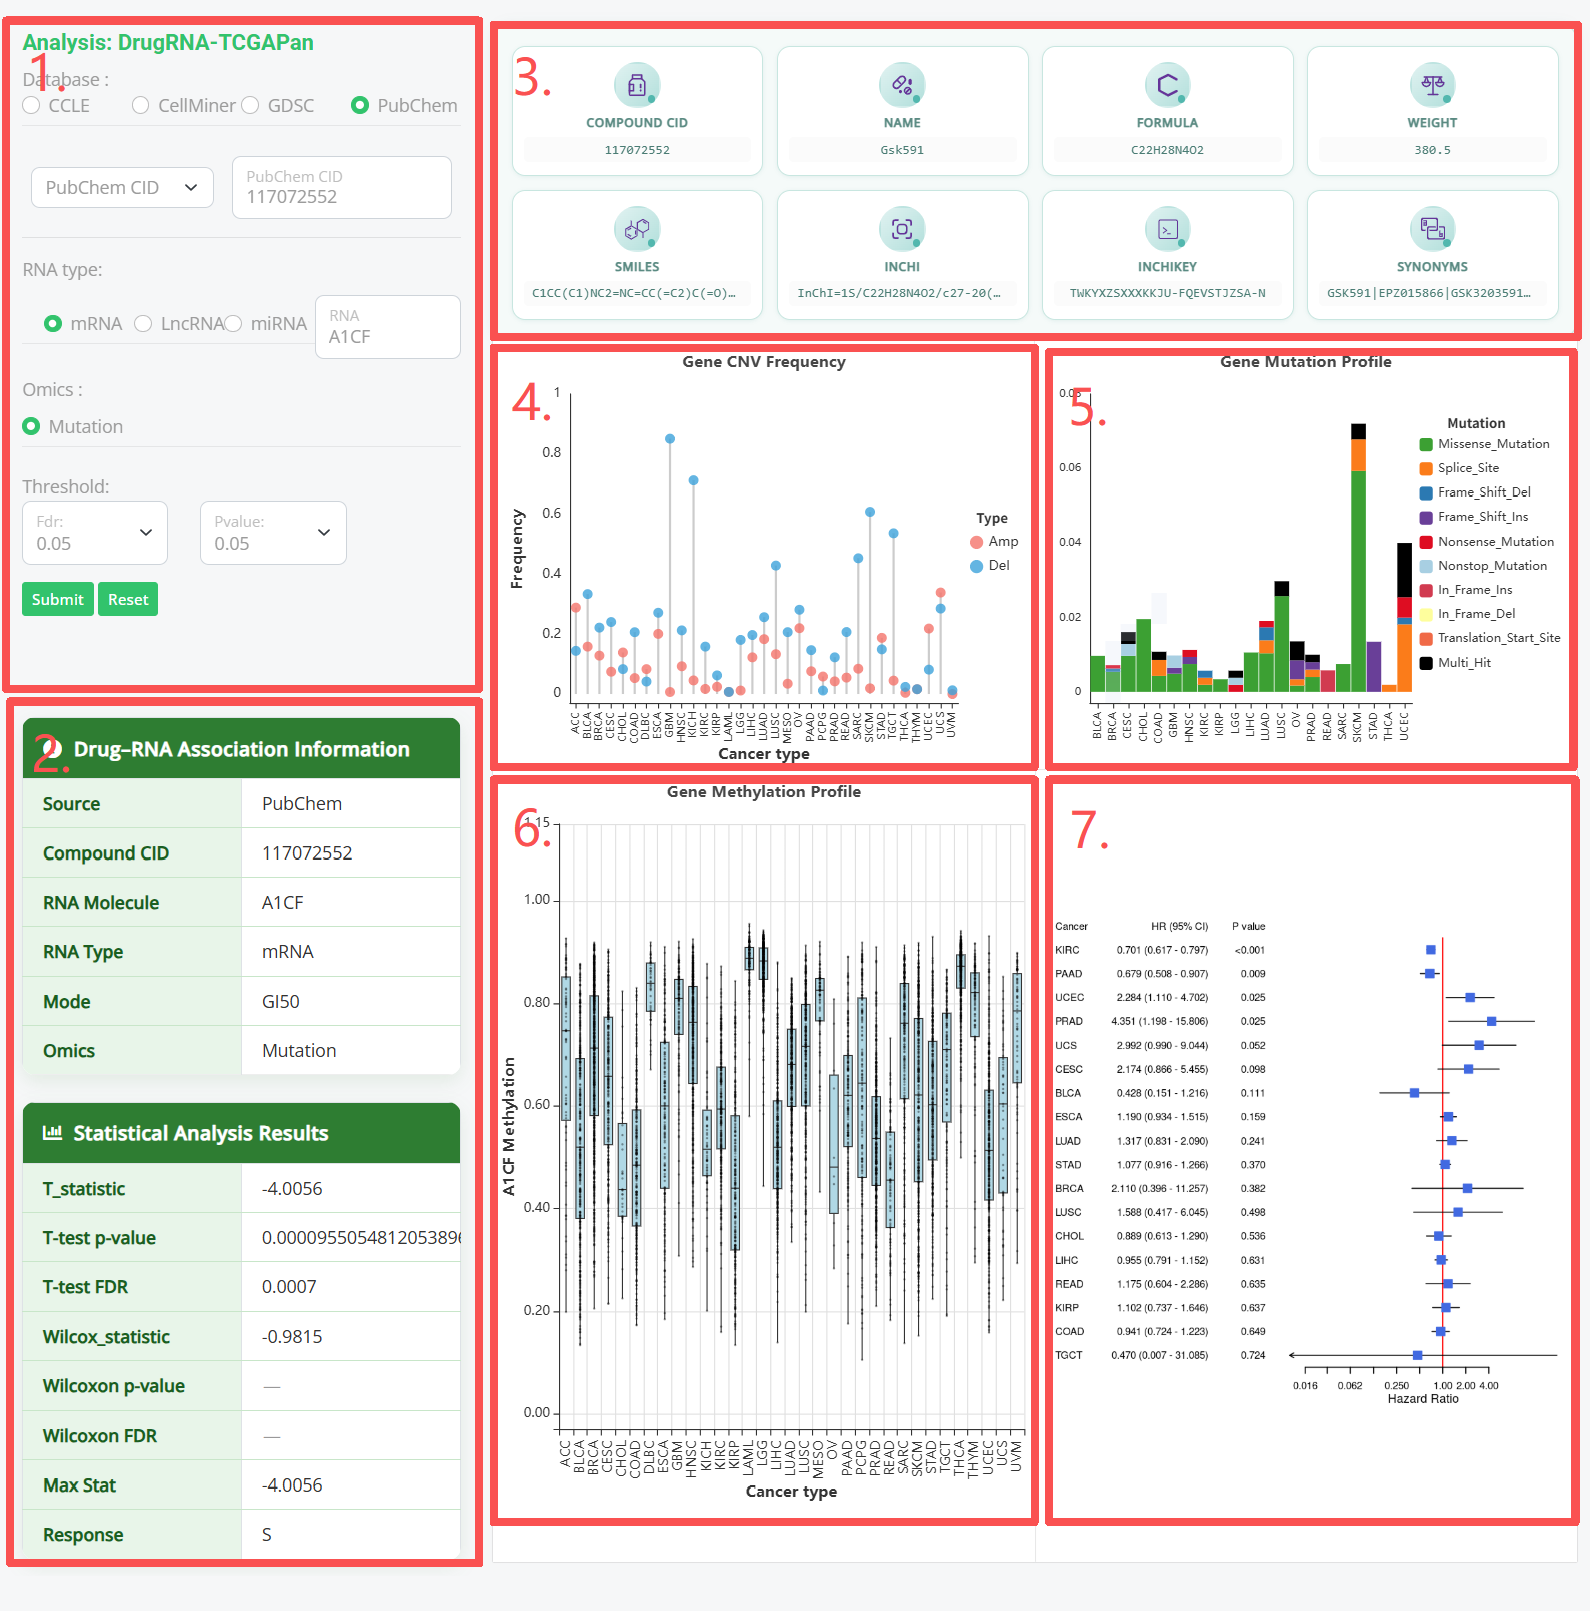
1. To configure parameters and submit your analysis, follow these steps:
i) select the database source (CCLE, CellMiner, GDSC, or PubChem);
ii) choose the drug identifier type (PubChem CID, Drug Name, or SMILES) and enter your drug query;
iii) specify the target RNA type (mRNA, lncRNA, or miRNA) along with the RNA Symbol;
iv) choose the desired omics data dimension (Expression, CNV, Methylation, or Mutation);
v) set the appropriate statistical significance thresholds for both FDR and P-value (0.05, 0.01, or 0.001);
vi) click the Submit button to generate the interactive visual analysis results. You can click the Reset button at any time to clear all configured parameters and restore the default settings.
2.Drug-RNA association information and corresponding statistical analysis results.
3.Provide comprehensive table with detailed information of the selected drug.
4.Show lollipop plots of copy number variation frequencies across TCGA pan-cancer cohorts for drug-sensitive RNAs.
5.Display stacked bar charts of mutation frequencies across TCGA pan-cancer cohorts for drug-sensitive RNAs.
6.Present scatter-bar plots of methylation distribution across TCGA pan-cancer cohorts for drug-sensitive RNAs.
7.Visualize Cox forest plots for survival analysis across TCGA pan-cancer cohorts for drug-sensitive RNAs.
main
DrugRNA-TCGACancer
The DrugRNA-TCGACancer module is designed to explore the cancer-type-specific multi-omics and clinical characterization module of drug-associated RNA molecules in TCGA cohorts.
Users can access this function either by clicking the Tools
/tool-rst
option on the search results page, or via the ANALYSIS menu located in the top navigation bar.
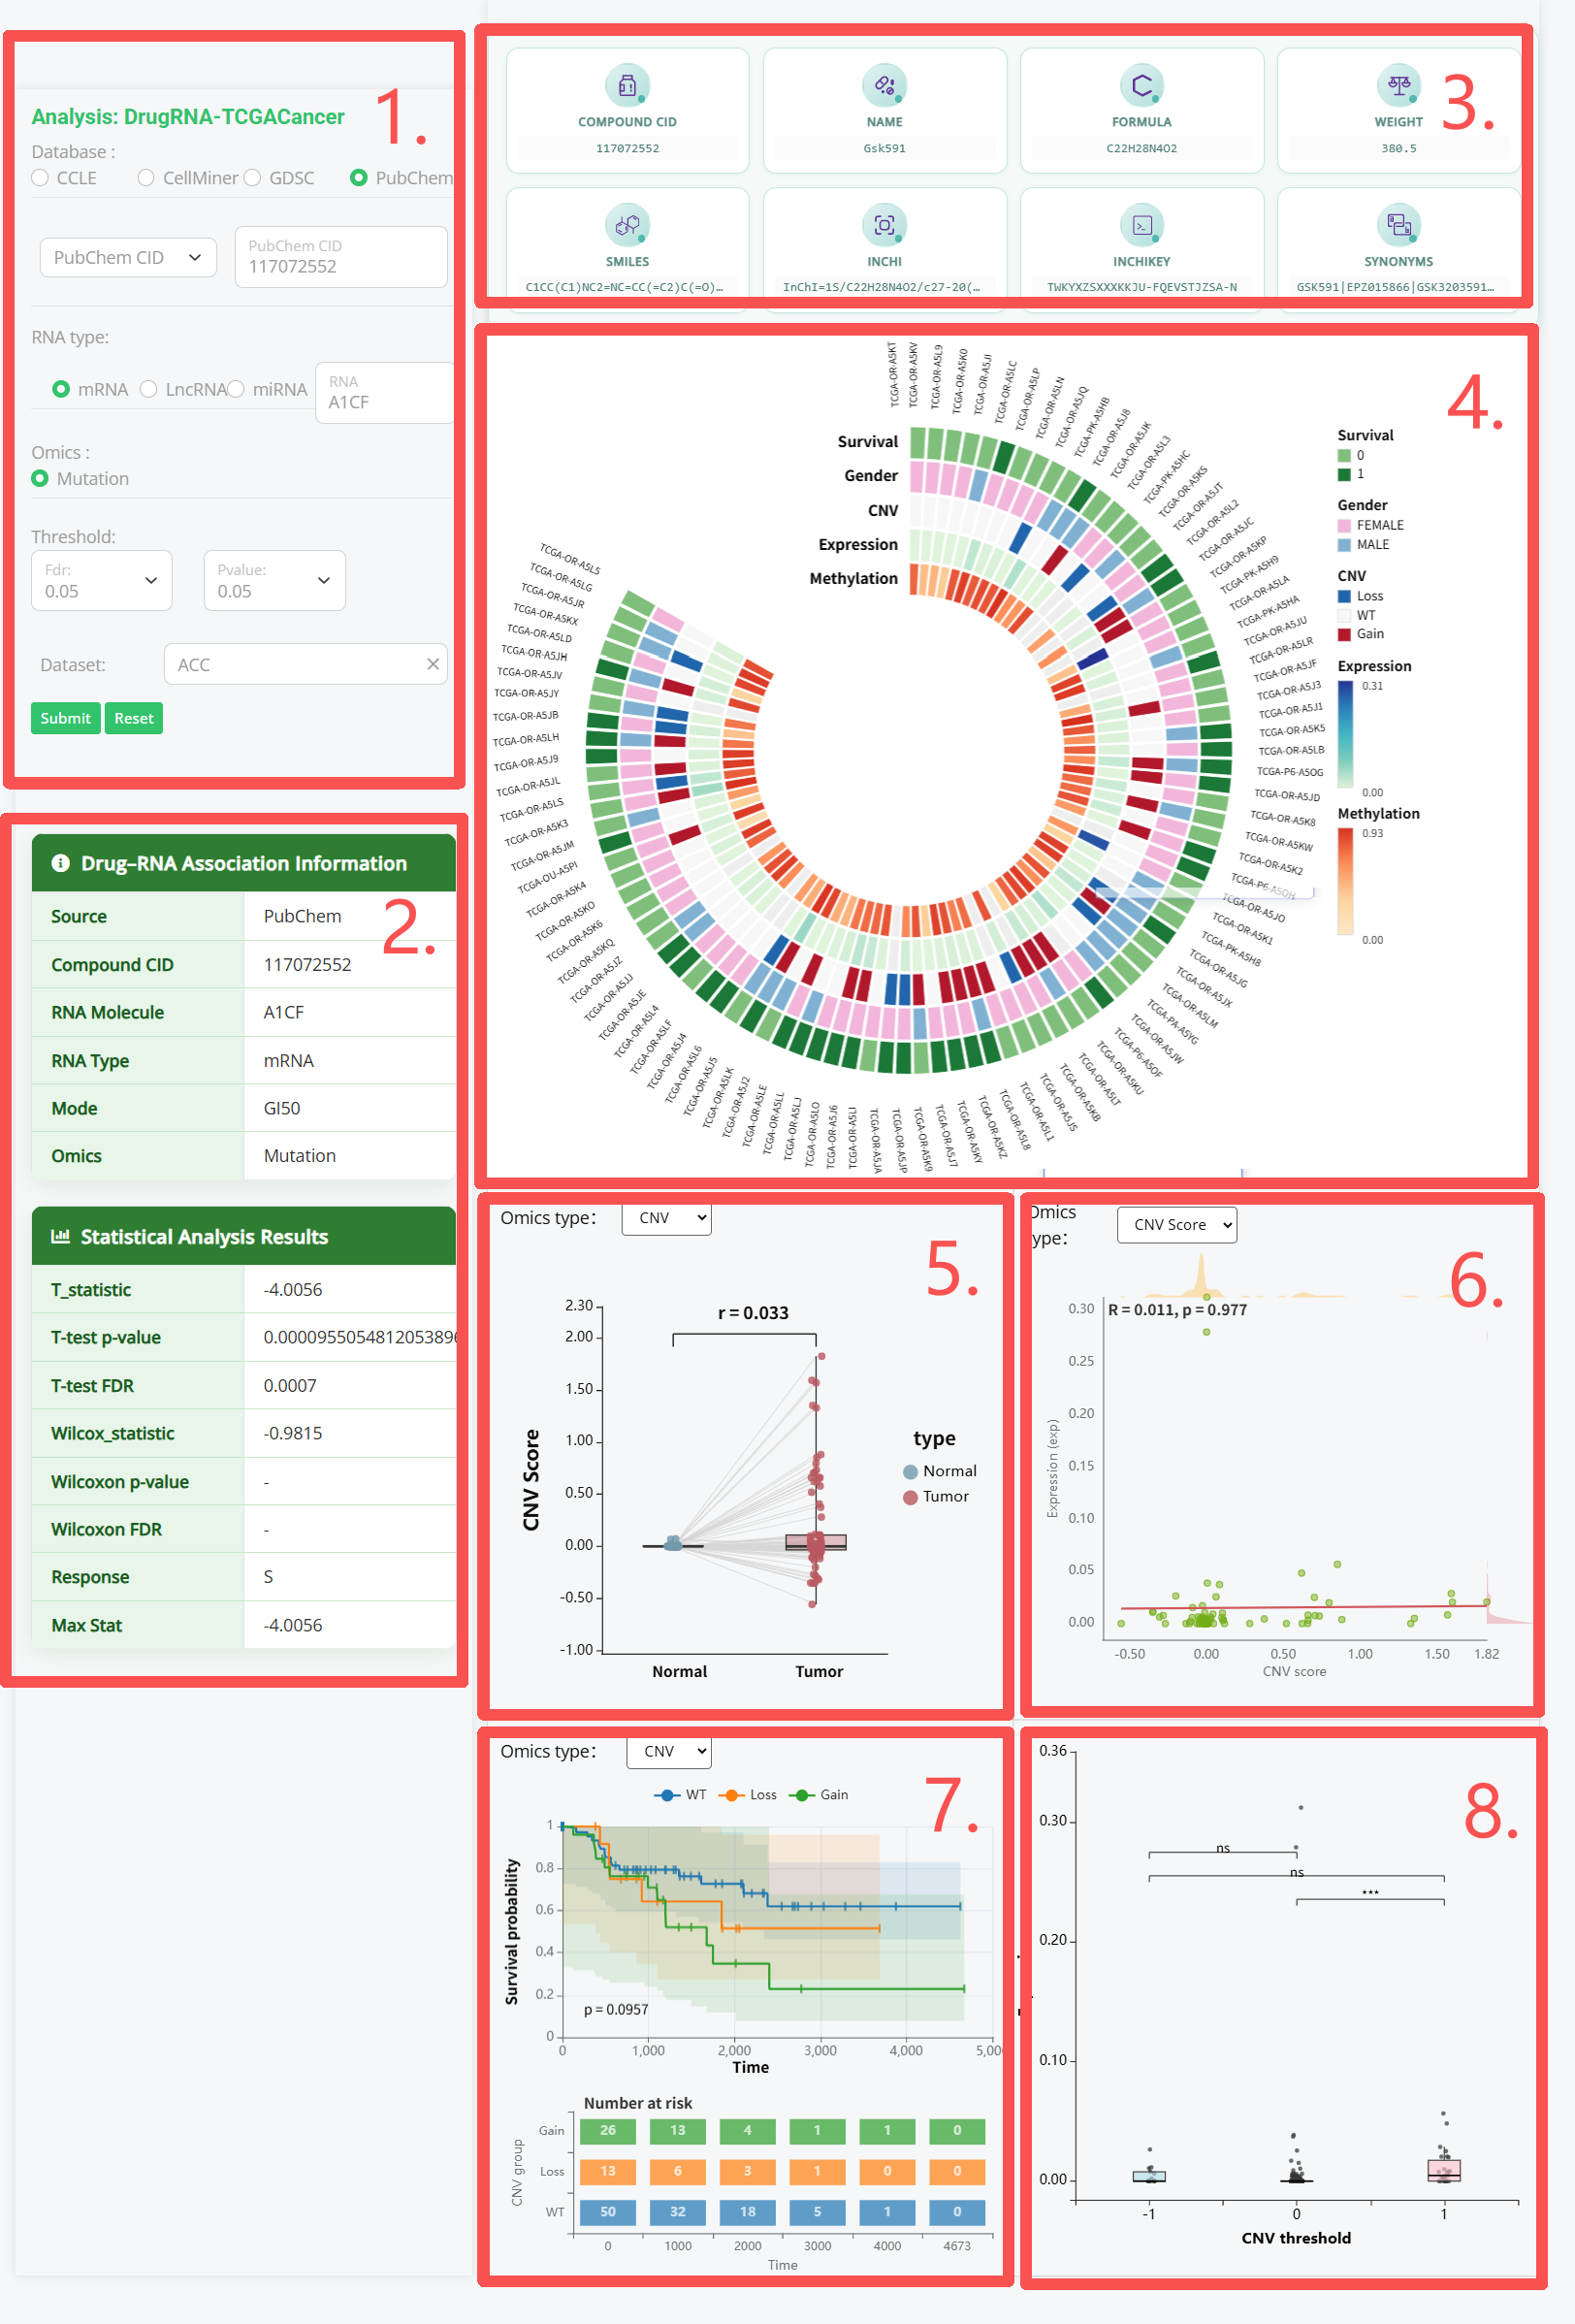
1. To configure parameters and submit your analysis, follow these steps:
i) select the database source (CCLE, CellMiner, GDSC, or PubChem);
ii) choose the drug identifier type (PubChem CID, Drug Name, or SMILES) and enter your drug query;
iii) specify the target RNA type (mRNA, lncRNA, or miRNA) along with the RNA Symbol;
iv) choose the desired omics data dimension (Expression, CNV, Methylation, or Mutation);
v) set the appropriate statistical significance thresholds for both FDR and P-value (0.05, 0.01, or 0.001);
vi) Select the TCGA cohort of interest;
vii) click the Submit button to generate the interactive visual analysis results. You can click the Reset button at any time to clear all configured parameters and restore the default settings.
2.Drug-RNA association information and corresponding statistical analysis results.
3.Provide comprehensive table with detailed information of the selected drug.
4.Provide circular overview for multi-omics and clinical features of drug-related RNAs in TCGA cohorts, covering survival, gender, CNV, expression and methylation data of TCGA samples.
5.Select the desired omics type from the dropdown box to view omics differences between normal and tumor tissues in matched patient samples.
6.Select the desired omics type from the dropdown box to generate scatter plots showing the correlation between gene expression and the selected omics data.
7.Select the desired omics type from the dropdown box to perform survival analysis grouped by different strata of the selected omics feature.
8.Expression Distribution Under Different Copy Number Thresholds
main
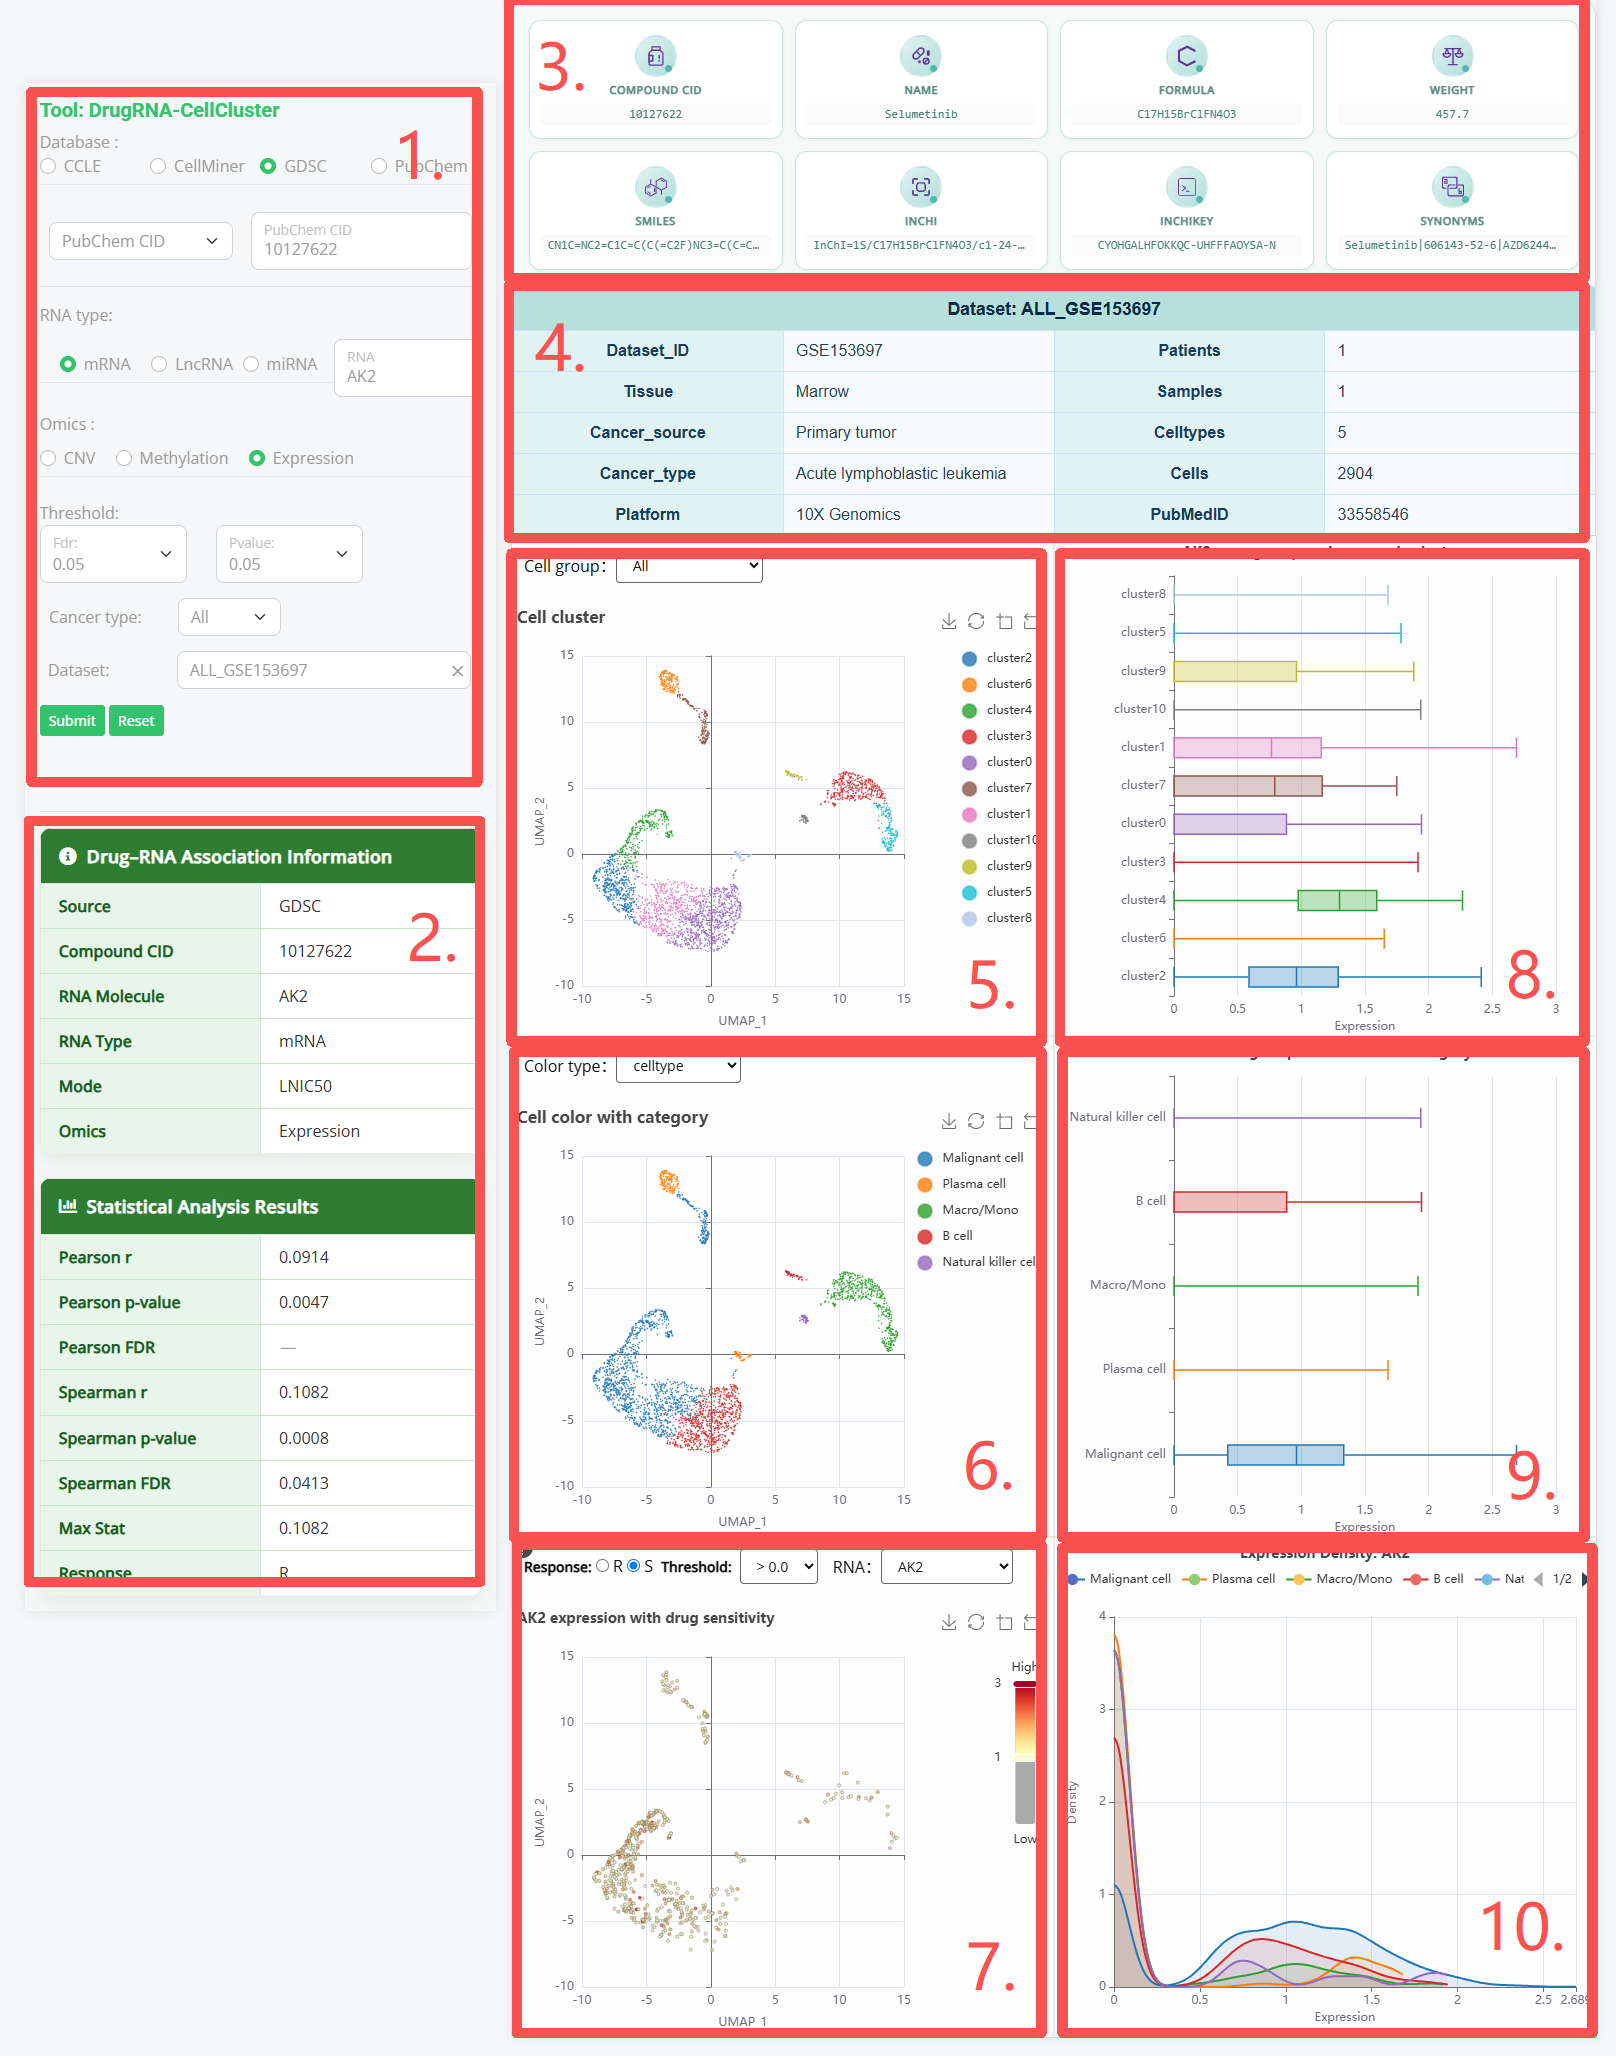
DrugRNA-CellCluster
The DrugRNA-CellCluster module is designed to explore expression dynamics of drug-associated RNA molecules across cells, clusters, and cell types in the tumor microenvironment.
Users can access this function either by clicking the Tools
/tool-rth
option on the search results page, or via the ANALYSIS menu located in the top navigation bar.
1. To configure parameters and submit your analysis, follow these steps:
i) select the database source (CCLE, CellMiner, GDSC, or PubChem);
ii) choose the drug identifier type (PubChem CID, Drug Name, or SMILES) and enter your drug query;
iii) specify the target RNA type (mRNA, lncRNA, or miRNA) along with the RNA Symbol;
iv) choose the desired omics data dimension (Expression, CNV, Methylation, or Mutation);
v) set the appropriate statistical significance thresholds for both FDR and P-value (0.05, 0.01, or 0.001);
vi) select your interested cancer type via the dropdown menu and pick the corresponding scRNA-seq dataset of interest in the Dataset column;
vii) click the Submit button to generate the interactive visual analysis results. You can click the Reset button at any time to clear all configured parameters and restore the default settings.
2.Drug-RNA association information and corresponding statistical analysis results.
3.Provide comprehensive table with detailed information of the selected drug.
4.Provide comprehensive table with detailed information of the selected scRNA-seq dataset.
5.Select options from the dropdown menu to display single-cell clustering maps at different resolutions in the tumor microenvironment.
6.Select categories from the dropdown menu to visualize single-cell clustering maps colored by CellType, Patient, Sample, Source-type and Tissue.
7.Display single-cell clustering maps colored by the expression of drug sensitivity-related RNAs.
8.Show box plots of drug sensitivity-related RNA expression across distinct cell clusters.
9.Show box plots of drug sensitivity-related RNA expression across different cell types.
10.Visualize the expression distribution of drug sensitivity-related RNAs among diverse cell types.
tool-4
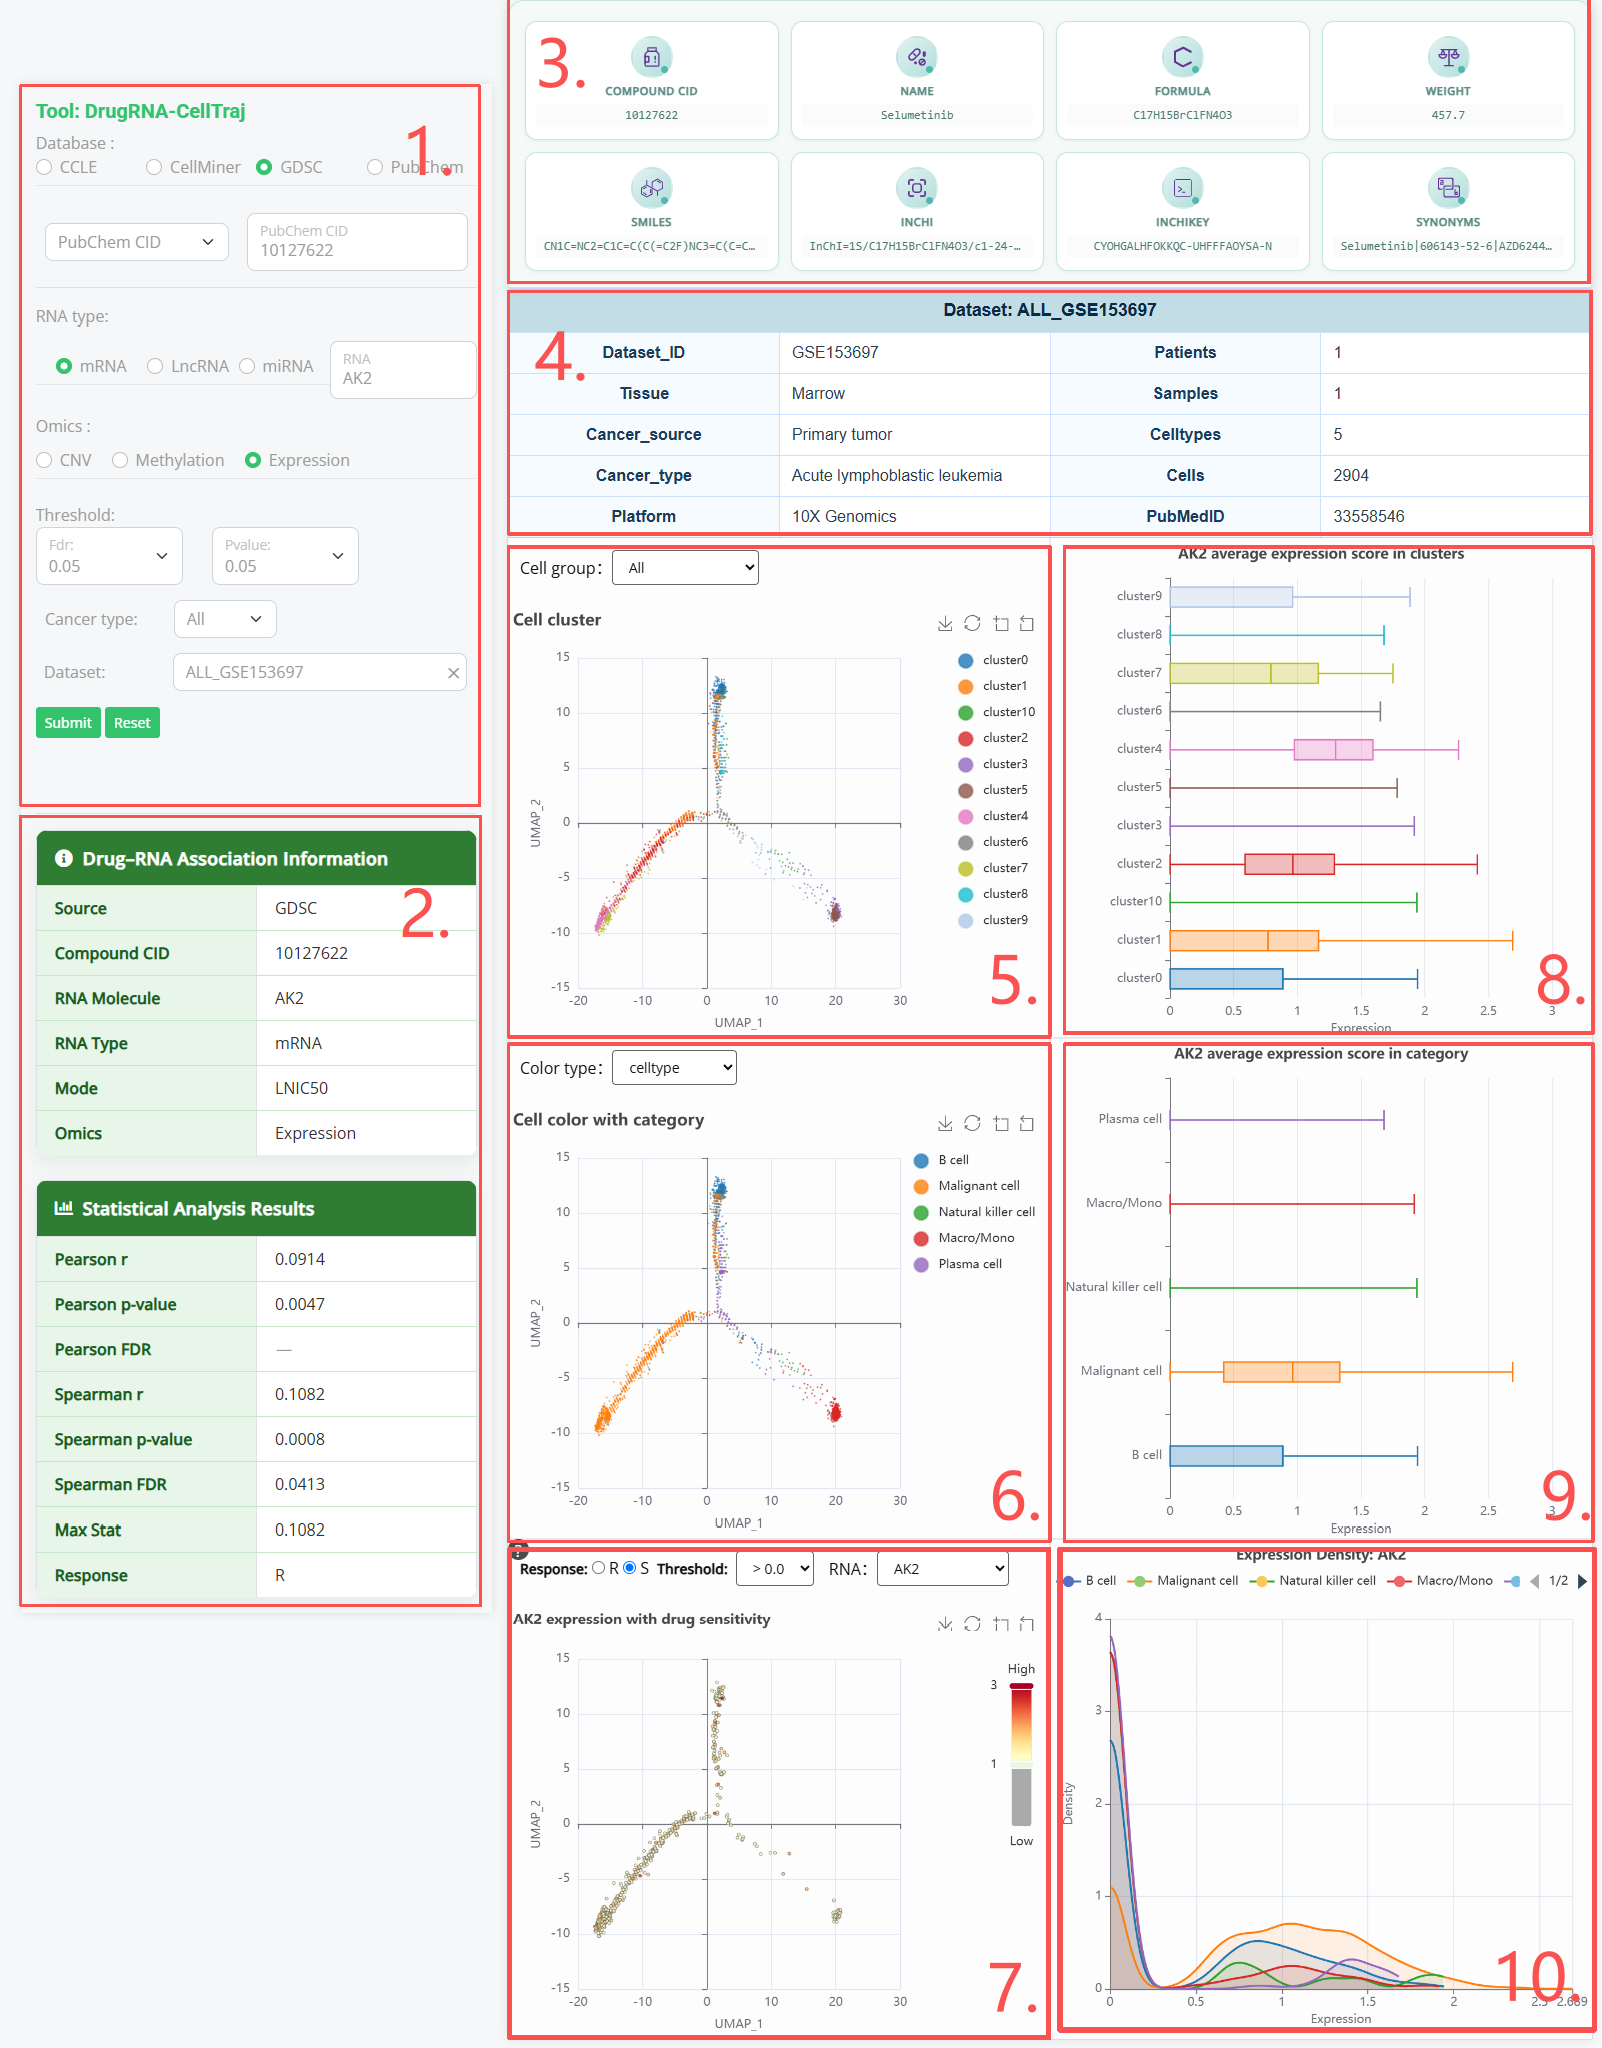
DrugRNA-CellTraj
The DrugRNA-CellTraj module is designed to explore expression dynamics of drug-associated RNA molecules across cells, clusters, and cell types along developmental trajectories in the tumor microenvironment.
Users can access this function either by clicking the Tools
/tool-rth
option on the search results page, or via the ANALYSIS menu located in the top navigation bar.
1. To configure parameters and submit your analysis, follow these steps:
i) select the database source (CCLE, CellMiner, GDSC, or PubChem);
ii) choose the drug identifier type (PubChem CID, Drug Name, or SMILES) and enter your drug query;
iii) specify the target RNA type (mRNA, lncRNA, or miRNA) along with the RNA Symbol;
iv) choose the desired omics data dimension (Expression, CNV, Methylation, or Mutation);
v) set the appropriate statistical significance thresholds for both FDR and P-value (0.05, 0.01, or 0.001);
vi) select your interested cancer type via the dropdown menu and pick the corresponding scRNA-seq dataset of interest in the Dataset column;
vii) click the Submit button to generate the interactive visual analysis results. You can click the Reset button at any time to clear all configured parameters and restore the default settings.
2.Drug-RNA association information and corresponding statistical analysis results.
3.Provide comprehensive table with detailed information of the selected drug.
4.Provide comprehensive table with detailed information of the selected scRNA-seq dataset.
5.Select options from the dropdown menu to display single-cell pseudotime trajectories at different resolutions within the tumor microenvironment.
6.Select categories from the dropdown menu to visualize pseudotime trajectories colored by CellType, Patient, Sample, Source-type and Tissue.
7.Display pseudotime trajectories colored by the expression of drug sensitivity-related RNAs.
8.Show box plots of drug sensitivity-related RNA expression across distinct cell clusters.
9.Show box plots of drug sensitivity-related RNA expression across different cell types.
10.Visualize the expression distribution of drug sensitivity-related RNAs among diverse cell types.
main
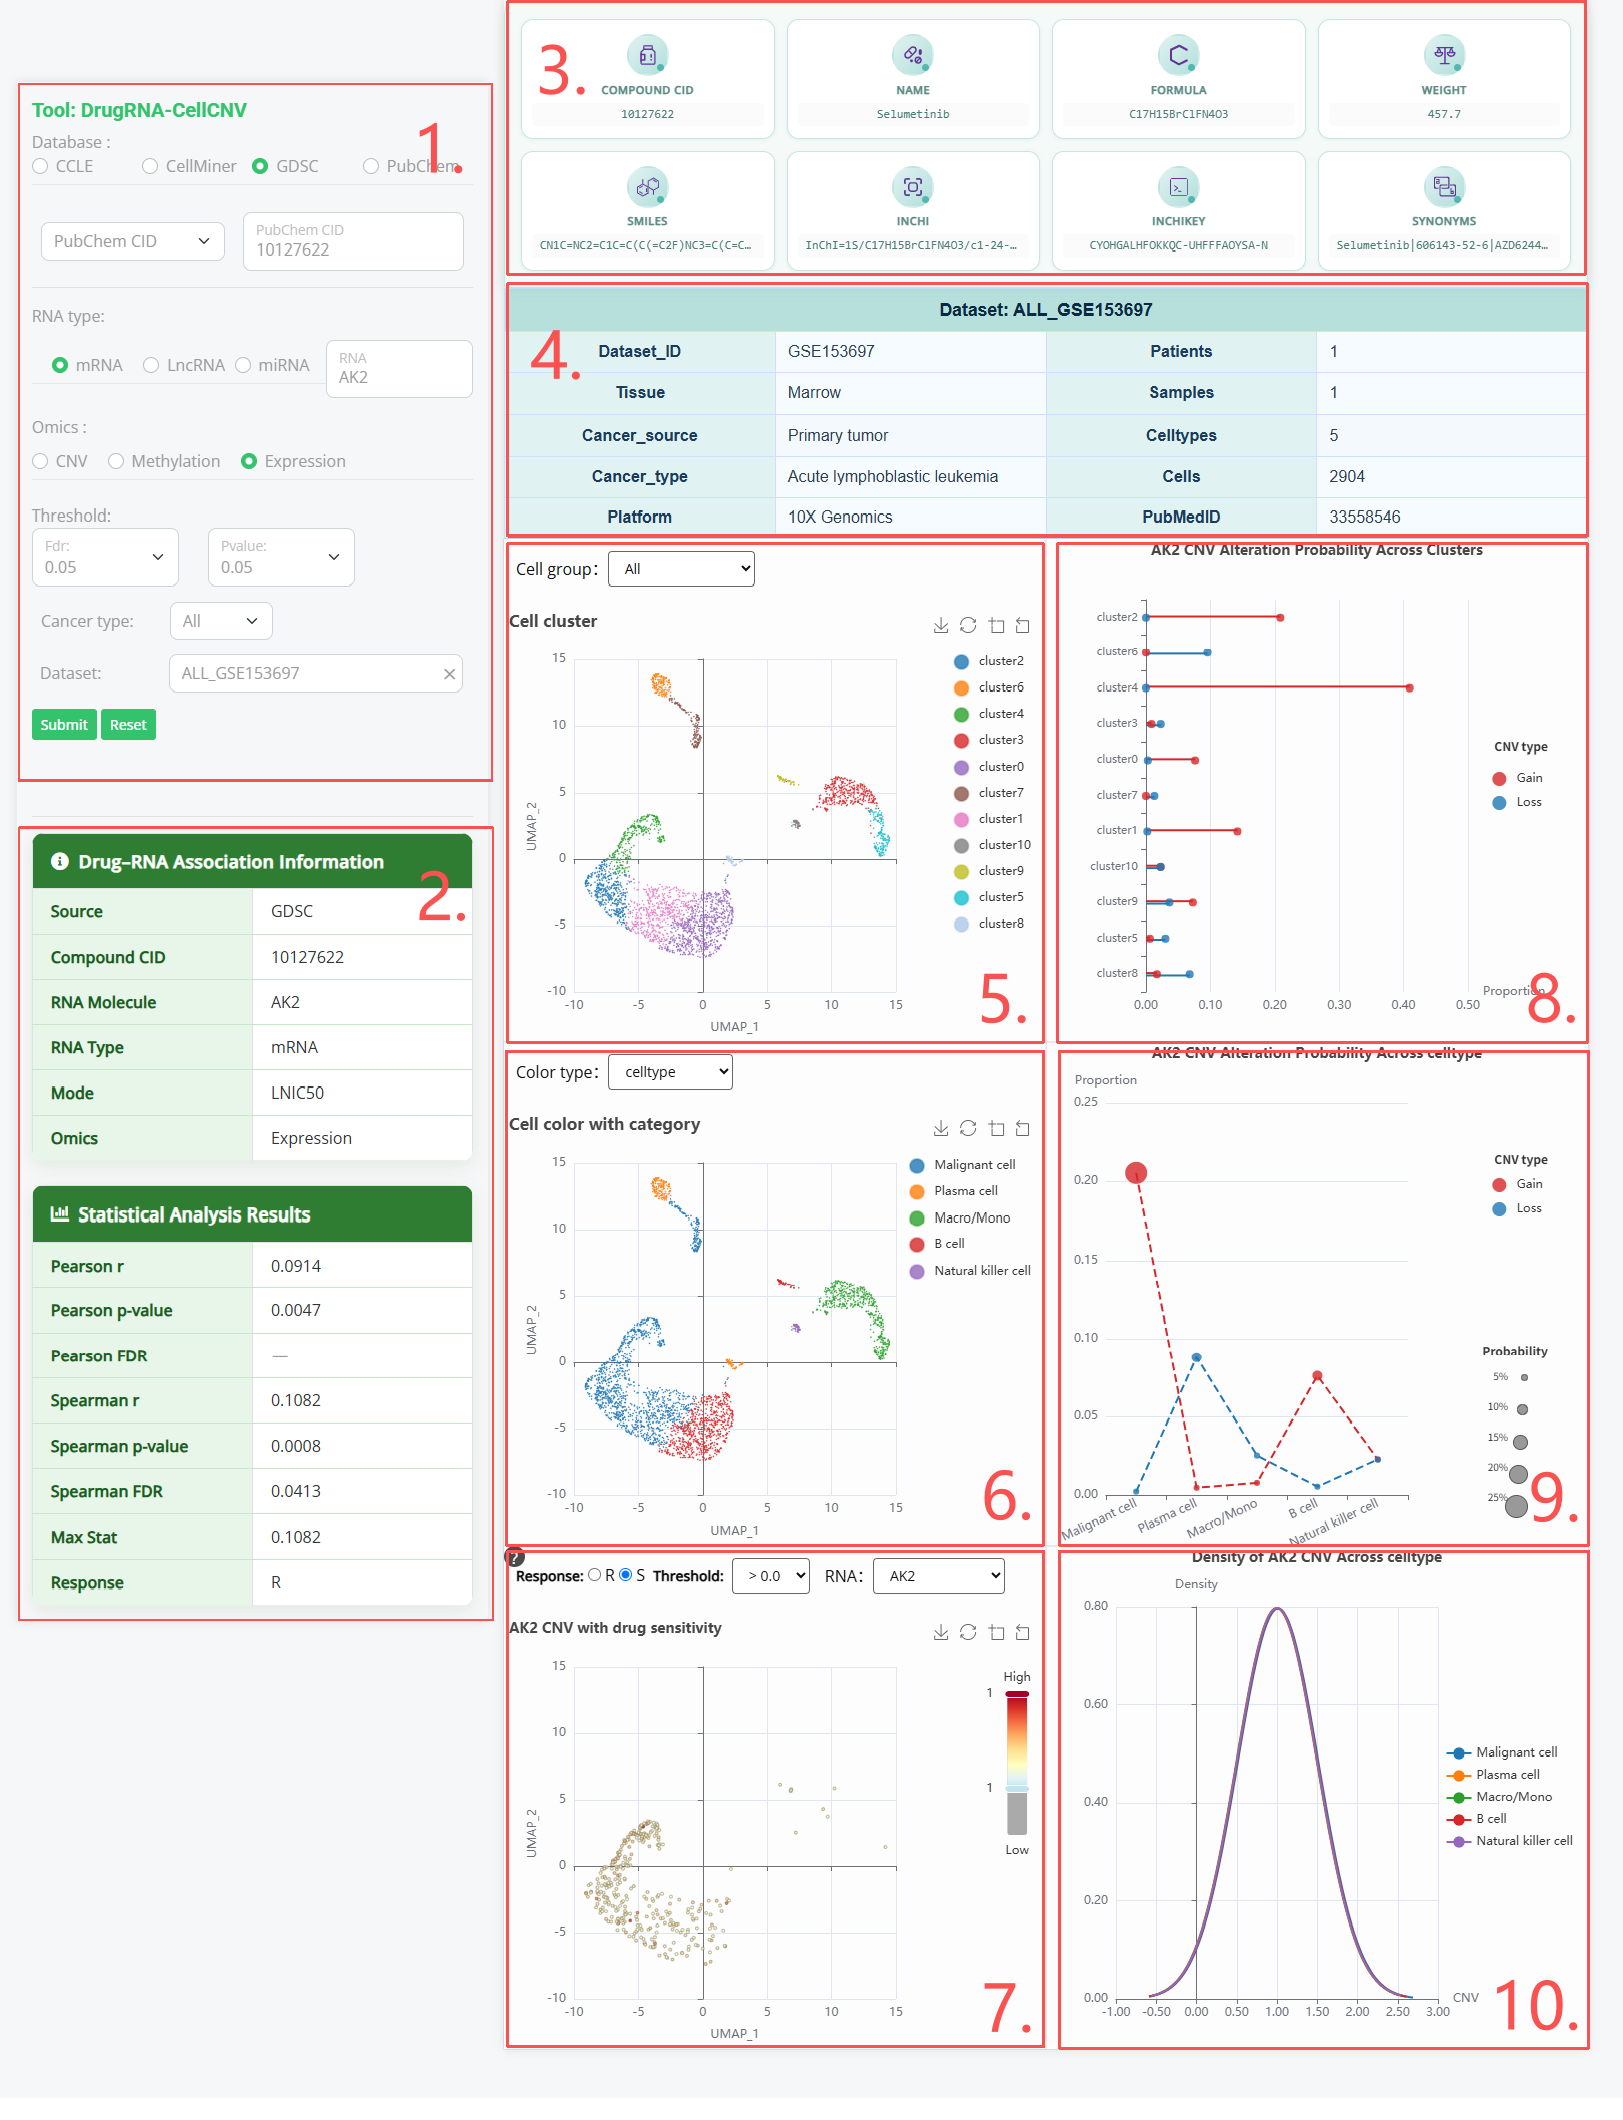
DrugRNA-CellCNV
The DrugRNA-CellCNV module is designed to explore CNV dynamics of drug-associated RNA molecules across cells, clusters, and cell types in the tumor microenvironment.
Users can access this function either by clicking the Tools
/tool-six
option on the search results page, or via the ANALYSIS menu located in the top navigation bar.
1. To configure parameters and submit your analysis, follow these steps:
i) select the database source (CCLE, CellMiner, GDSC, or PubChem);
ii) choose the drug identifier type (PubChem CID, Drug Name, or SMILES) and enter your drug query;
iii) specify the target RNA type (mRNA, lncRNA, or miRNA) along with the RNA Symbol;
iv) choose the desired omics data dimension (Expression, CNV, Methylation, or Mutation);
v) set the appropriate statistical significance thresholds for both FDR and P-value (0.05, 0.01, or 0.001);
vi) select your interested cancer type via the dropdown menu and pick the corresponding scRNA-seq dataset of interest in the Dataset column;
vii) click the Submit button to generate the interactive visual analysis results. You can click the Reset button at any time to clear all configured parameters and restore the default settings.
2.Drug-RNA association information and corresponding statistical analysis results.
3.Provide comprehensive table with detailed information of the selected drug.
4.Provide comprehensive table with detailed information of the selected scRNA-seq dataset.
5.Select options from the dropdown menu to display single-cell clustering maps at different resolutions in the tumor microenvironment.
6.Select categories from the dropdown menu to visualize single-cell clustering maps colored by CellType, Patient, Sample, Source-type and Tissue.
7.Display single-cell clustering maps colored by the expression of drug sensitivity-related RNAs.
8.Show box plots of copy number variation frequencies for drug sensitivity-related RNAs across distinct cell clusters.
9.Show box plots of copy number variation frequencies for drug sensitivity-related RNAs across different cell types.
10.Visualize the copy number variation frequency distribution of drug sensitivity-related RNAs among diverse cell types.
tool-6
DrugEnh-NetFunc
The DrugEnh-NetFunc module is designed to explore the regulatory network of drug-targeted enhancers regulatory elements and their associated genes, along with functional enrichment analysis of drug-associated enhancers
Users can access this function either by clicking the Tools
/tool-ven
option on the search results page, or via the ANALYSIS menu located in the top navigation bar.
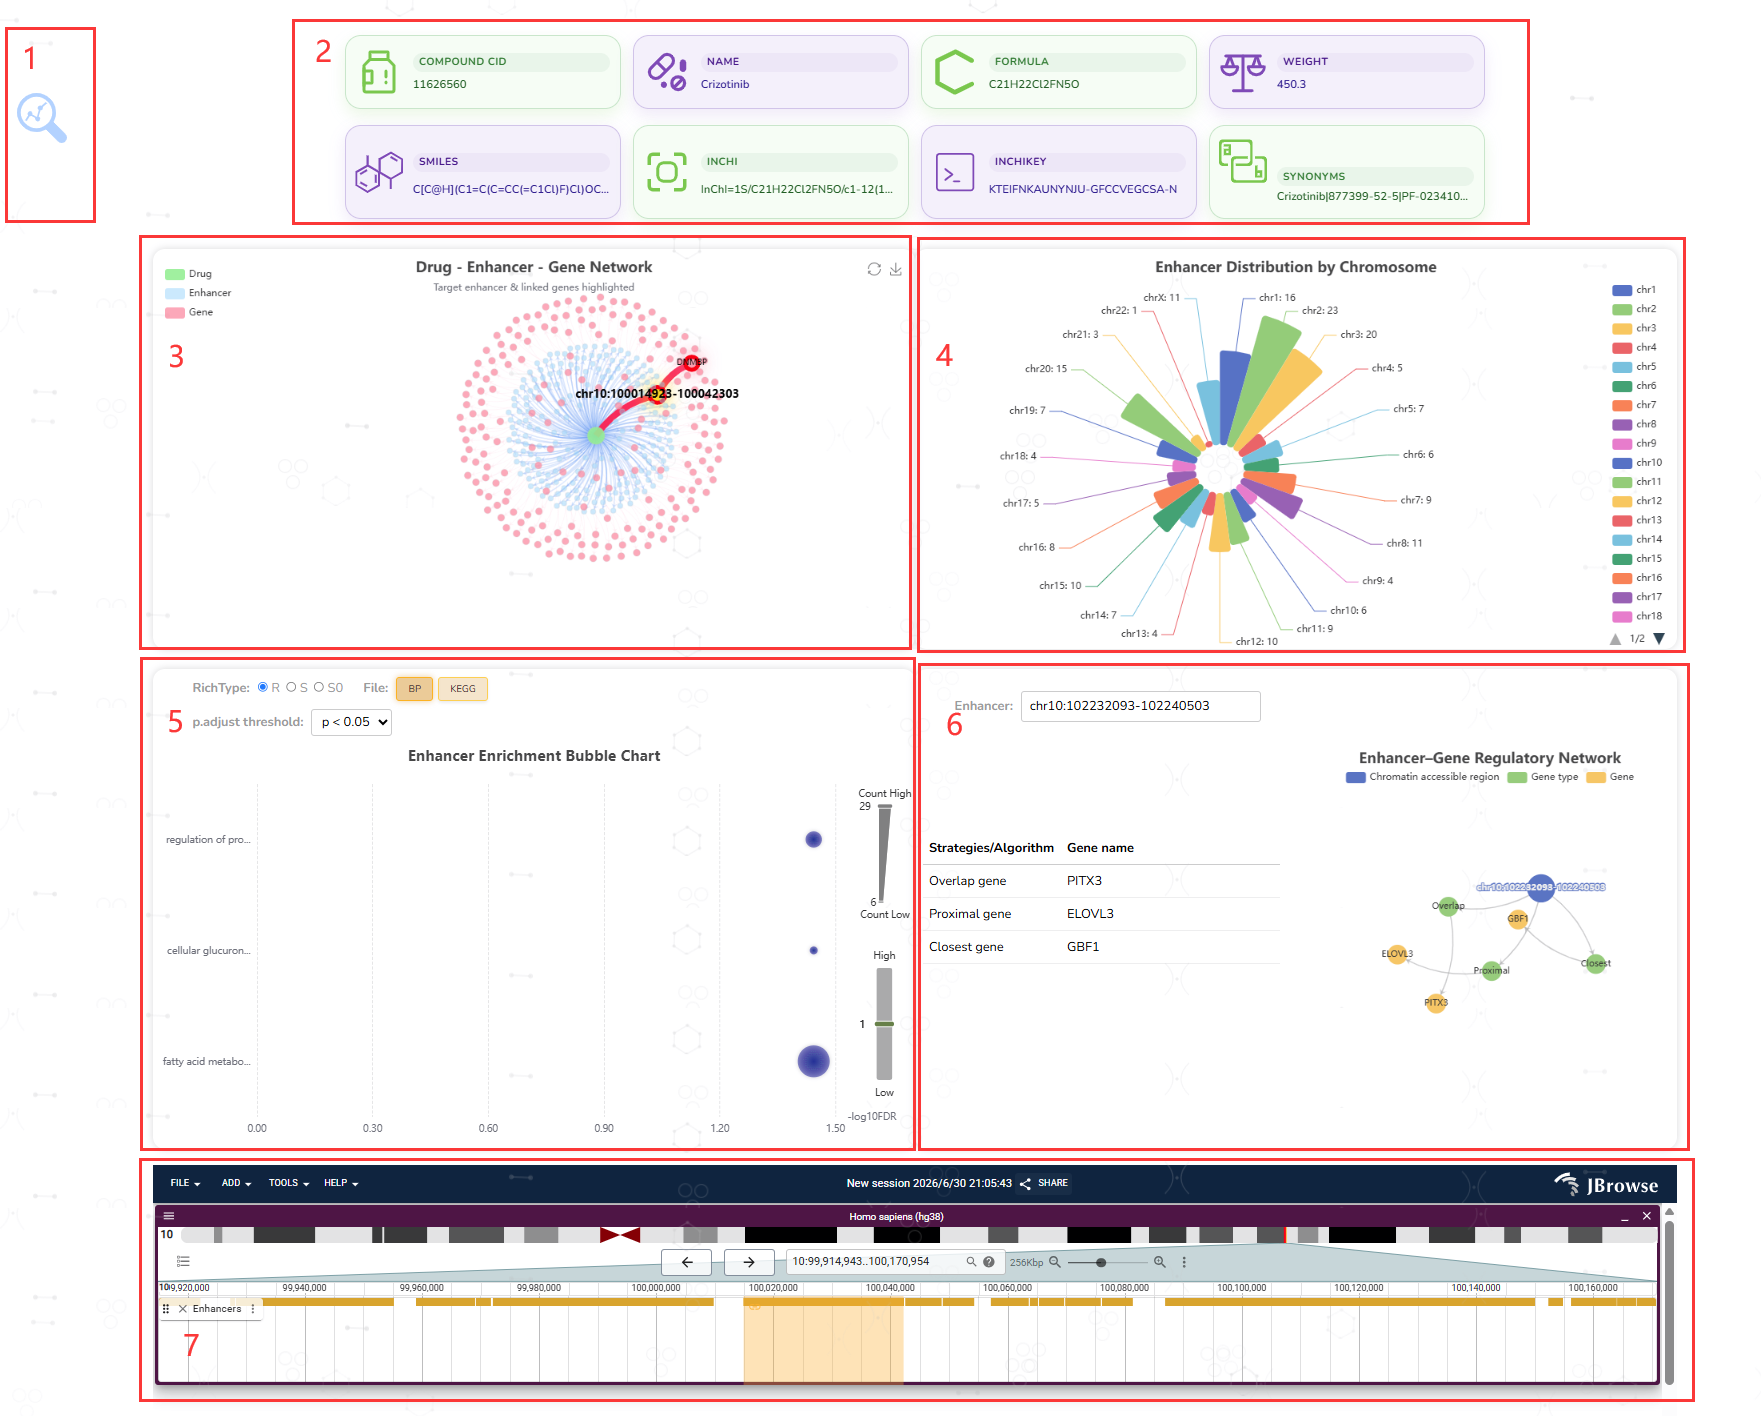
1.Select target drugs and enhancers via the magnifying glass icon on the left, then click Search to retrieve results.
2.Provide comprehensive table with detailed information of the selected drug.
3.Visualize molecular interaction network of all drug-targeted enhancers, with bold colored edges highlighting the currently selected drug-enhancer pair.
4.Show the chromosomal location distribution of all drug-affected enhancers and the proportion on each chromosome such as chr1, chr2 and chr5.
5.Display GO (BP, CC, MF) and KEGG functional enrichment bar plots under R/S/RR/SS groups. All RNA–drug associations are filtered with FDR < 0.05, including a permissive threshold (|r| > 0, S/R) and a stringent high-confidence threshold (|r| > 0.4, SS/RR).
6.Input the target enhancer region in the enhancer input box to obtain the gene regulatory network of drug-sensitive enhancers, including overlapping genes, proximal genes and closest genes.
7.Locate each enhancer in the genome browser.
enhancer007