Single Cell Drug Action Atlas in human cancer
Single Cell Drug Action Atlas in human cancer
scDrugAct: A database for Single Cell Drug Action Atlas in human cancer
Cell heterogeneity is the key factor leading to the diversity of cellular drug response and individual drug sensitivity. Thus, it is crucial to explore cell subpopulations that respond to drug treatment (perturbation) and cell subpopulations drive drug-resistance phenotypes in order to accurately elucidate the mechanism of drug action and understand how and why individual tumor cells evade cancer therapies. Furthermore, it is also indispensable importance for facilitating cell type targeted therapies as well as therapeutic biomarker discovery.
Here, we describe a database, scDrugAct (http://bio-bigdata.hrbmu.edu.cn/scDrugAct), wwhich aims to dissect tumor microenvironment cell heterogeneity contributing to drug action and resistance across human cancers. ScDrugAct is curated with drug-cell connections from3,811,756 cells across 34 cancer types and 13,857drugs, and provides17,274 drug-perturbation/-resistance related genes,272,714 associations between > 10,000drugs and53 cell types. ScDrugAct also provides 16 flexible tools to retrieve and analyse connections among drugs, genes and cells, distribution and developmental trajectories of drug associated cells within the TME, functional features affecting heterogeneity of cellular responses to drug perturbation and drug resistance, cellular-specific drug-related gene network and drug-drug similarities.
Collectively, scDrugAct will provide comprehensive insights for investigating heterogeneity of tumor microenvironment and cell heterogeneity contributing to cellular respond diversity to drug perturbation and drug resistance in human cancer. scDrugAct also can serve as a foundational resource for the mechanism studies of drug action and drug resistance, facilitating cell type targeted therapies as well as therapeutic biomarker discovery.
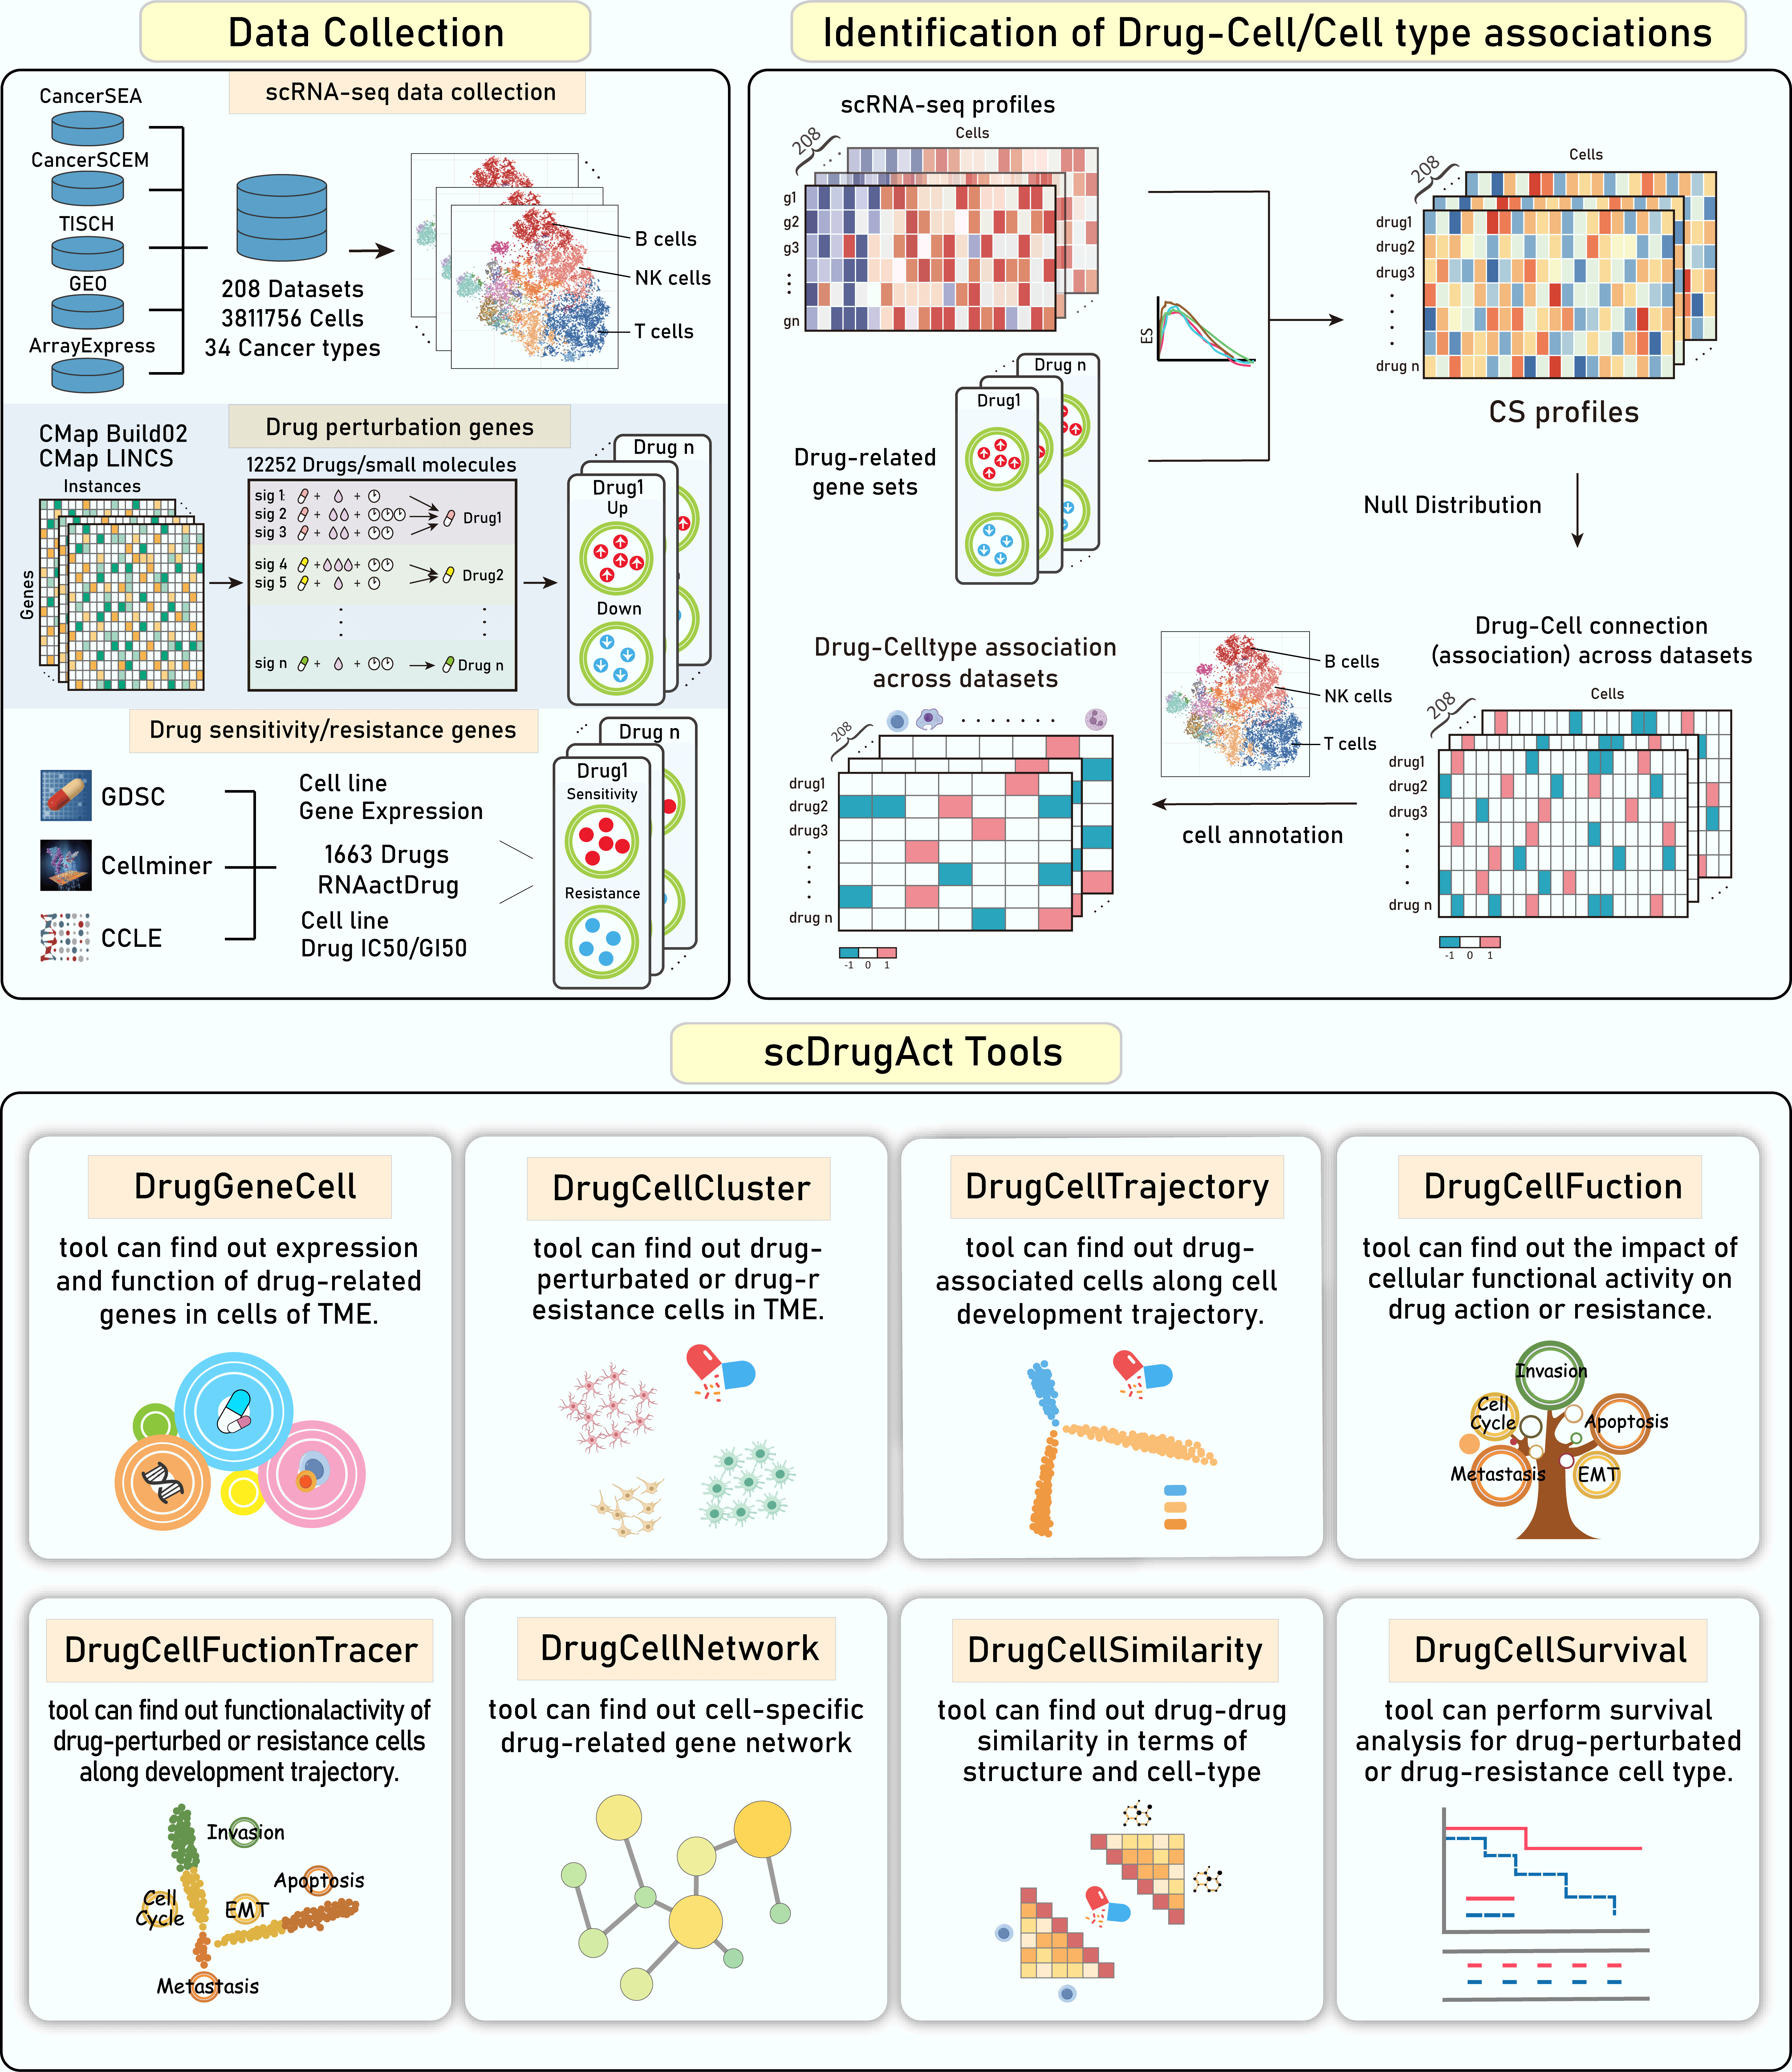
Overview of data content and functions of scDrugAct. The top panels demonstrate the dataset content and the construction of drug-cell connections. The bottom panels demonstrate the functional frameworks to retrieve, analysis and visualize data.
The data collection of the scDrugAct database consists of three main parts: cancer scRNA-seq profiles, drug perturbation related genes, drug sensitivity/resistance related genes (Figure 1-1).
Figure 1-1. Data collection of the scDrugAct database
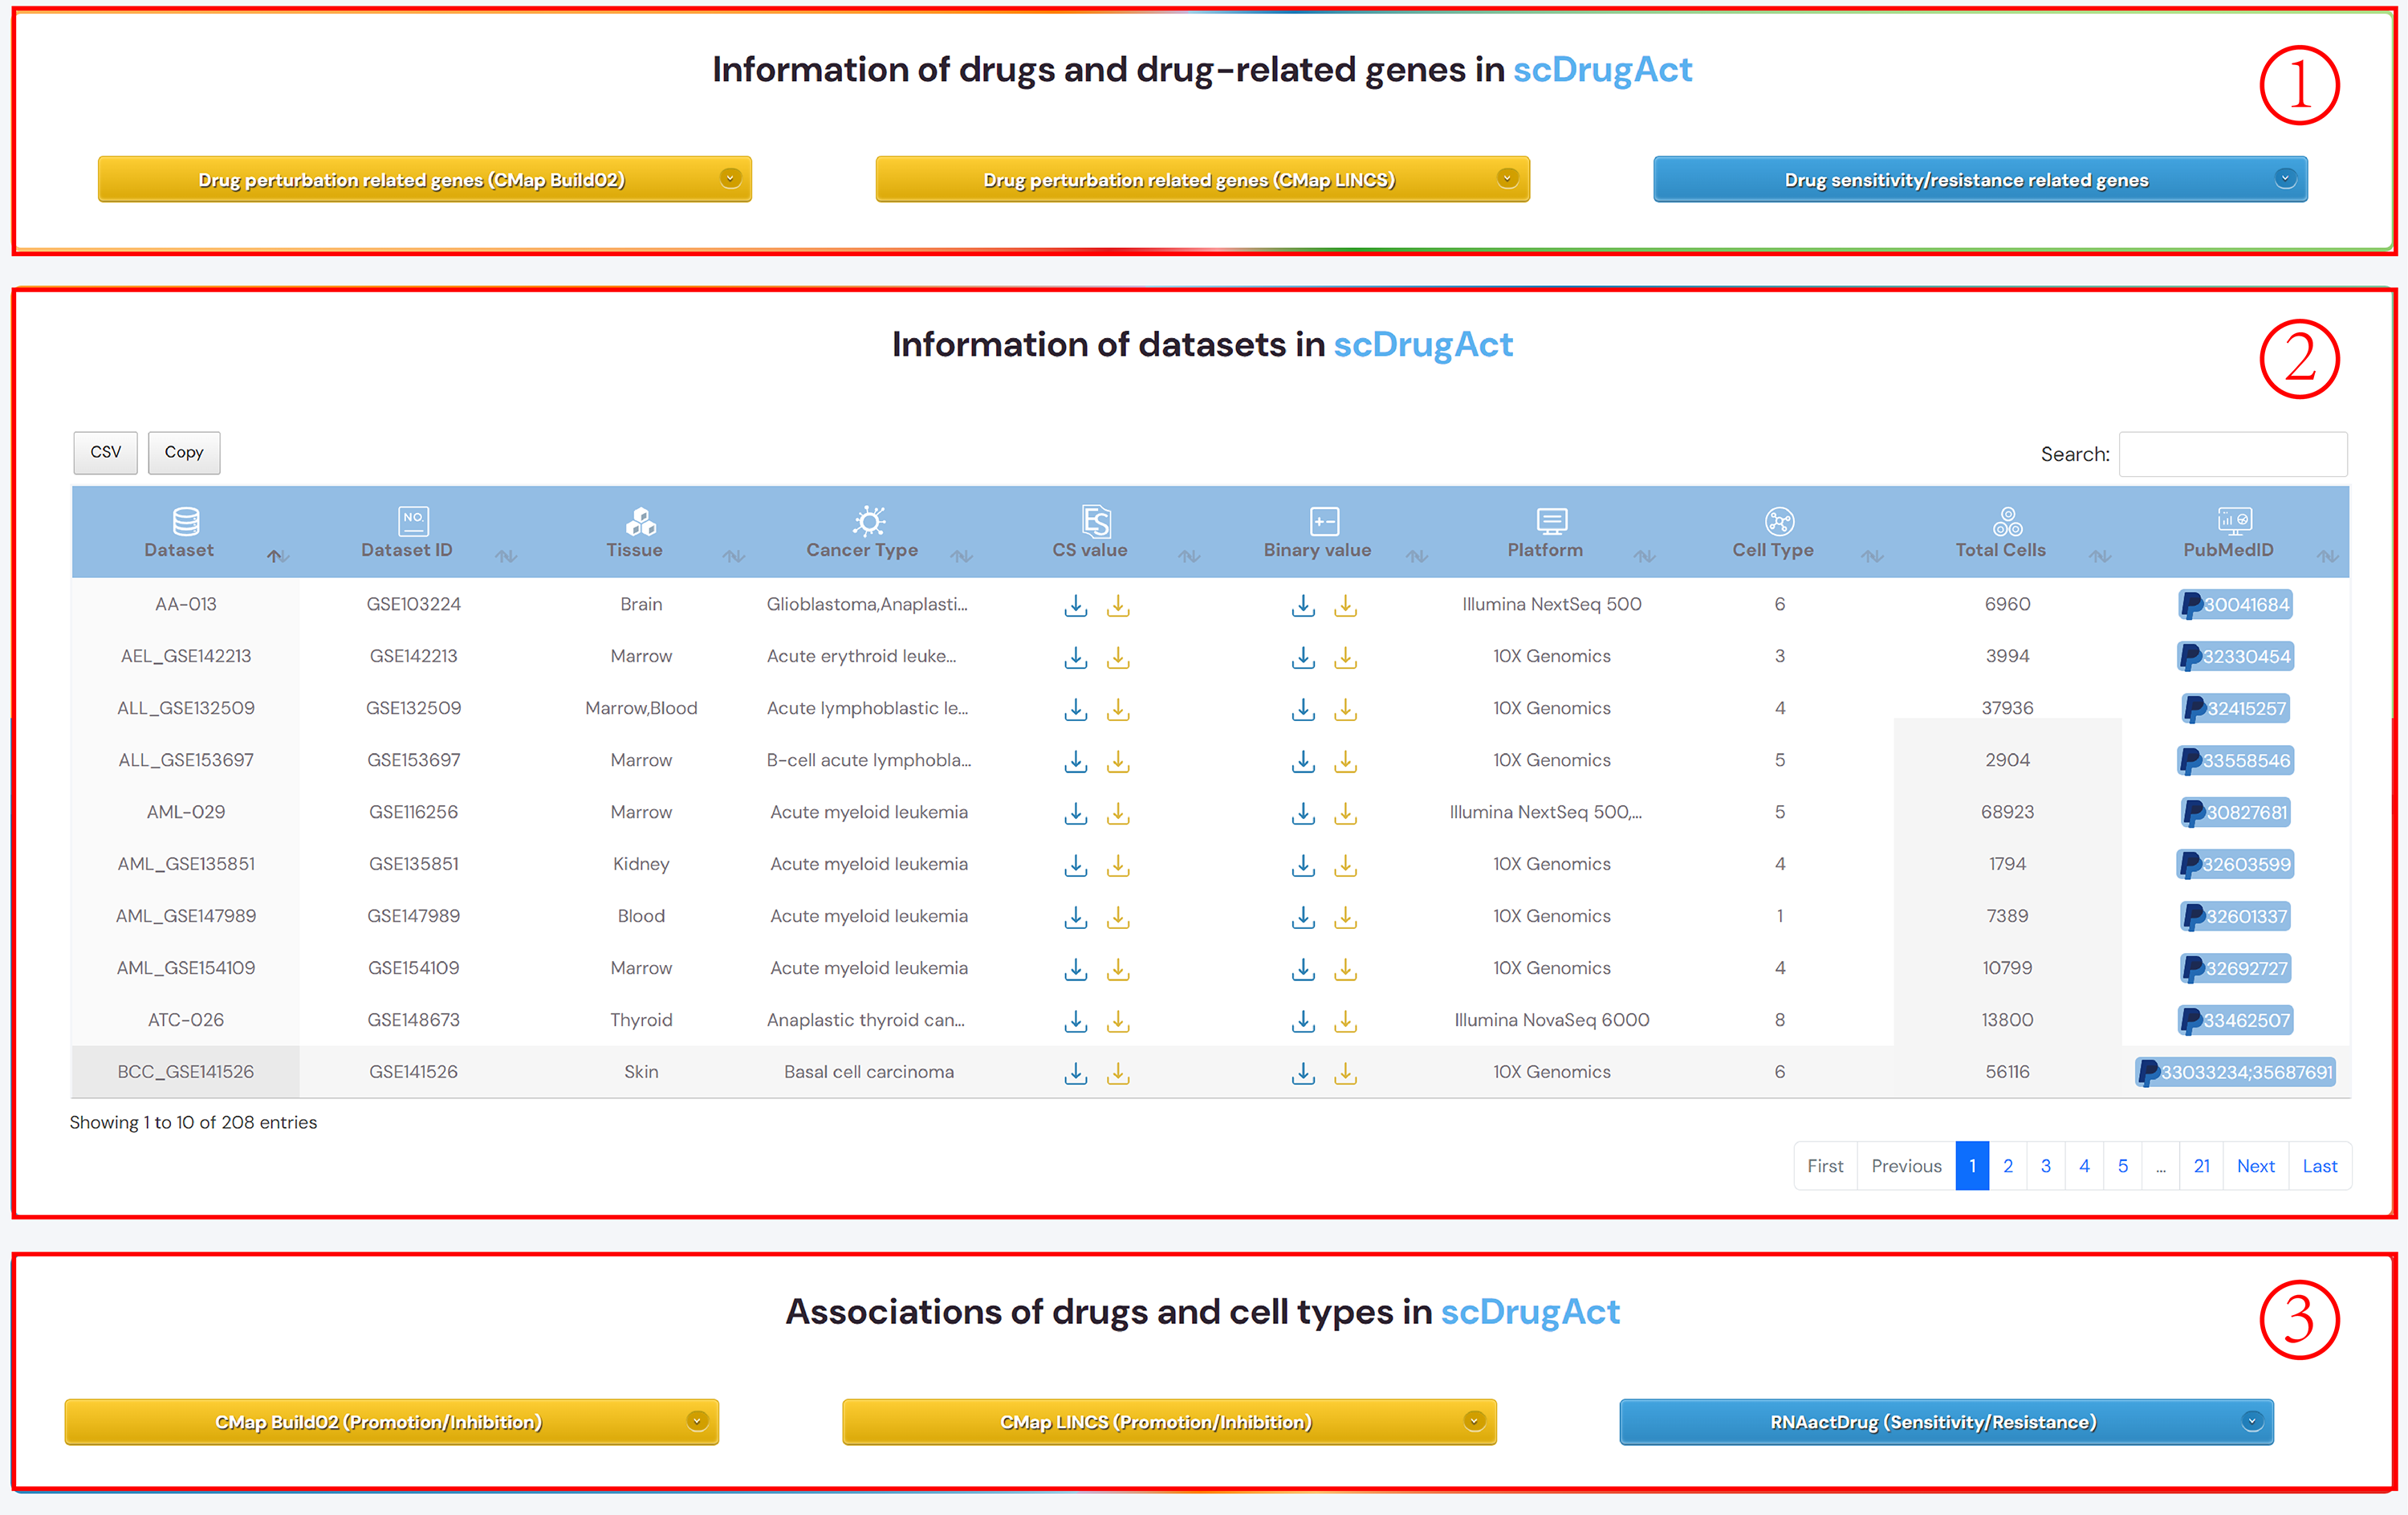
1. The scRNA-seq datasets were collected from CancerSEA, CancerSCEM, TISCH , GEO and ArrayExpress databases. The dataset included a total of 3,811,756 cells from 208 single-cell RNA sequencing (scRNA-seq) datasets for a total of 34 cancer types.
2. ScDrugAct collected drug perturbation related genes from CMap Build02 and the CMap LINCS (level 5) datasets (https://clue.io/data/).
3. Drug sensitivity/resistance genes were collected from our previously constructed database, RNAactDrug (
http://bio-bigdata.hrbmu.edu.cn/ RNAactDrug/ ), in which the drug sensitivity/resistance gene sets were identified based on the correlation between gene expression and drug IC50/GI50 values across cancer cell lines from GDSC, CCLE and CellMiner databases.
Figure 1-2. Identification of drug-cell/cell type associations
1. For each drug, the GSEA algorithm was used to calculate the enrichment scores of the perturbed up-regulated and perturbed down-regulated gene sets in the gene expression ranking list of a single cell, resulting in the ESup and ESdown enrichment scores for the two different gene sets in the cell.
2. The scoring method used in CMap (Subramanian, A. et al. Cell, 2017), which takes into account the ES scoring symbol, is used to integrate the ESup and ESdown scores to obtain the Connectivity Score (CS) for drugs and cells. The Connectivity Score (CS) is a composite, bi-directional version of Kolmogorov-Smirnov enrichment statistic (ES). The higher the CS scoring, the more likely the drug is to cause cell perturbation in a promoting manner, while the lower the CS scoring, the more likely the drug is to cause cell perturbation in an inhibitory manner.
3. Calculate the CS values between all drugs and cells, and obtain the drug-cell CS score profiles.
4. According to the CMap strategy (Subramanian, A. et al. Cell, 2017), a nominal P-value of the drug-cell association was then calculated by comparing the CS between the drug and cell to a null distribution constructed based on random queries.
5. Null distribution of CS scores.
6. The significance of CS scores in the drug-cell CS profiles (obtained in step 3) was evaluated based on the zero distribution of the constructed drug perturbation score in cells. Values with significantly high scores (CS>0, P<0.05) are assigned 1, values with significantly low scores (CS<0, P<0.05) are assigned -1, and others are assigned 0. Here, 1 represents a cell that is a drug promotion cell and -1 represents a cell that is a drug inhibition cell.
7. Combined with cell annotation information, hypergeometric tests were used to evaluate the significance of enriched drug-promoting/inhibitory cells in cell types/cell subpopulations, and cell types/cell subpopulations associated with drug perturbation action (promoting/inhibiting) were obtained.
ScDrugAct uses similar steps above to identify cells associated with drug sensitivity/resistance.
1. scDrugAct's navigation bar.
2. All of scDrugAct's powerful analysis tools.
3. Click the links to go to the corresponding functional interface.
4. scDrugAct's statistical data results.
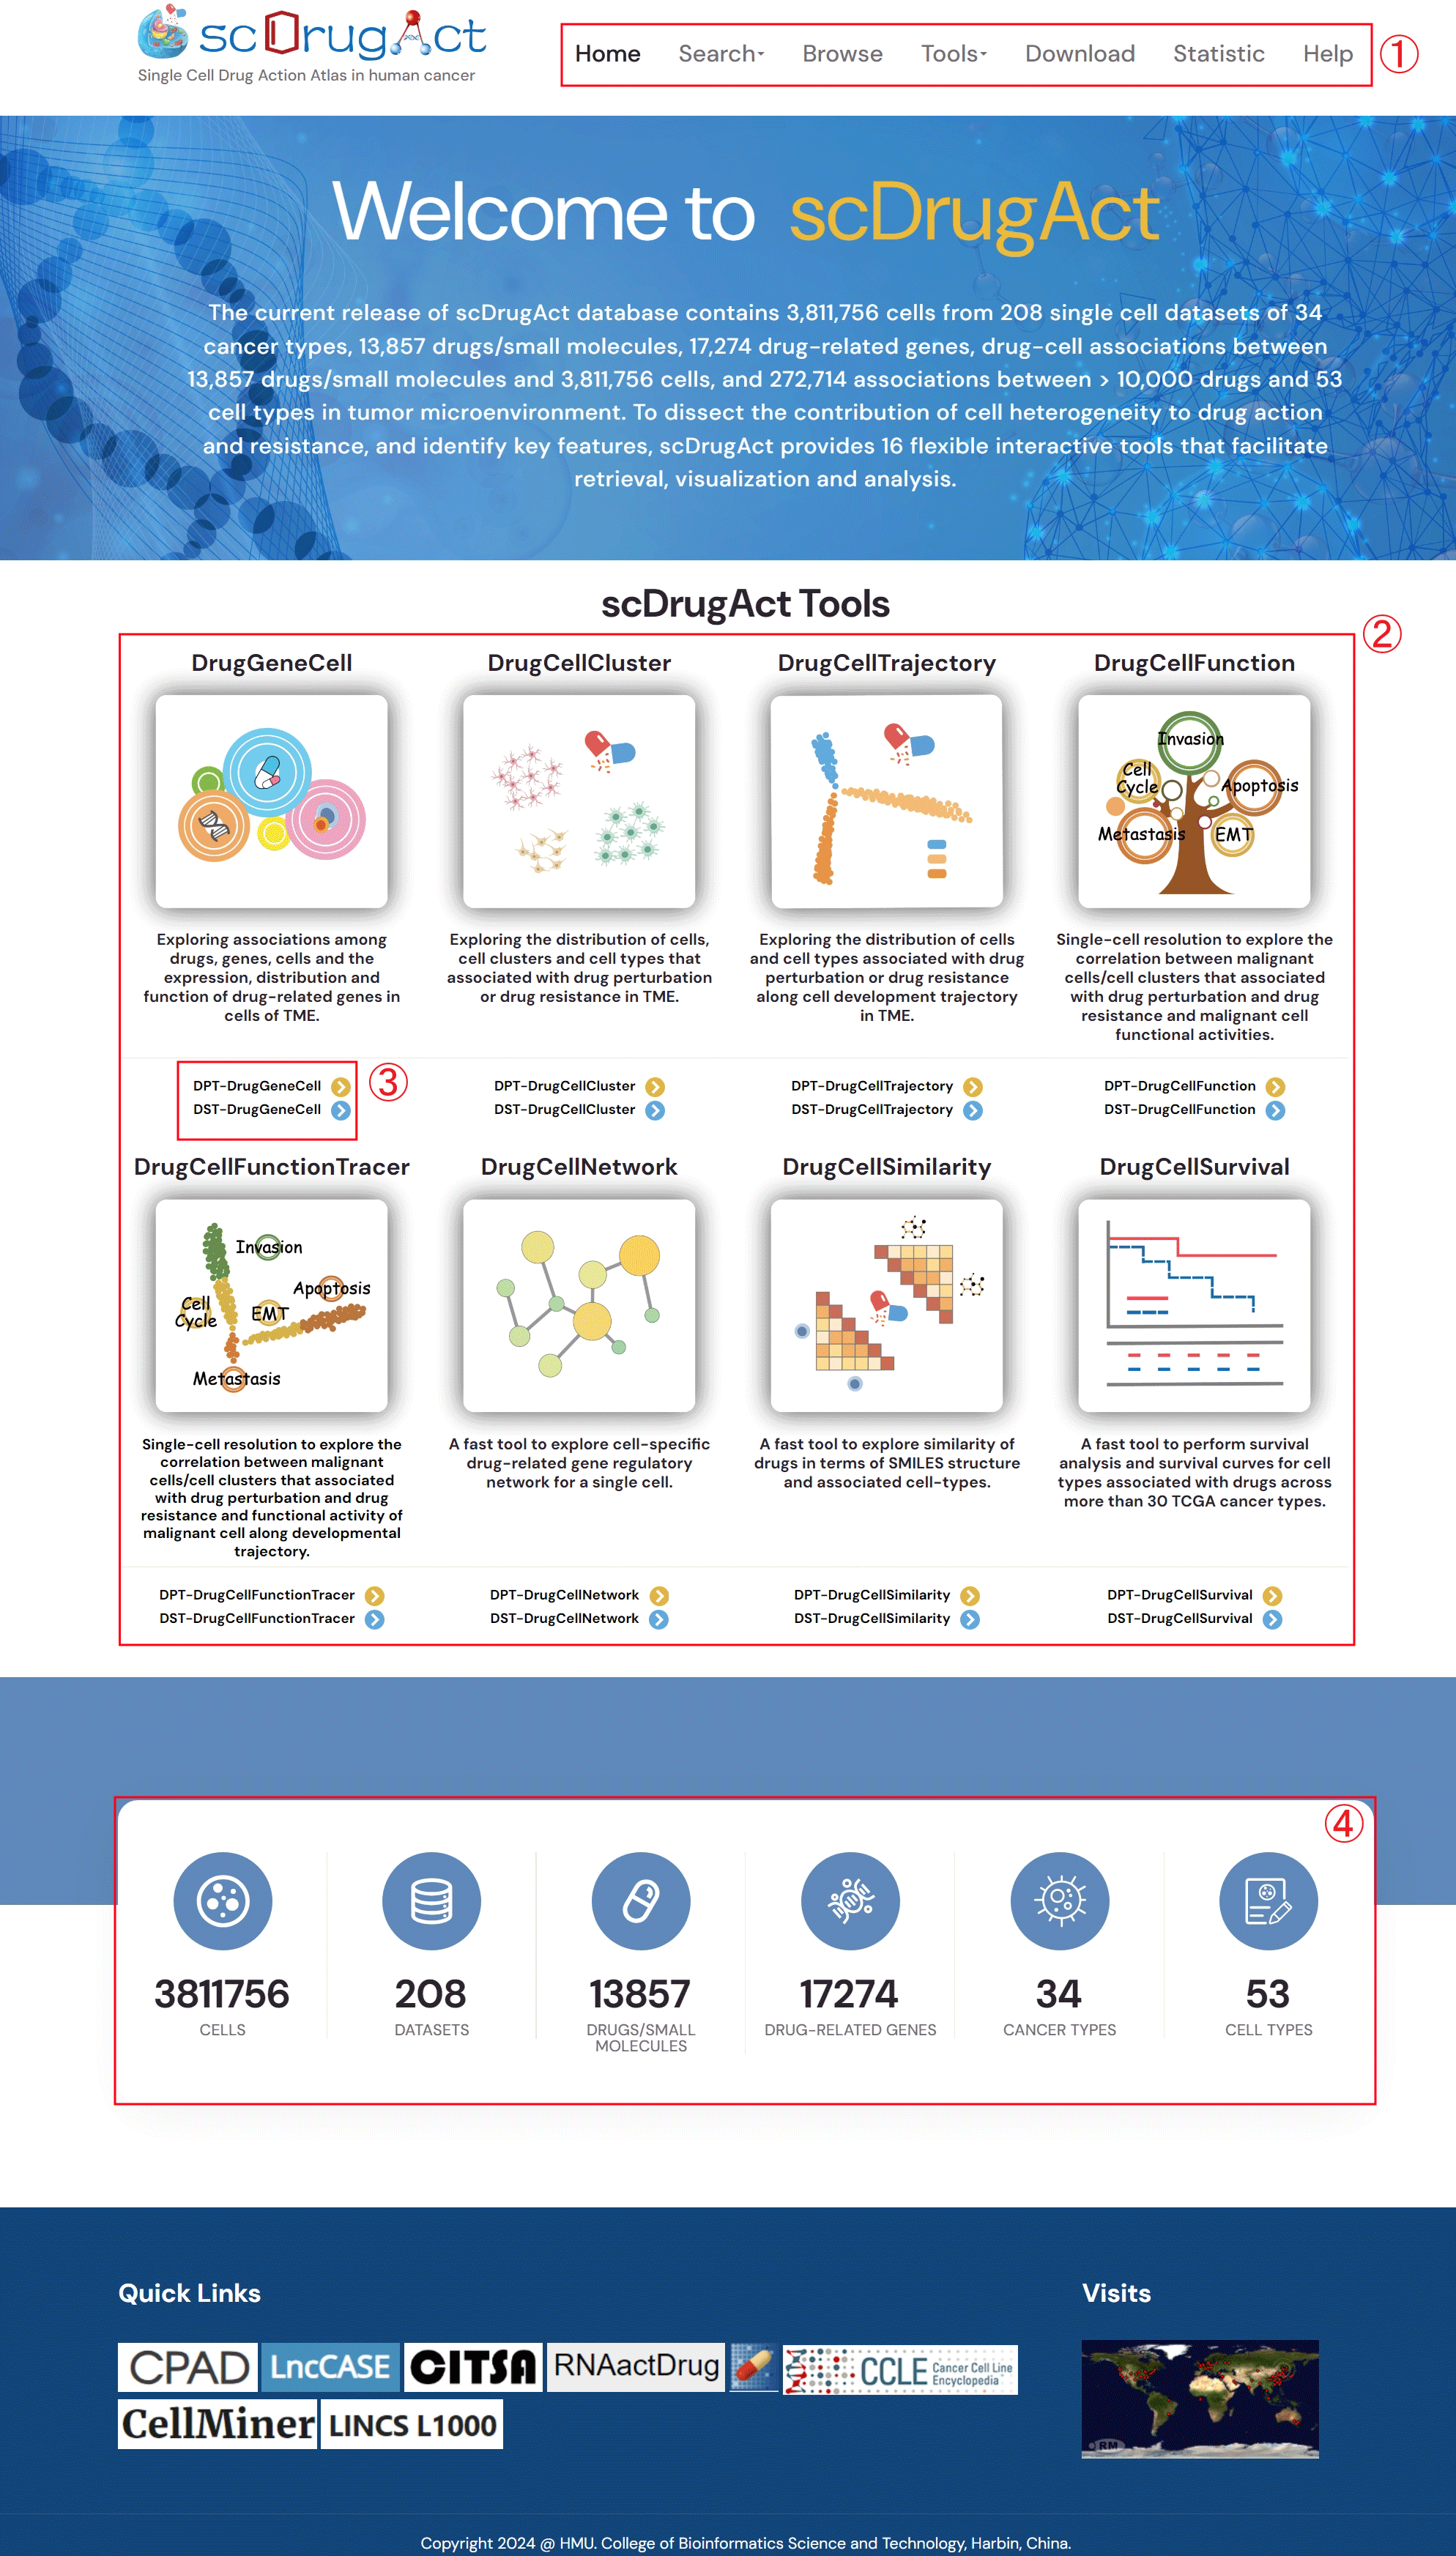
Figure 1-3. scDrugAct's home page.
To explore associations among drugs/small molecules, genes and cells. Users can explore the expression, distribution and function of drug perturbation up-/down-regulated genes in cells of tumor microenvironment. The up-/down-regulated genes of drug perturbation were obtained from the CMap Build02 and CMap LINCS-L1000 dataset (https://clue.io/data/). scDrugAct generates comprehensive analysis results. You can select interested drug and dataset on the right and click "Search" button to get the results below, or you can easily change parameters on the results page and click the button (Refresh) next to it to get the results page updated in real time.
1. Click the "Drug name" or "Drug SMILES" button to select your preferred
drug identification method. Click on the three dropdown menus to choose
the desired drug source, drug name, and the corresponding dataset, then
click the "Submit" button to view the results.
2. Bubble chart of drug-related up/down gene expression across different cell types.
3. Click on the three dropdown menus to change the parameters. Select the desired
Cell group, Color type (CellType, Patient, Sample, Source-type, Tissue),
and Drug-related gene (up or down). Click the button (Refresh) to update
the results.
4. Single-cell clustering maps at different resolutions in the tumor microenvironment.
5. Single-cell clustering maps colored by different types (CellType, Patient, Sample,
Source-type, Tissue).
6. Single-cell clustering maps of drug-related up/down gene expression.
7. Box plots of gene expression across different clusters.
8. Box plots of gene expression across different cell types.
9. Distribution plots of gene expression across different cell types.
10. Tree plots of drug-related up/down gene functional enrichment, with clickable gene
nodes to display related functions.Bar Plot of the Top 10 GO Terms from
Gene Ontology Enrichment Analysis.
Users can explore the degree of the drug action (promotion/inhibition) on cells, clusters and cell types (i.e. the degree of response of cells, clusters and cell types upon drug perturbation) in tumor microenvironment. ScDrugAct generates comprehensive analysis results. You can select interested drug and dataset on the right and click "Search" button to get the results below, or you can easily change parameters on the results page and click the button (Refresh) next to it to get the results page updated in real time. In the result page, the drug action score reflects the degree of the drug action on cells. Click to see details about drug action score.
1.Click the "Drug name" or "Drug SMILES" button to select your preferred drug identification method. Click on the three dropdown menus to choose the desired drug source, drug name, and the corresponding dataset, then click the "Submit" button to view the results.
2.Basic information about the selected drug, including drug name, molecular formula, molecular weight, smiles, cid, synonyms.
3.Basic information about the selected dataset, including dataset name, accession number, cancer type, tissue information, platform details, cell count, patients count, samples count, cancer source, celltypes, pubMed ID, treatment information.
4.The information on the degree of association between cell types in the selected dataset and the promotion/inhibition to the selected drug.
5.The information on the degree of association between clusters in the selected dataset and the promotion/inhibition to the selected drug.
6.Click on each of the three dropdown menus to change the parameters: select the Cell group of interest, the Color type (CellType, Patient, Sample, Source-type, Tissue), and the Drug action score (CS value or Binary value). Then, click the button (Refresh) button to update the results.
7.Single-cell clustering maps at different resolutions in the tumor microenvironment.
8.Single-cell clustering maps colored by different types (CellType, Patient, Sample, Source-type, Tissue).
9.Single-cell clustering maps colored by different drug action scores (CS value or Binary value).
10.Boxplot of drug action score across different clusters.
11.Boxplot of drug action score across different cell types.
12.Distribution of drug action score across different cell types.
Users can explore the degree of the drug action (promotion/inhibition) on cells, clusters and cell types (i.e. the degree of response of cells, clusters and cell types upon drug treatment) along cell development trajectory in tumor microenvironment. You can select interested drug and dataset on the right and click "Search" button to get the results below, or you can easily change parameters on the results page and click the button (Refresh) next to it to get the results page updated in real time. In the result page, the drug action score reflects the degree of the drug action on cells. Click to see details about drug action score.
1.Click the "Drug name" or "Drug SMILES" button to select your preferred drug identification method. Click on the three dropdown menus to choose the desired drug source, drug name, and the corresponding dataset, then click the "Submit" button to view the results.
2.Basic information about the selected drug, including drug name, molecular formula, molecular weight, smiles, cid, synonyms.
3.Basic information about the selected dataset, including dataset name, accession number, cancer type, tissue information, platform details, cell count, patients count, samples count, cancer source, celltypes, pubMed ID, treatment information.
4.The information on the degree of association between cell types in the selected dataset and the promotion/inhibition to the selected drug.
5.The information on the degree of association between clusters in the selected dataset and the promotion/inhibition to the selected drug.
6.Click on each of the three dropdown menus to change the parameters: select the Cell group of interest, the Color type (Pseudotime, CellType, Patient, Sample, Source-type, Tissue), and the drug action score (CS value or Binary value). Then, click the button (Refresh) button to update the results.
7.Cell trajectory maps at different resolutions in the tumor microenvironment.
8.Cell trajectory maps colored by different types (Pseudotime, CellType, Patient, Sample, Source-type, Tissue).
9.Cell trajectory maps based on different drug action scores (ES value, Binary value).
10.Boxplot of drug action score across different clusters.
11.Boxplot of drug action score across different cell types.
12.Scatter plot of drug action scores of cells across different cell types along pseudotime trajectories.
Single-cell resolution to explore the association of drug action of malignant cells/cell clusters and malignant cell functional activities including oncogenic pathway function, cancer hallmark function and functional status. ScDrugAct generates comprehensive analysis results. You can select interested drug and dataset on the right and click "Search" button to get the results below, or you can easily change parameters on the results page and click the button (Refresh) next to it to get the results page updated in real time. In the result page, the drug action score reflects the degree of the drug action on cells. Click to see details about drug action score.
1.Click the "Drug name" or "Drug SMILES" button to select your preferred drug identification method. Click on the three dropdown menus to choose the desired drug source, drug name, and the corresponding dataset, then click the "Submit" button to view the results.
2.Click the four dropdown menus to select the Cell group, Drug action score (CS value or Binary value), Functional/status activity category, and subcategory of interest, then click the button (Refresh) button to update the results.
3.Single-cell clustering maps of malignant cells in different clusters.
4.Single-cell clustering maps of malignant cells colored by drug action scores.
5.Single-cell clustering maps of malignant cells colored by functional activity scores.
6.Scatter plot showing the correlation between drug action scores and functional activity scores in malignant cells.
7.Bubble plot of average functional activity in malignant cell clusters (bubble size: proportion of cells in the cluster to the total number of cells; bubble color: average functional activity score).
DrugCellFunctionTracer tool is used to analyze malignant cells. Single-cell resolution to explore correlation between drug response and functional activity of malignant cell along developmental trajectory. The functional activity of malignant cell in terms of functional status, oncogenic pathways, and cancer hallmarks. scDrugAct generates comprehensive analysis results. You can select interested drug and dataset on the right and click "Search" button to get the results below, or you can easily change parameters on the results page and click the button (Refresh) next to it to get the results page updated in real time. In the result page, the drug action score reflects the degree of the drug action on cells. Click to see details about drug action score.
1.Click the "Drug name" or "Drug SMILES" button to select your preferred drug identification method. Click on the three dropdown menus to choose the desired drug source, drug name, and the corresponding dataset, then click the "Submit" button to view the results.
2.Click the four dropdown menus to select the Cell group, Drug action score (CS value or Binary value), Functional/status activity category, and subcategory of interest, then click the button (Refresh) button to update the results.
3.Cell trajectory plot of malignant cells.
4.Cell trajectory plot of malignant cells colored by different drug action scores (CS value, Binary value).
5.Cell trajectory plot of malignant cells colored by functional activity scores.
6.Scatter plot showing the correlation between drug action scores and functional activity scores in malignant cells.
7.Cell trajectory plot of malignant cells colored by pseudotime.
8.Bubble plot of average functional activity scores at four different time points (bubble size: proportion of cell clusters; bubble color: average functional activity score).
A fast tool to explore cell-specific drug-perturbed gene regulatory network for a single cell.
1.Click the “Drug name” or “Drug SMILES” button to select the drug identification method you wish to use. Select the drug source, drug name, corresponding dataset, and cell name from the four dropdown menus respectively. Click the “Submit” button to view the results.
2.Click the "All drug-related genes" button to display the gene regulatory network diagram of all cell-specific genes related to drugs. Click the "One step of all genes" button to display the one-step neighbor gene regulatory network diagram of all cell-specific genes related to drugs. Circle color fill: level of gene expression. Red circle border: Drug effects up-regulate gene; Blue circle border: Drug effects down-regulate gene.
A fast tool to explore similarity of SMILES structure of drugs and similarity (Jaccard coefficient) of response cell-types of drugs.
1.Click on the dataset of interest, "CMap Build02" or "CMap LINCS" button. You can either select a drug name in the "search" box or double-click on the drug name in the "Available options" dropdown to add it to the "Selected options" dropdown on the right. Click the "Submit" button to view the results. "Add" will add the drug to the right dropdown. "Remove" will delete the drug from the right dropdown. "Remove all" will delete all drugs from the right dropdown.
2.Heatmap of the similarity of SMILES structures of drugs and the similarity (Jaccard coefficient) of response cell types of drugs.
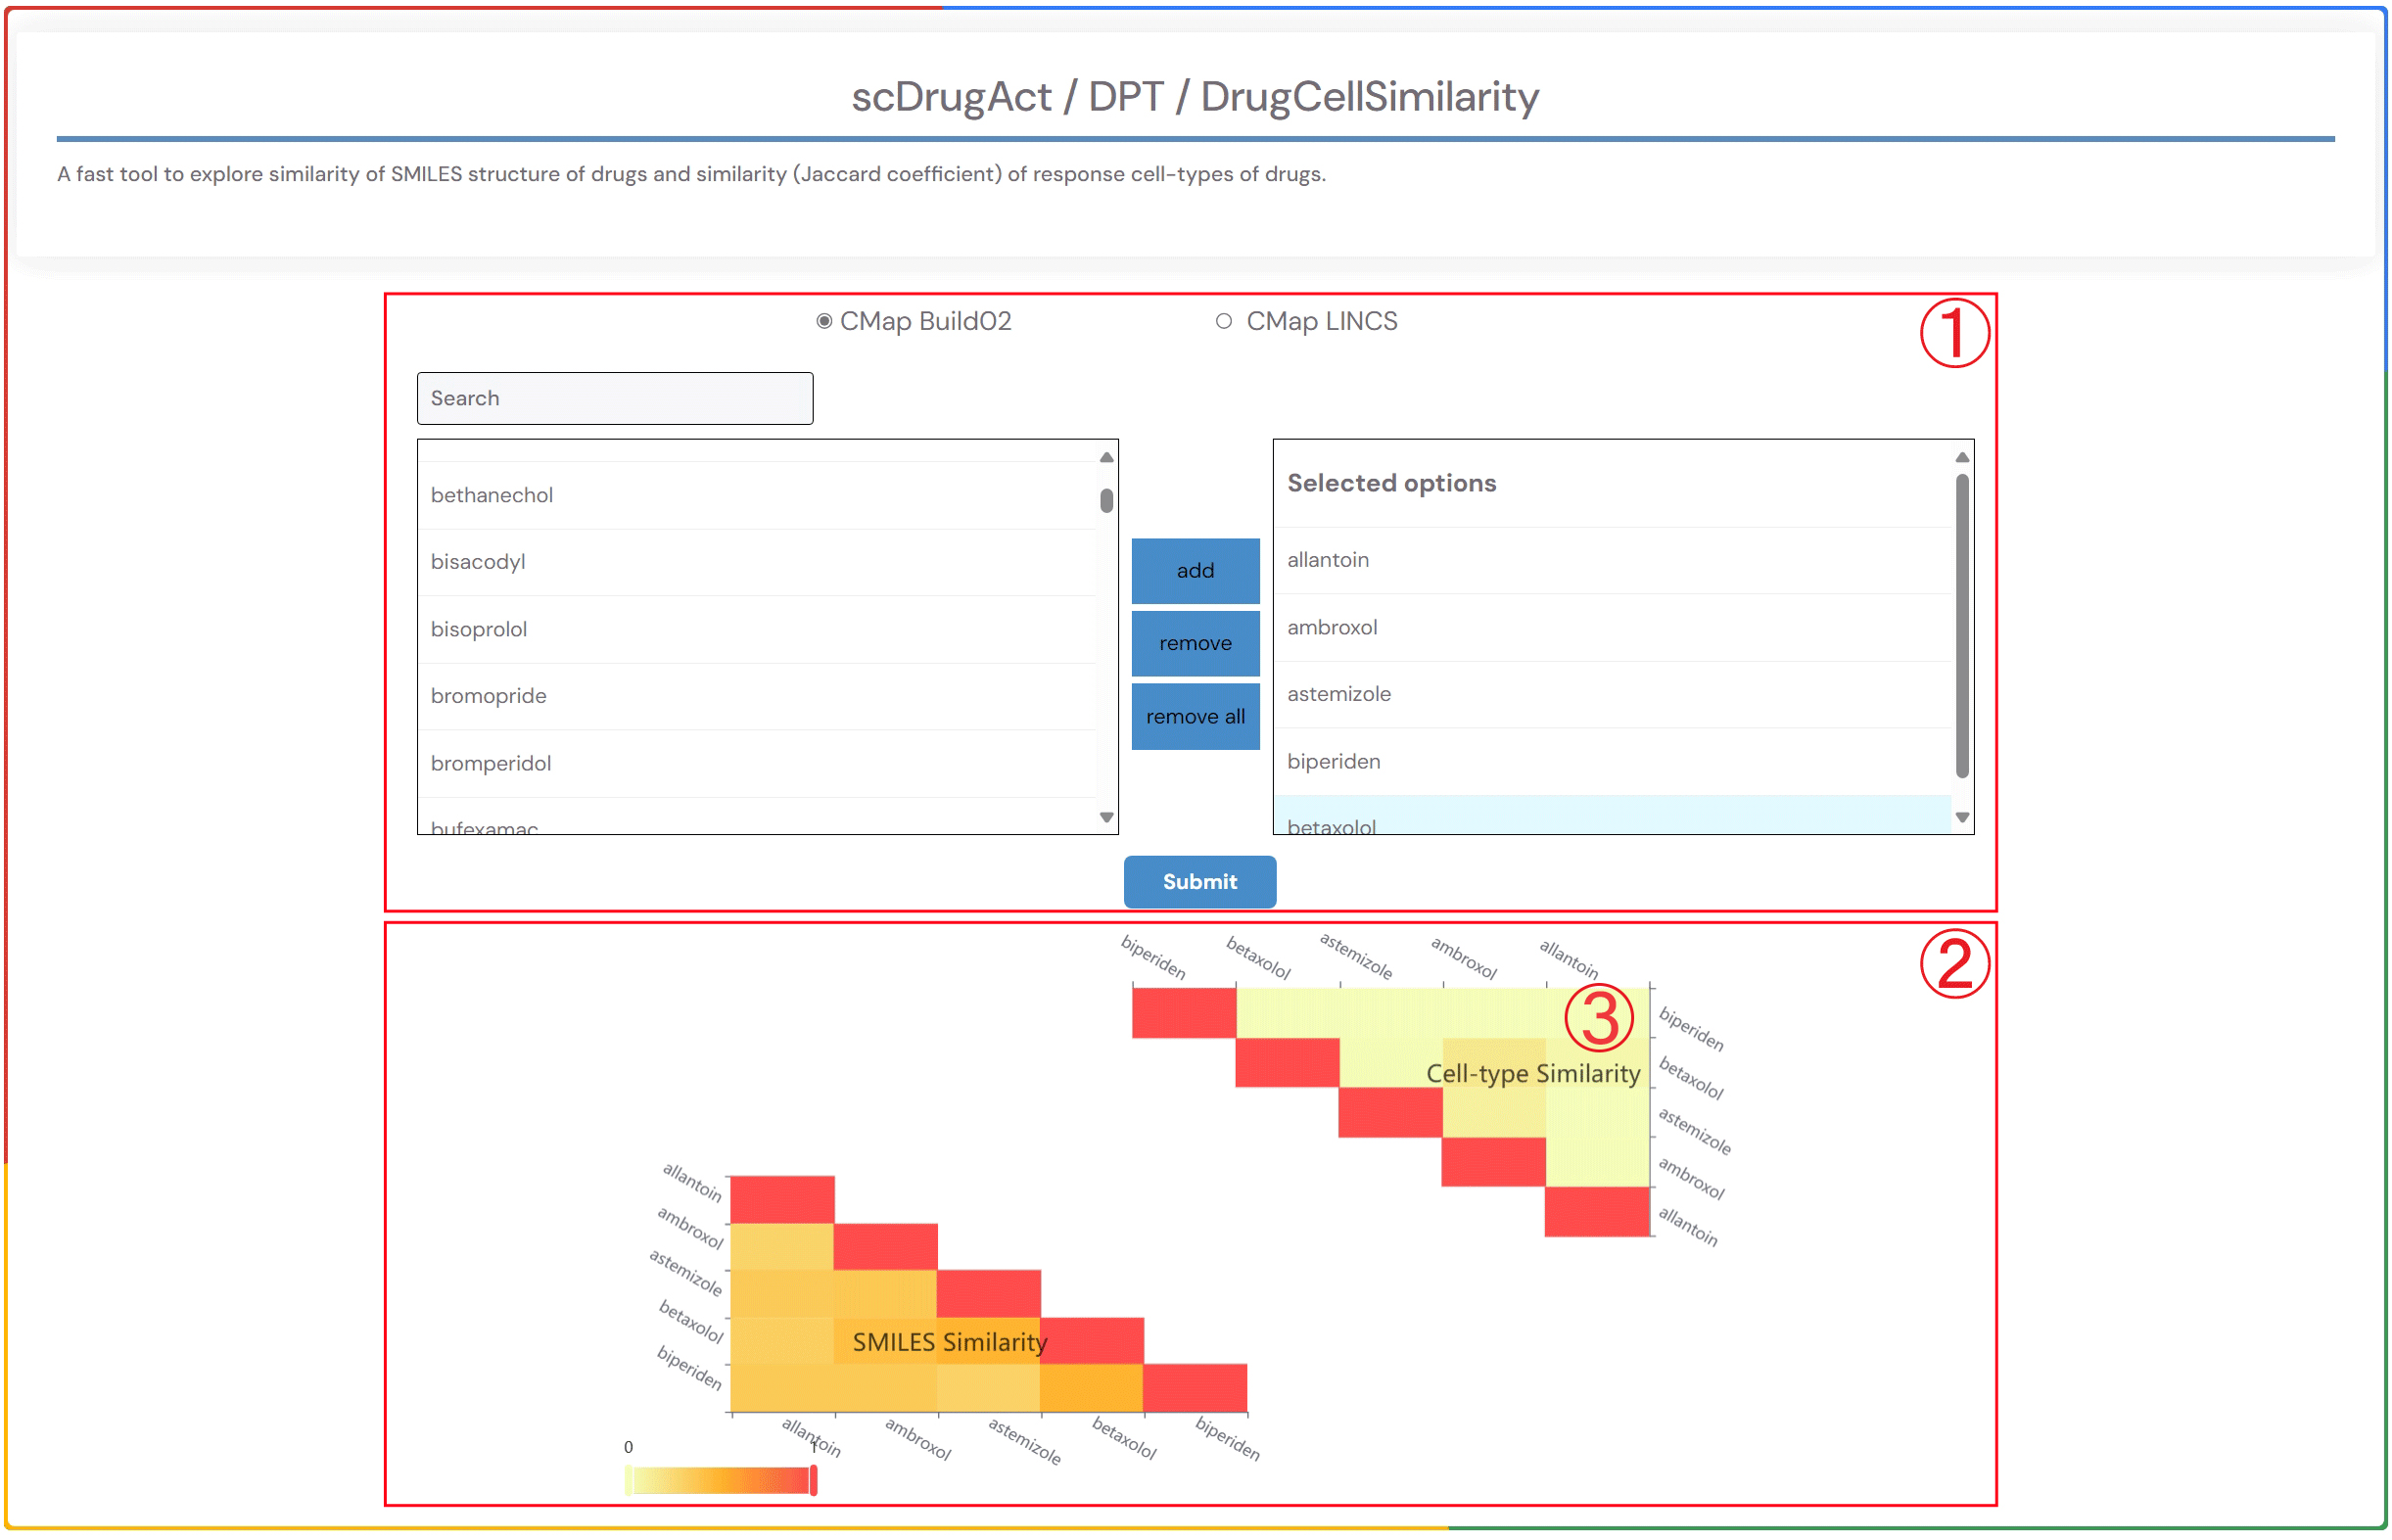
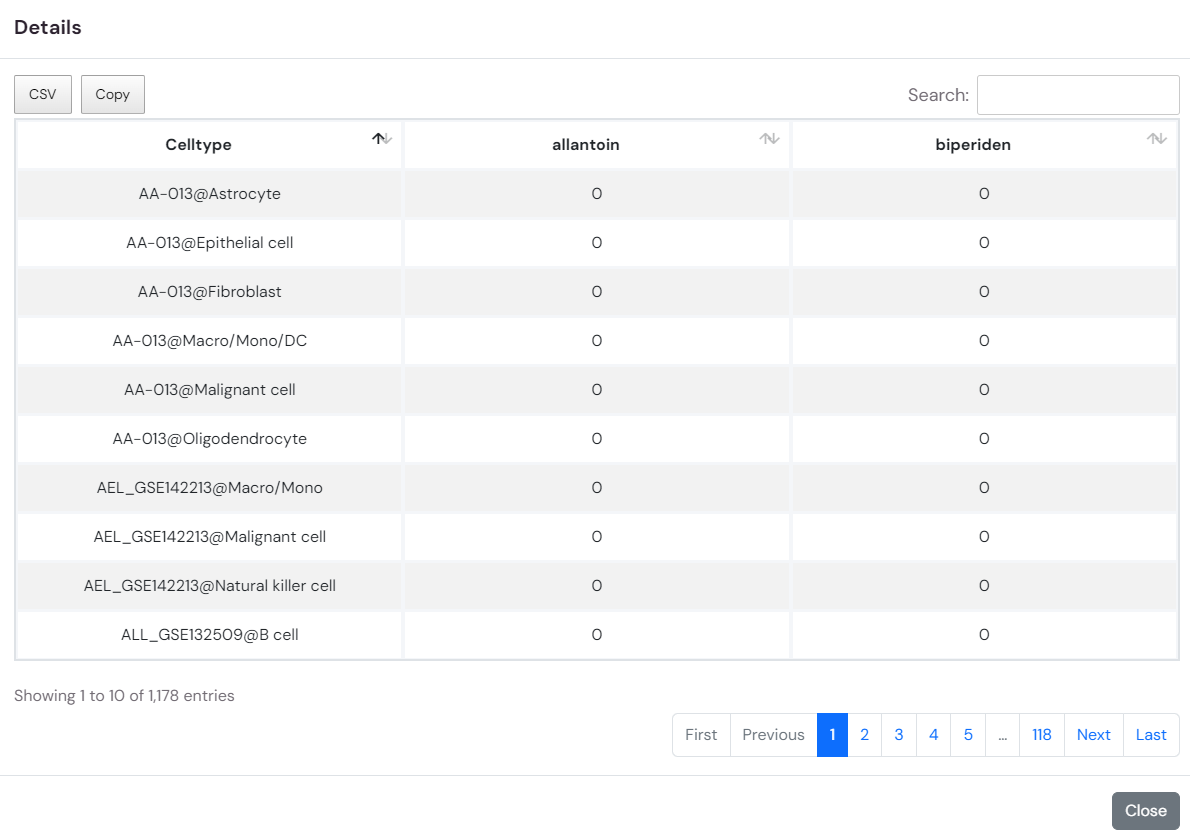
3.By clicking on the heatmap element showing the similarity (Jaccard coefficient) of drug response cell types, you can access detailed information on the effects of the related drug across various cell types in different datasets within the database.
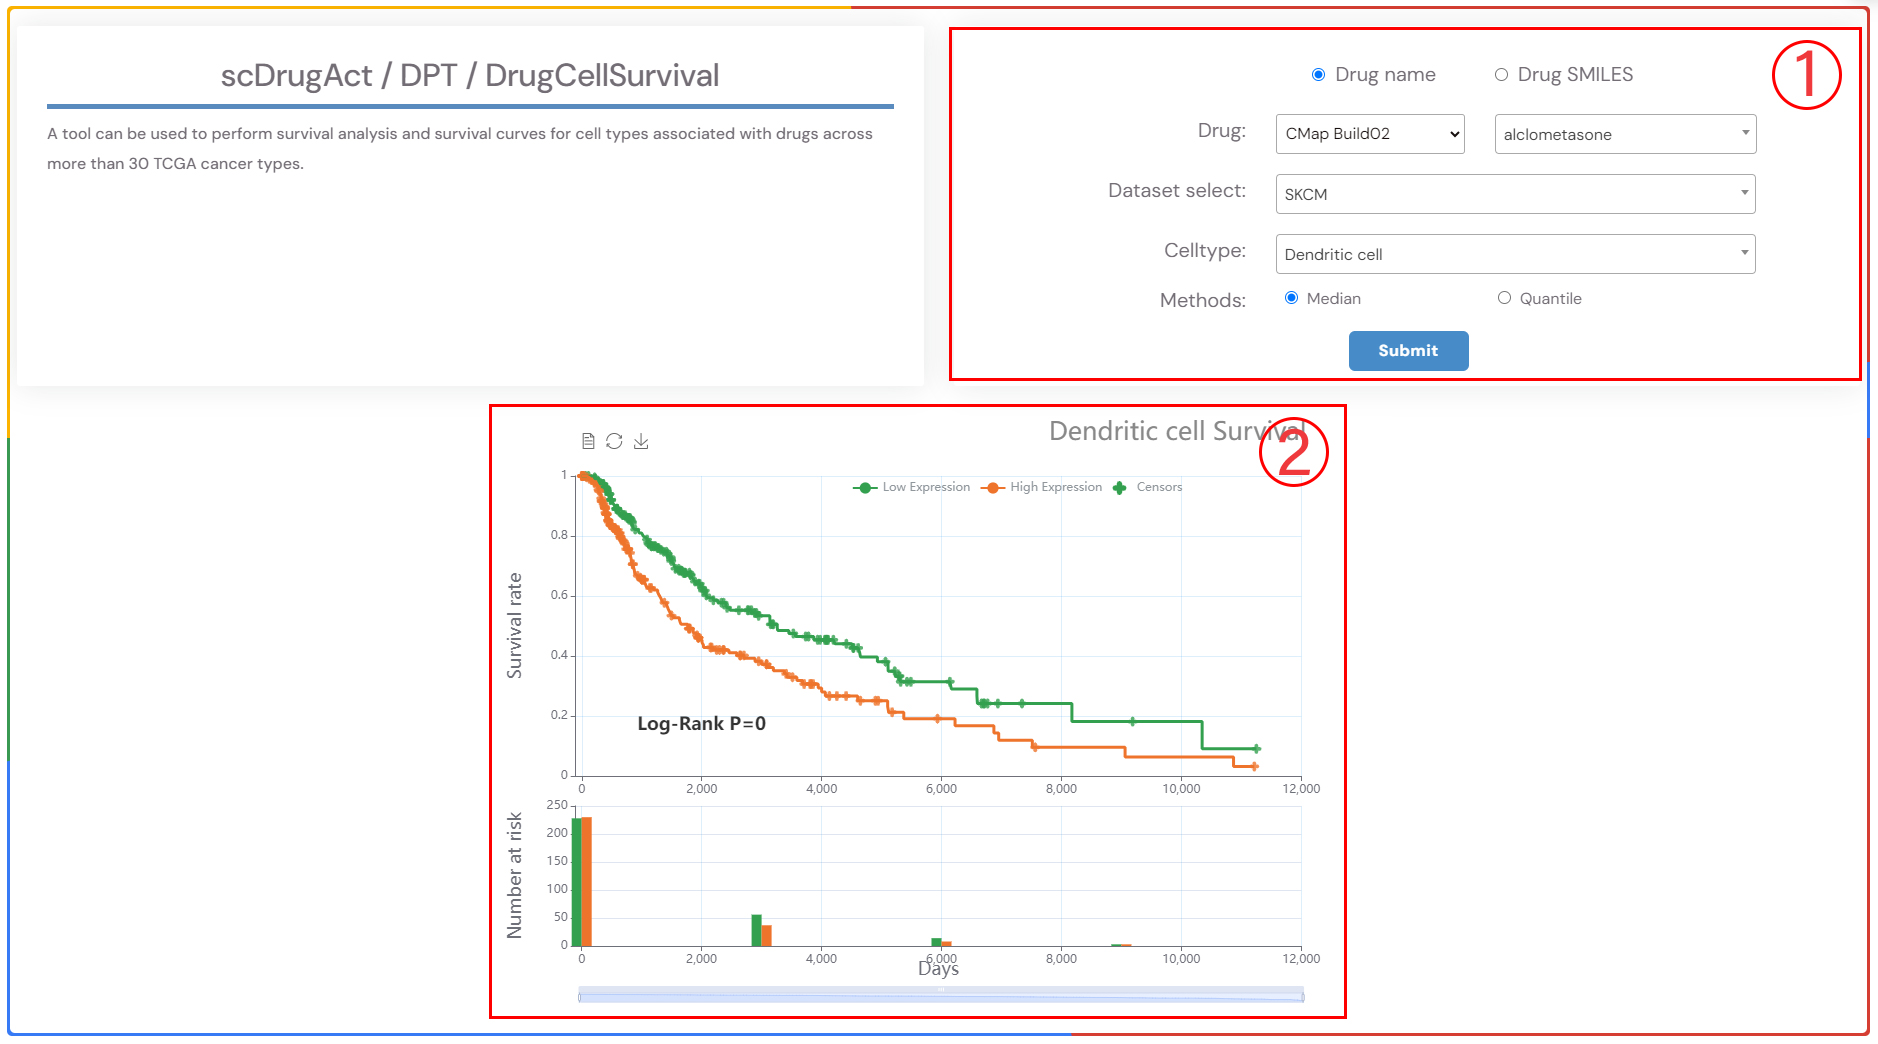
A tool can be used to perform survival analysis and survival curves for cell types associated with drugs across more than 30 TCGA cancer types.
1.Select a drug, the cancer type, and the corresponding cell type of interest from the three dropdown menus. Choose the survival analysis method (‘Median’ or ‘Quartiles’), and then click the ‘Submit’ button to view the results. ‘Median’ refers to the time at which 50% of individuals are still alive, while ‘Quartiles’ includes other percentiles in addition to the median survival time..
2.Survival analysis result plot.
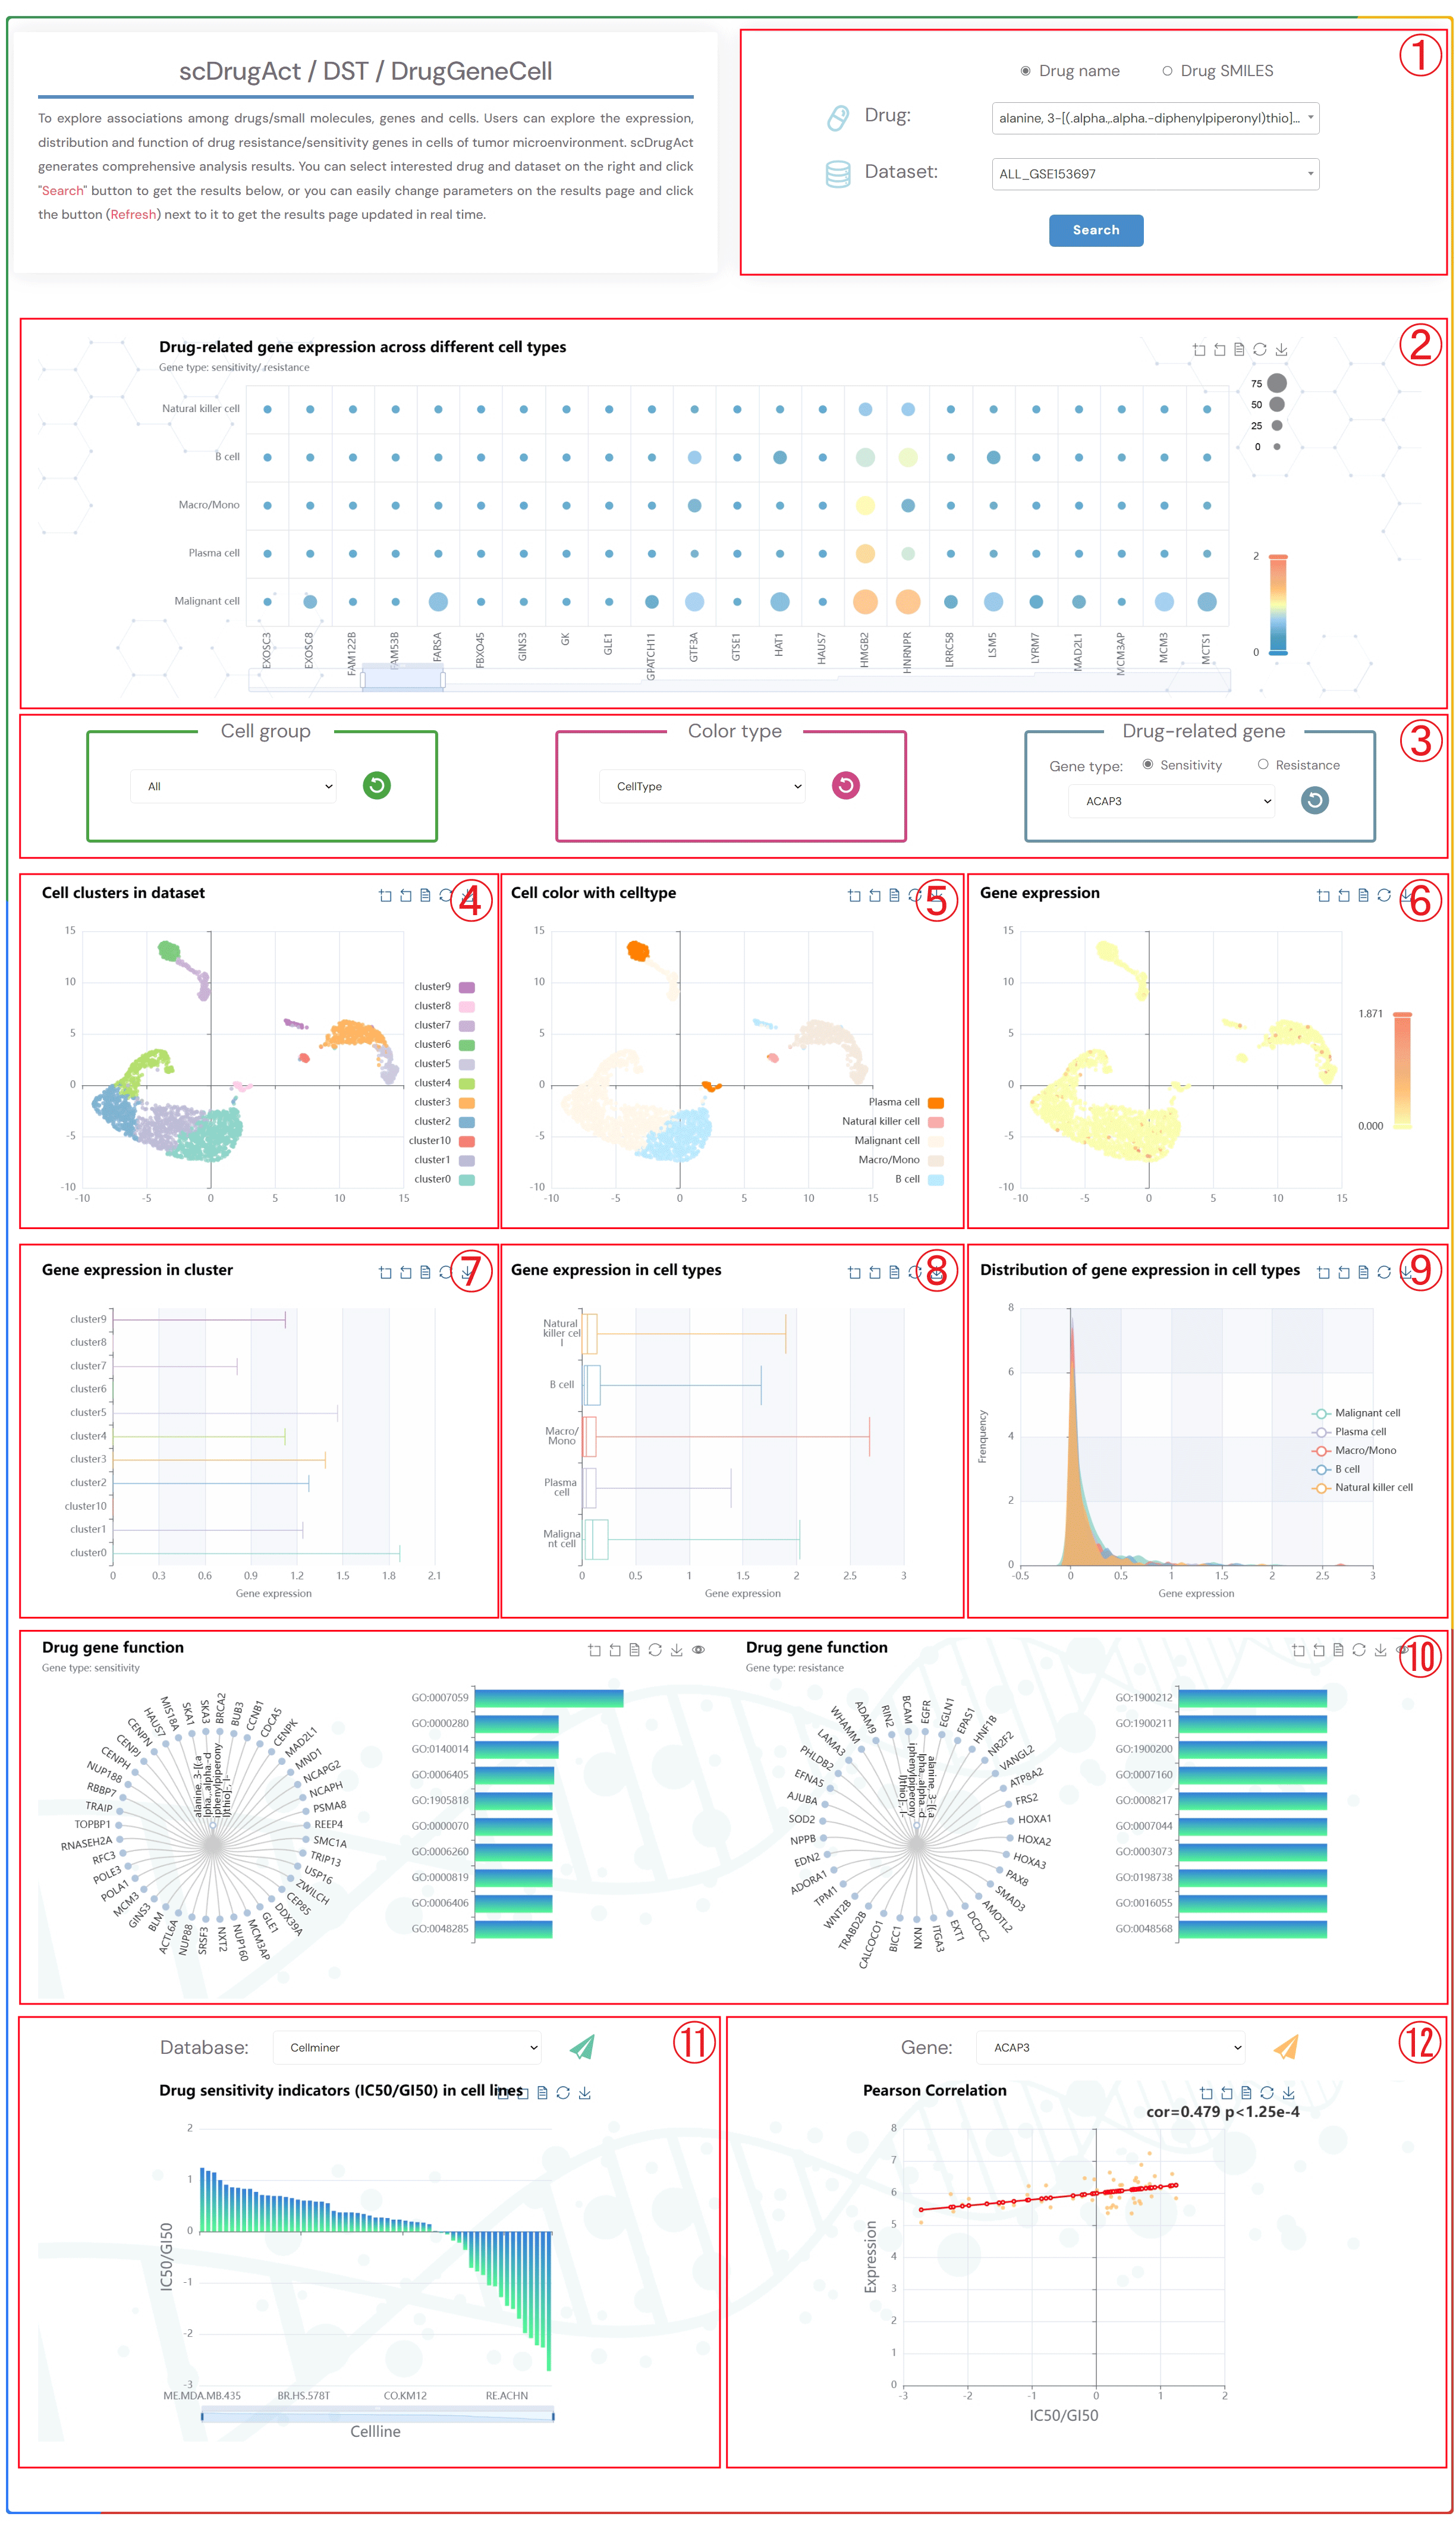
To explore associations among drugs/small molecules, genes and cells. Users can explore the expression, distribution and function of drug resistance/sensitivity genes in cells of tumor microenvironment. scDrugAct generates comprehensive analysis results. You can select interested drug and dataset on the right and click "Search" button to get the results below, or you can easily change parameters on the results page and click the button (Refresh) next to it to get the results page updated in real time.
1.Click the “Drug name” or “Drug SMILES” button to select the drug identification method you wish to use. Click on the two dropdown menus to choose the desired drug name and the corresponding dataset, then click the "Submit" button to view the results.
2.Bubble chart of drug-related resistance/sensitivity gene expression across different cell types.
3.Click on the three dropdown menus to change the parameters. Select the desired Cell group, Color type (CellType, Patient, Sample, Source-type, Tissue), and Drug-related gene (Sensitivity or Resistance). Click the button (Refresh) to update the results.
4.Single-cell clustering maps at different resolutions in the tumor microenvironment.
5.Single-cell clustering maps colored by different types (CellType, Patient, Sample, Source-type, Tissue).
6.Single-cell clustering maps of drug-related resistance/sensitivity gene expression.
7.Box plots of gene expression across different clusters.
8.Box plots of gene expression across different cell types.
9.Distribution plots of gene expression across different cell types.
10.Tree plots of drug-related resistance/sensitivity gene functional enrichment, with clickable gene nodes to display related functions.Bar Plot of the Top 10 GO Terms from Gene Ontology Enrichment Analysis.
11. Bar chart of the drug sensitivity indicators (IC50/GI50) values in different Cell Lines.
12. Scatter diagram of the correlation between IC50/GI50 values and gene expression.
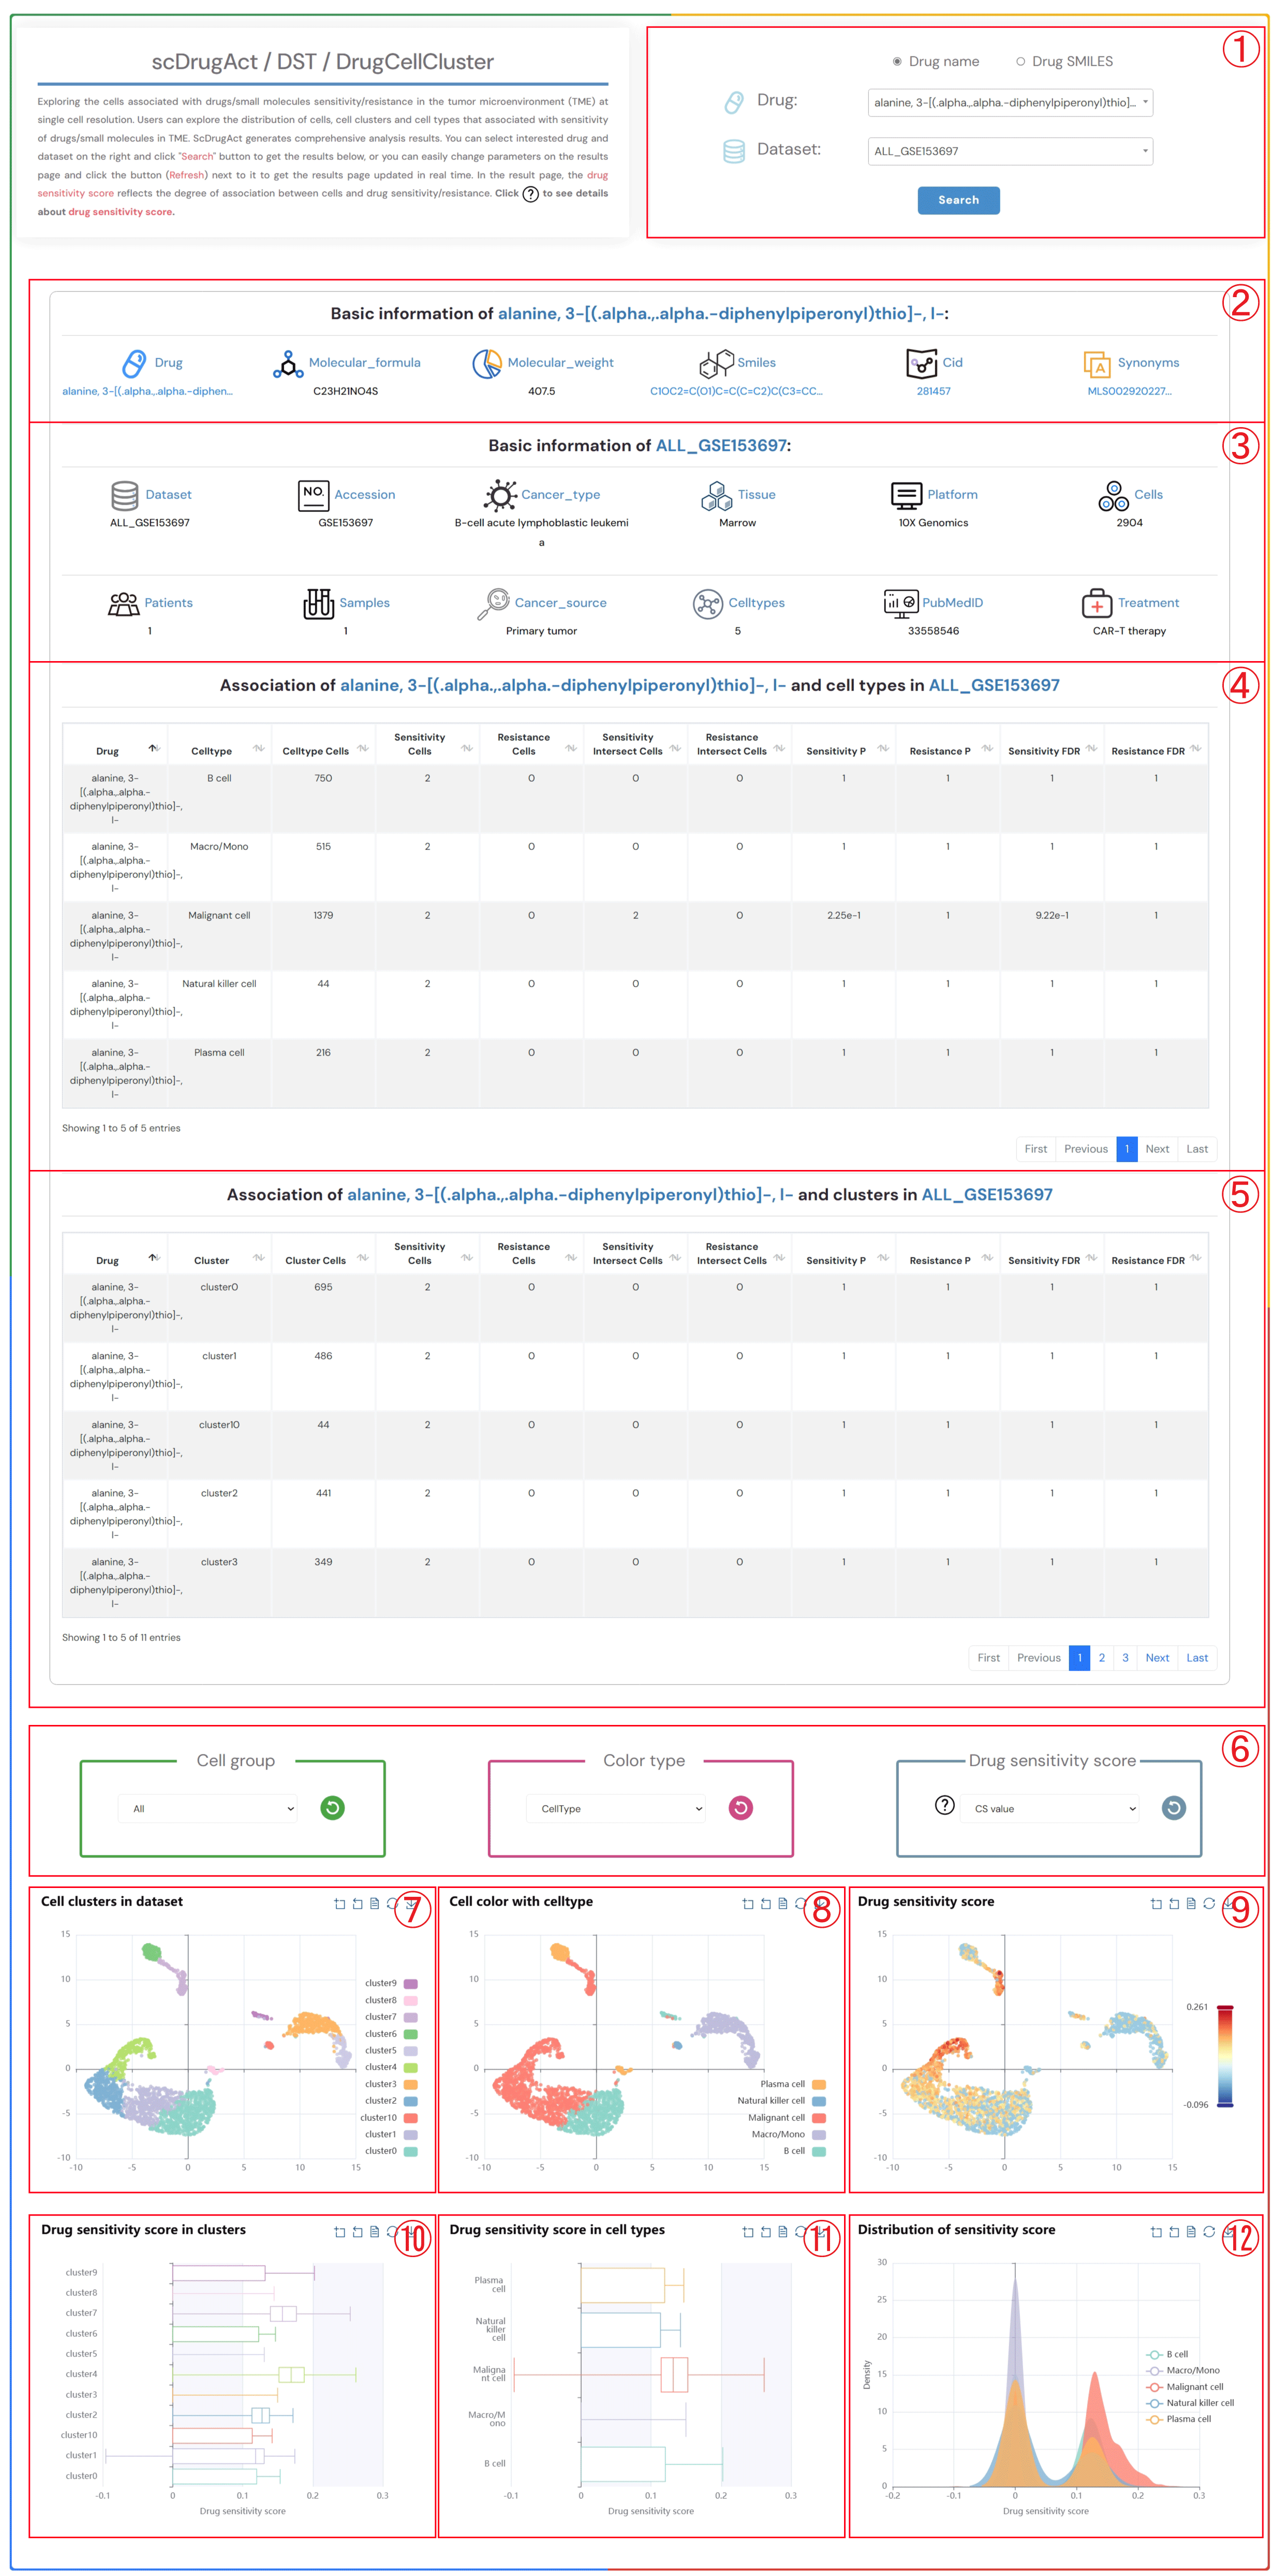
Exploring the cells associated with drugs/small molecules sensitivity/resistance in the tumor microenvironment (TME) at single cell resolution. Users can explore the distribution of cells, cell clusters and cell types that associated with sensitivity of drugs/small molecules in TME. ScDrugAct generates comprehensive analysis results. You can select interested drug and dataset on the right and click "Search" button to get the results below, or you can easily change parameters on the results page and click the button (Refresh) next to it to get the results page updated in real time. In the result page, the drug sensitivity score reflects the degree of association between cells and drug sensitivity/resistance. Click to see details about drug sensitivity score.
1.Click the “Drug name” or “Drug SMILES” button to select the drug identification method you wish to use. Click on the two dropdown menus to choose the desired drug name and the corresponding dataset, then click the "Submit" button to view the results.
2.Basic information about the selected drug, including drug name, molecular formula, molecular weight, smiles, cid, synonyms.
3.Basic information about the selected dataset, including dataset name, accession number, cancer type, tissue information, platform details, cell count, patients count, samples count, cancer source, celltypes, pubMed ID, treatment information.
4.The information on the degree of association between cell types in the selected dataset and the sensitivity/resistance to the selected drug.
5.The information on the degree of association between clusters in the selected dataset and the sensitivity/resistance to the selected drug.
6.Click on each of the three dropdown menus to change the parameters: select the Cell group of interest, the Color type (CellType, Patient, Sample, Source-type, Tissue), and the Drug sensitivity score (CS value or Binary value). Then, click the button (Refresh) button to update the results.
7.Single-cell clustering maps at different resolutions in the tumor microenvironment.
8.Single-cell clustering maps colored by different types (CellType, Patient, Sample, Source-type, Tissue).
9.Single-cell clustering maps colored by different drug sensitivity score (CS value or Binary value).
10.Boxplot of drug sensitivity score across different clusters.
11.Boxplot of drug sensitivity score across different cell types.
12.Distribution of drug sensitivity score across different cell types.
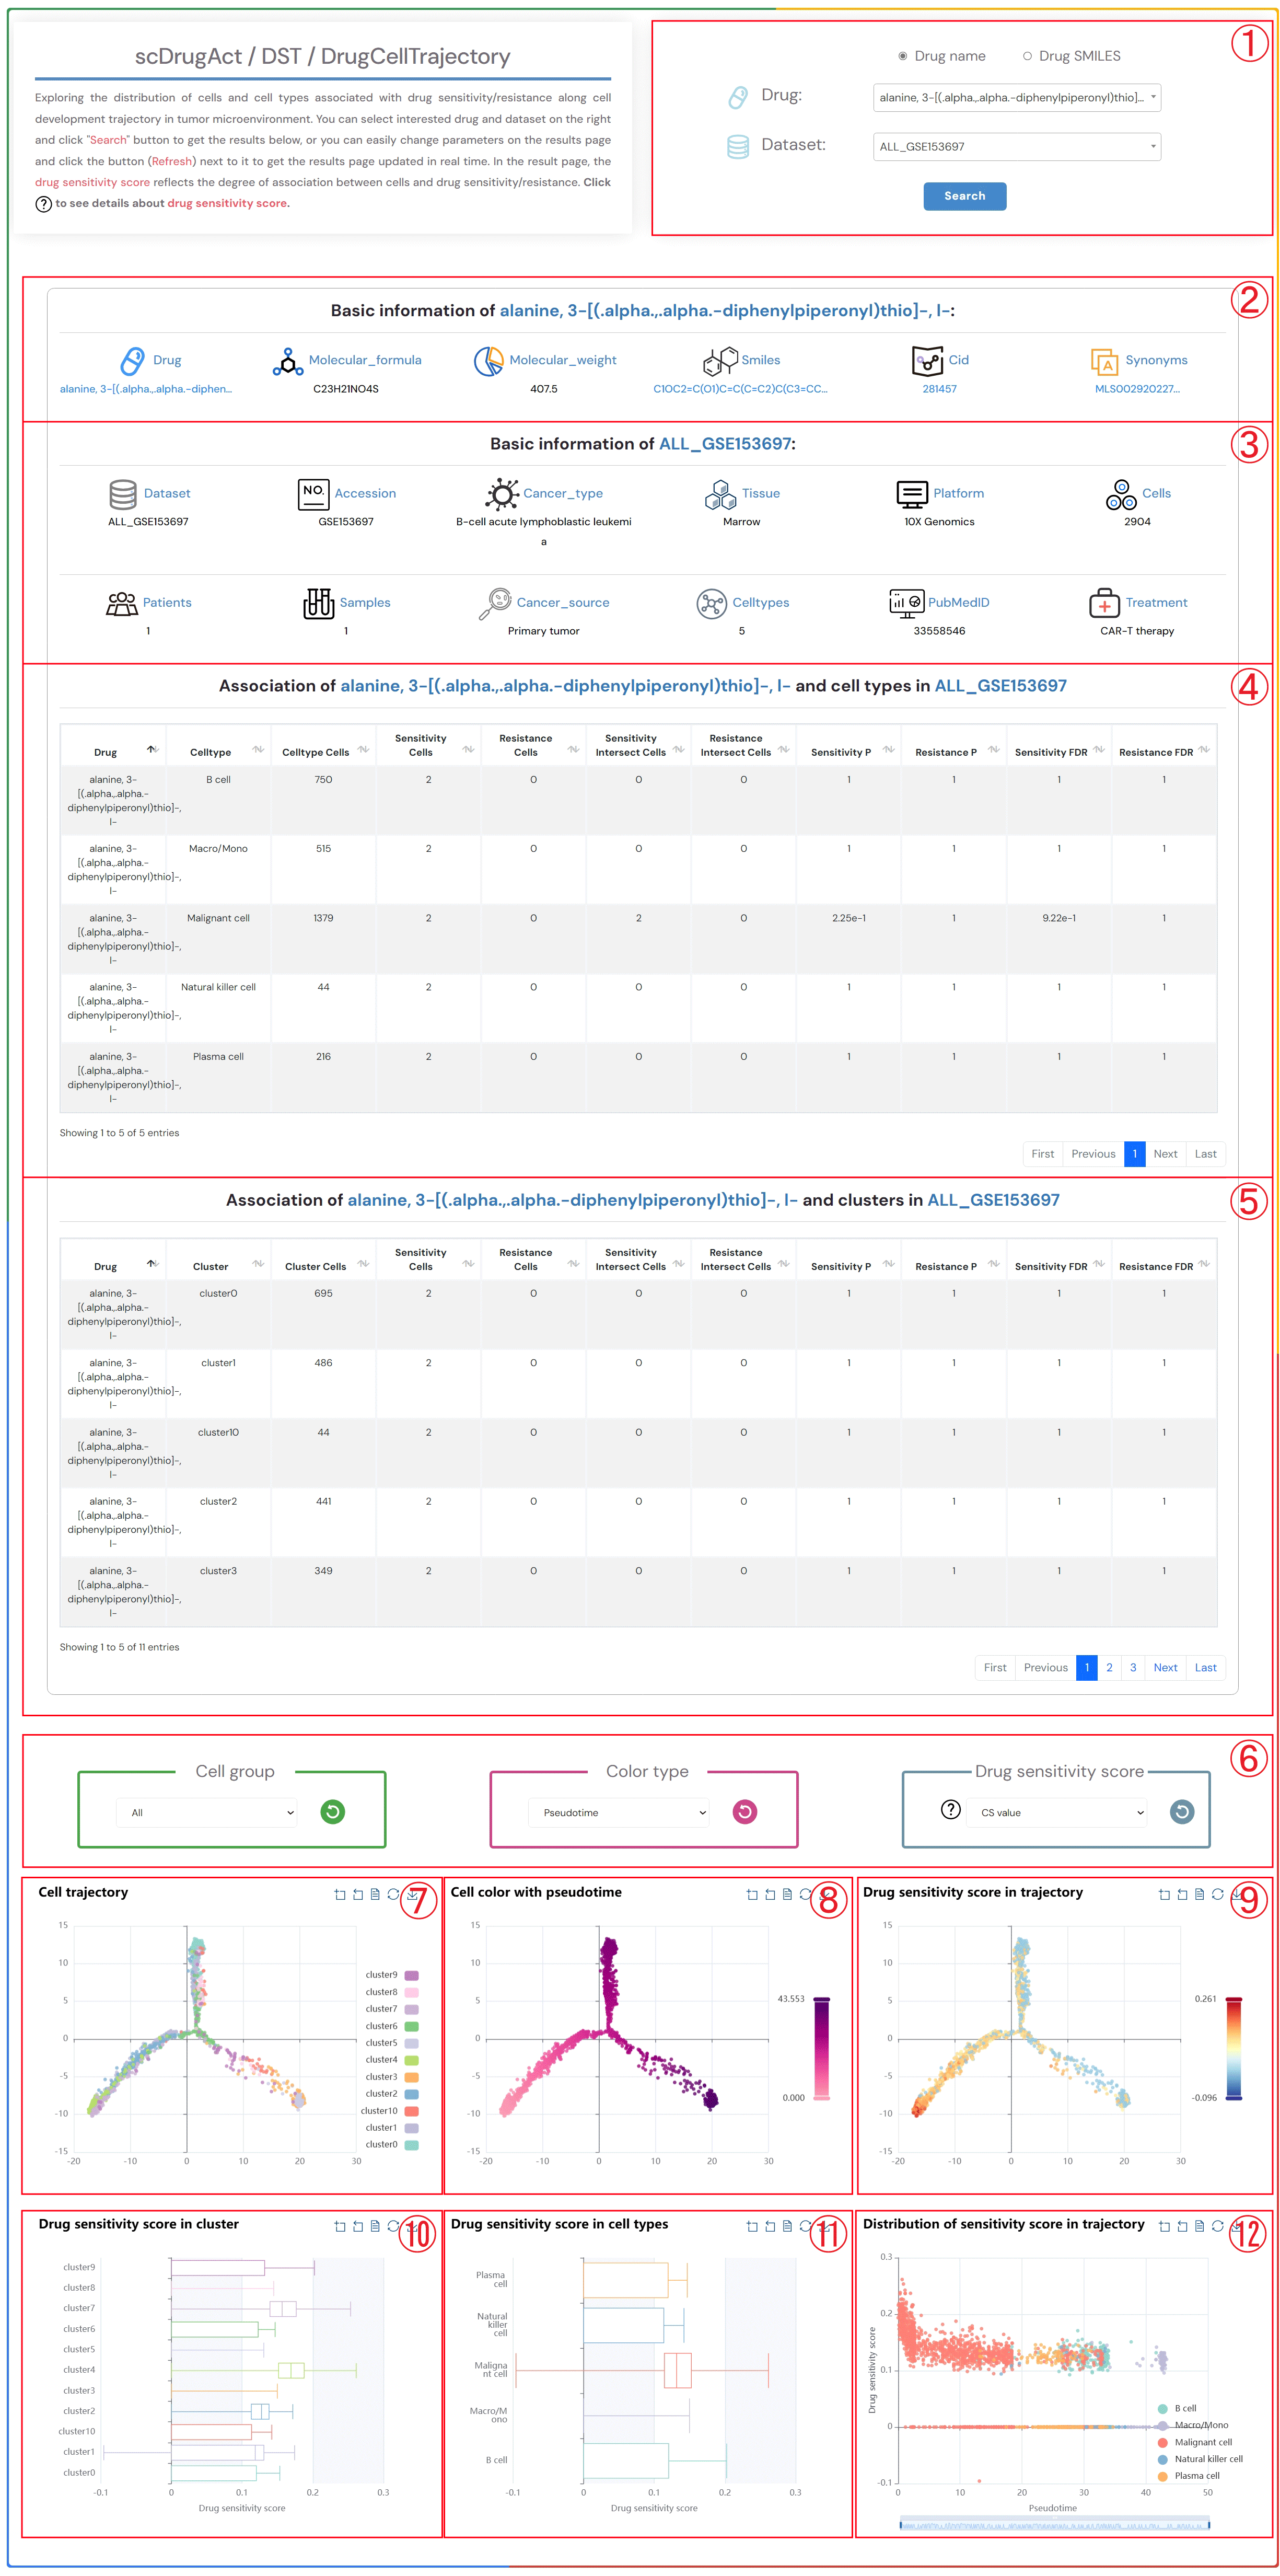
Exploring the distribution of cells and cell types associated with drug sensitivity/resistance along cell development trajectory in tumor microenvironment. You can select interested drug and dataset on the right and click "Search" button to get the results below, or you can easily change parameters on the results page and click the button (Refresh) next to it to get the results page updated in real time. In the result page, the drug sensitivity score reflects the degree of association between cells and drug sensitivity/resistance. Click to see details about drug sensitivity score.
1.Click the “Drug name” or “Drug SMILES” button to select the drug identification method you wish to use. Click on the two dropdown menus to choose the desired drug name and the corresponding dataset, then click the "Submit" button to view the results.
2.Basic information about the selected drug, including drug name, molecular formula, molecular weight, smiles, cid, synonyms.
3.Basic information about the selected dataset, including dataset name, accession number, cancer type, tissue information, platform details, cell count, patients count, samples count, cancer source, celltypes, pubMed ID, treatment information.
4.The information on the degree of association between cell types in the selected dataset and the sensitivity/resistance to the selected drug.
5.The information on the degree of association between clusters in the selected dataset and the sensitivity/resistance to the selected drug.
6.Click on each of the three dropdown menus to change the parameters: select the Cell group of interest, the Color type (Pseudotime, CellType, Patient, Sample, Source-type, Tissue), and the Drug sensitivity score (CS value or Binary value). Then, click the button (Refresh) button to update the results.
7.Single-cell clustering maps at different resolutions in the tumor microenvironment.
8.Single-cell clustering maps colored by different types (Pseudotime, CellType, Patient, Sample, Source-type, Tissue).
9.Single-cell clustering maps colored by different drug sensitivity score (CS value or Binary value).
10.Boxplot of drug sensitivity score across different clusters.
11.Boxplot of drug sensitivity score across different cell types.
12.Distribution of drug sensitivity score across different cell types.
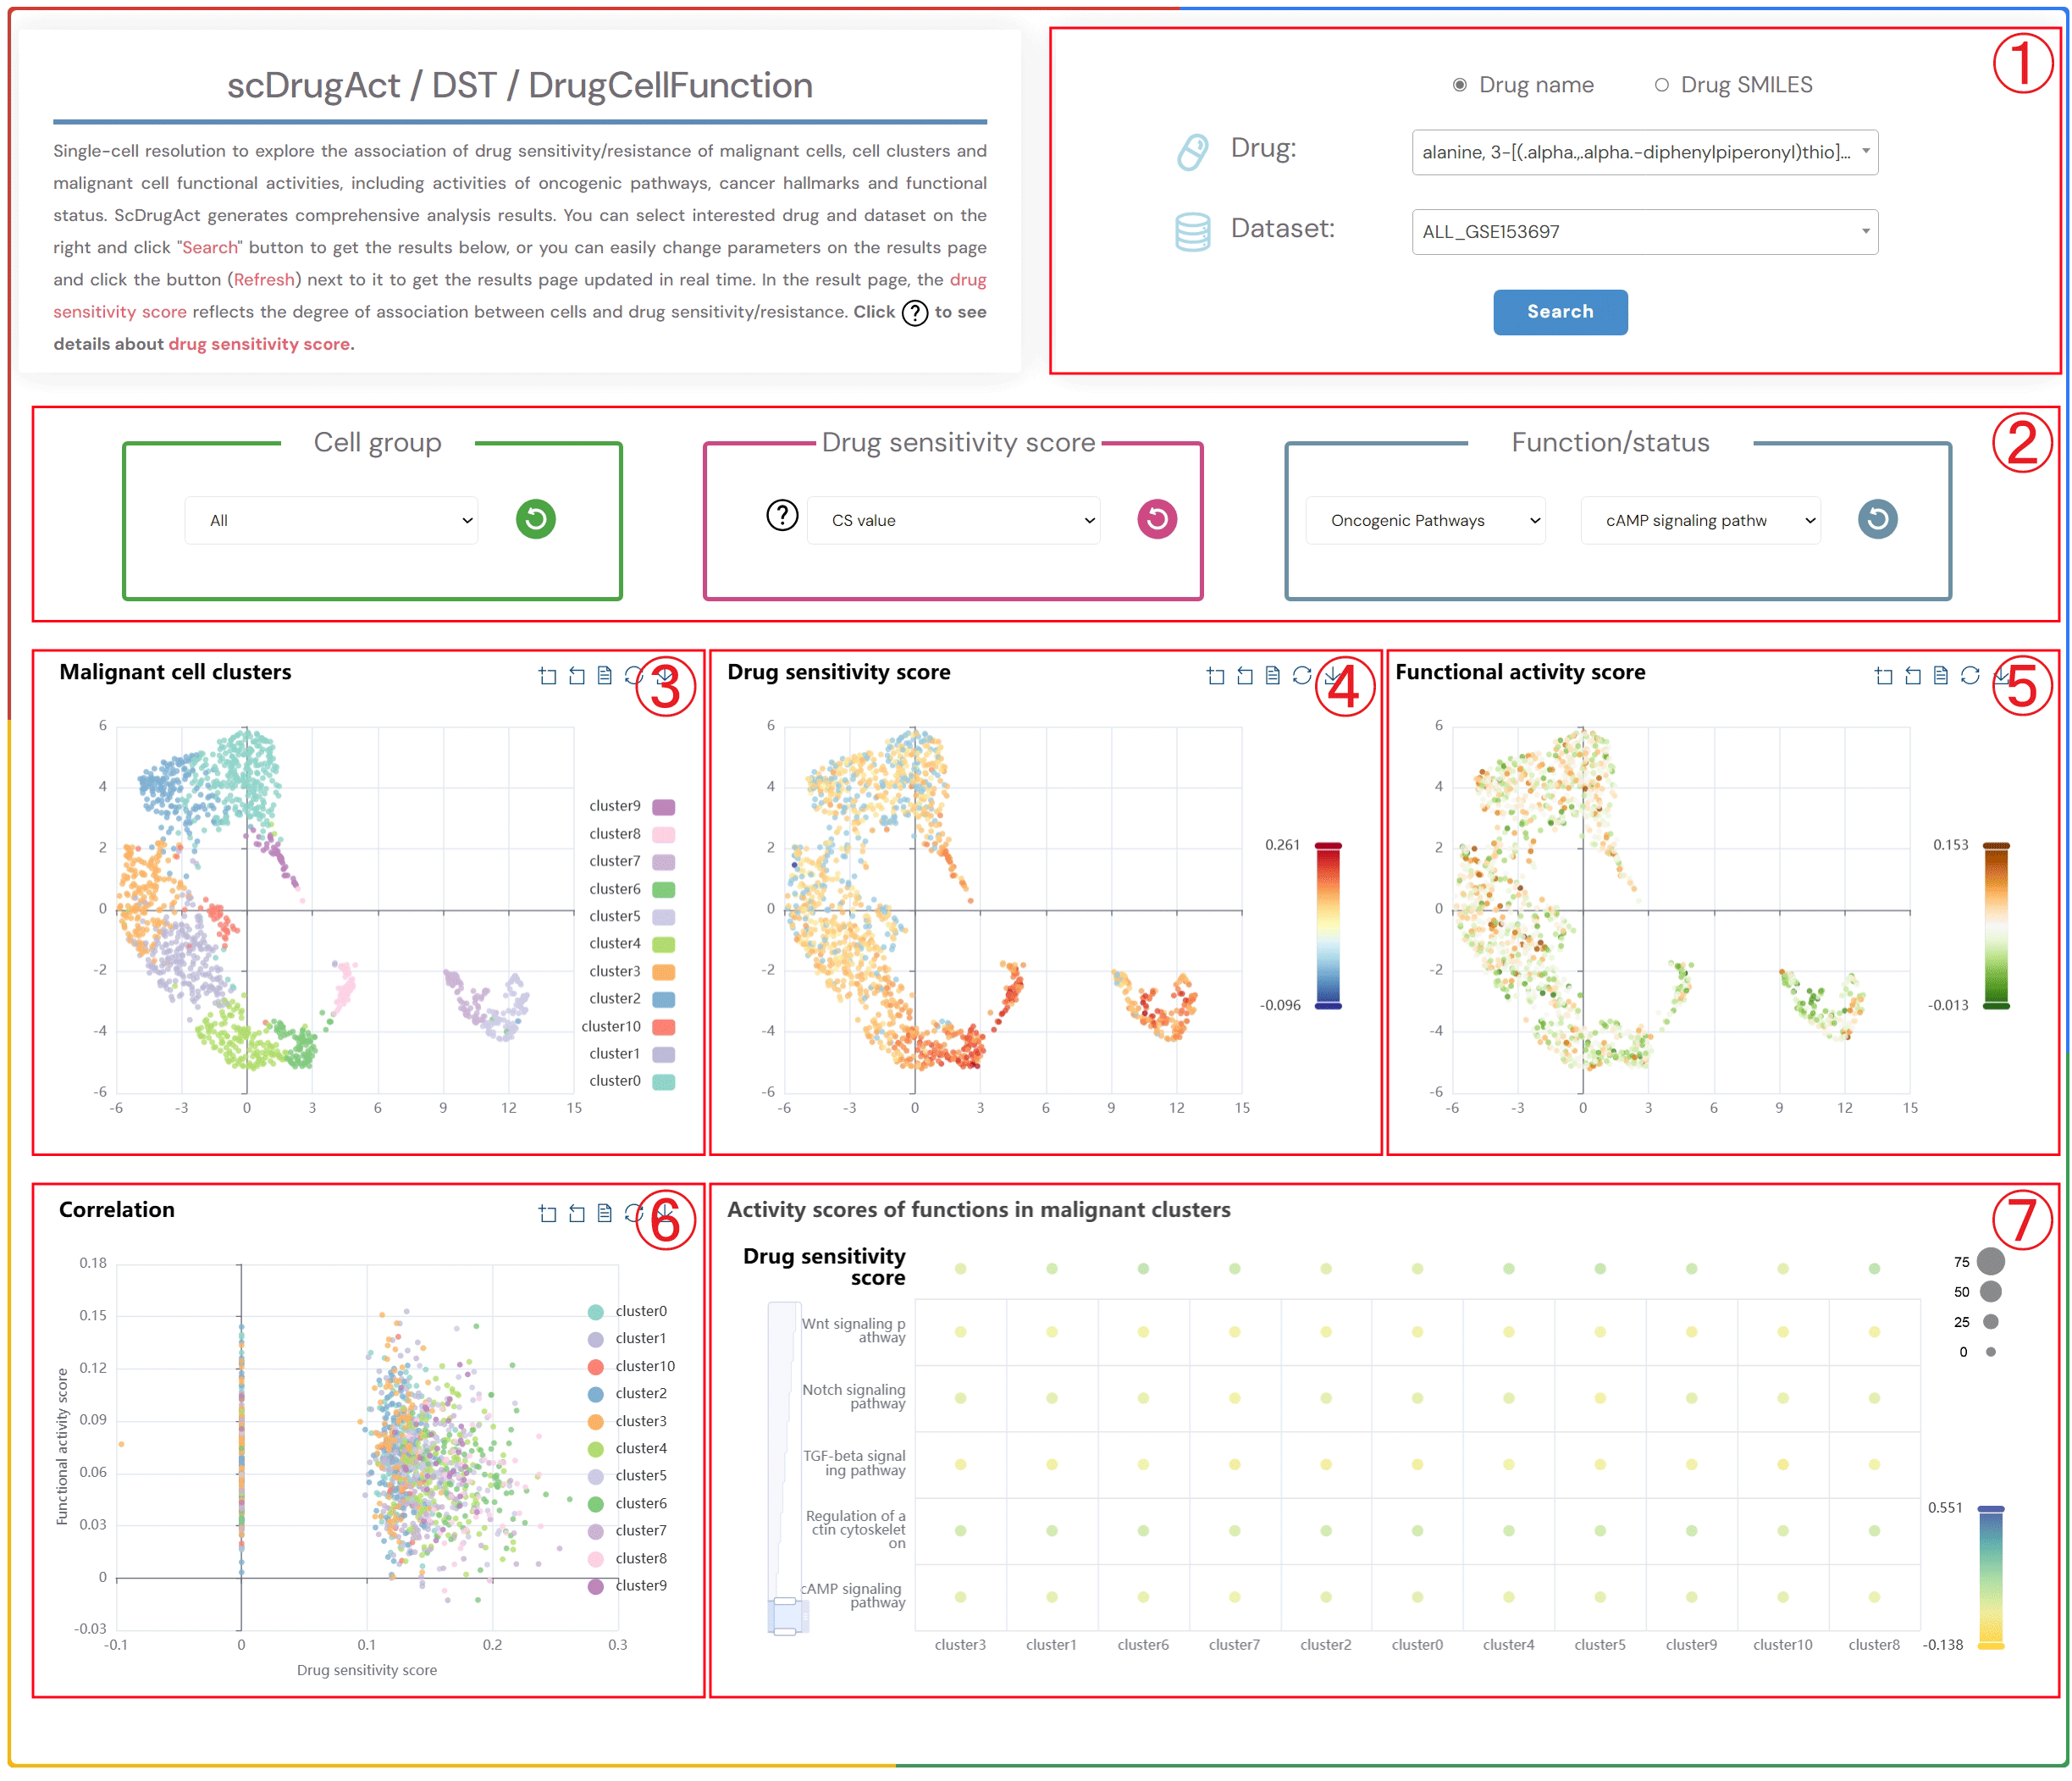
Single-cell resolution to explore the association of drug sensitivity/resistance of malignant cells, cell clusters and malignant cell functional activities, including activities of oncogenic pathways, cancer hallmarks and functional status. ScDrugAct generates comprehensive analysis results. You can select interested drug and dataset on the right and click "Search" button to get the results below, or you can easily change parameters on the results page and click the button (Refresh) next to it to get the results page updated in real time. In the result page, the drug sensitivity score reflects the degree of association between cells and drug sensitivity/resistance. Click to see details about drug sensitivity score.
1.Click the “Drug name” or “Drug SMILES” button to select the drug identification method you wish to use. Click on the two dropdown menus to choose the desired drug name and the corresponding dataset, then click the "Submit" button to view the results.
2.Click the four dropdown menus to select the Cell group, Drug sensitivity score (CS value or Binary value), functional/status activity category, and subcategory of interest, then click the button (Refresh) button to update the results.
3.Single-cell clustering maps of malignant cells in different clusters.
4.Single-cell clustering maps of malignant cells colored by drug sensitivity score.
5.Single-cell clustering maps of malignant cells colored by functional activity scores.
6.Scatter plot showing the correlation between drug sensitivity score and functional activity scores in malignant cells.
7.Bubble plot of average functional activity in malignant cell clusters (bubble size: proportion of cells in the cluster to the total number of cells; bubble color: average functional activity score).
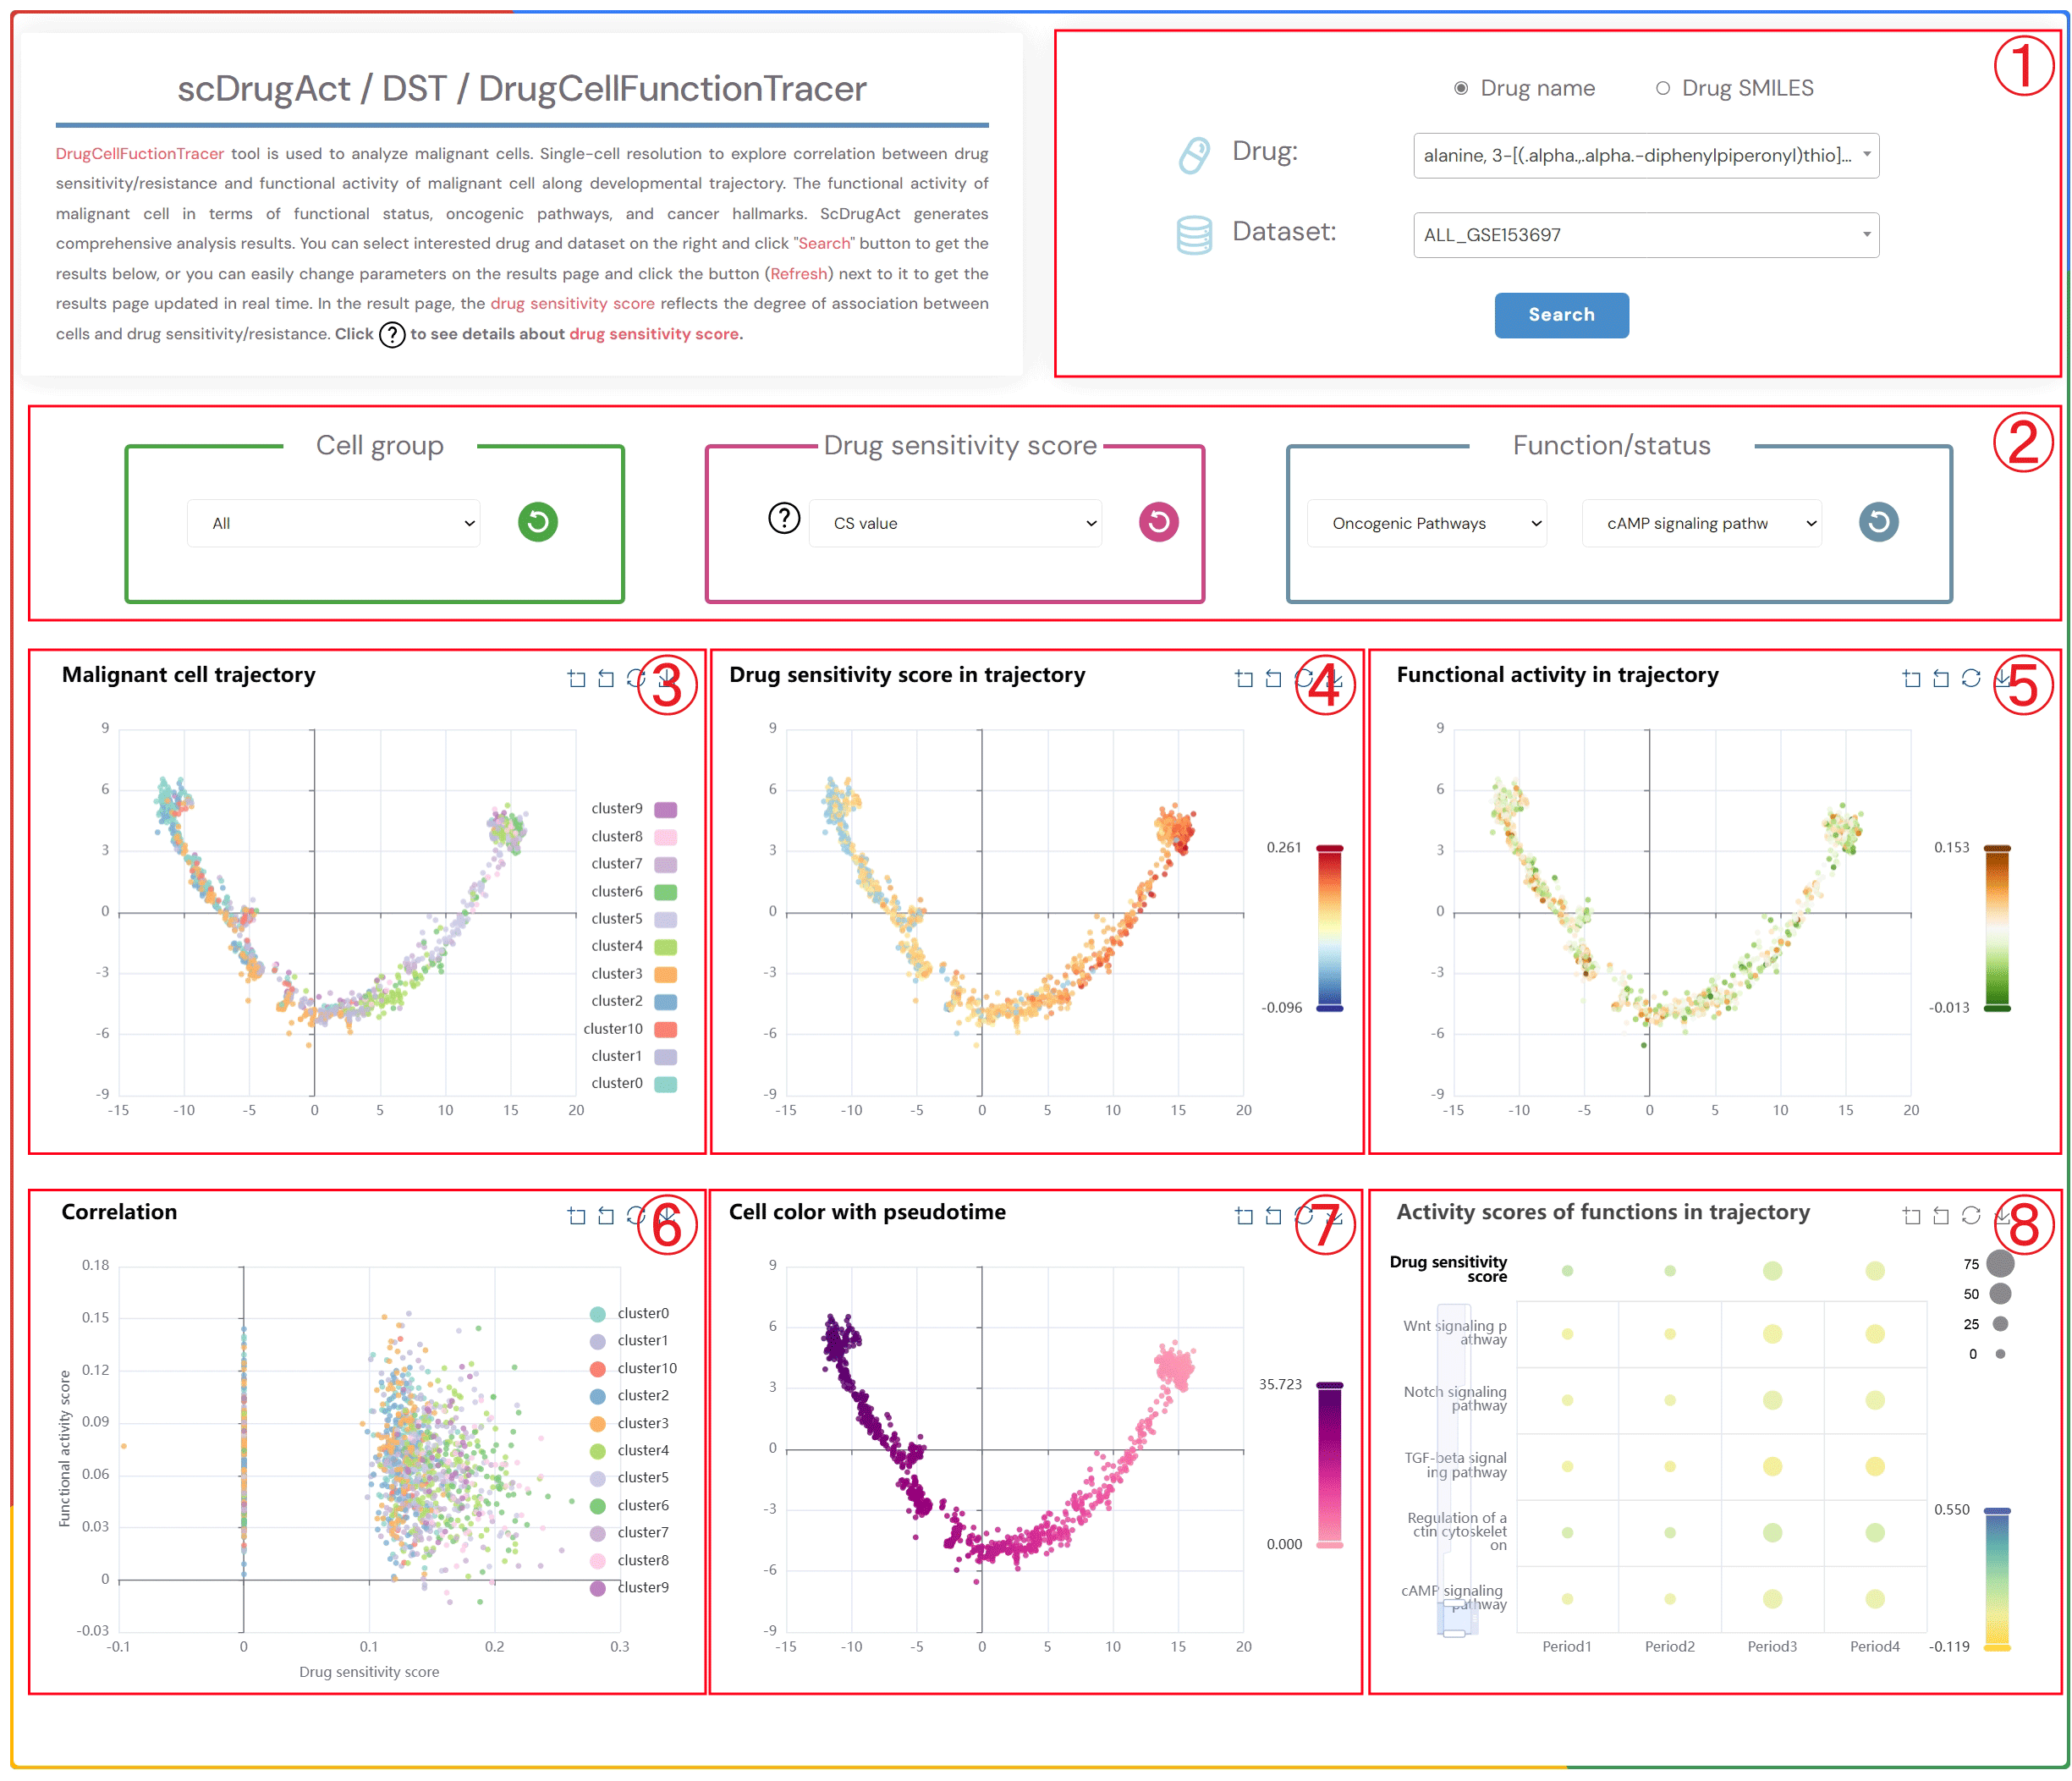
DrugCellFunctionTracer tool is used to analyze malignant cells. Single-cell resolution to explore correlation between drug sensitivity/resistance and functional activity of malignant cell along developmental trajectory. The functional activity of malignant cell in terms of functional status, oncogenic pathways, and cancer hallmarks. ScDrugAct generates comprehensive analysis results. You can select interested drug and dataset on the right and click "Search" button to get the results below, or you can easily change parameters on the results page and click the button (Refresh) next to it to get the results page updated in real time. In the result page, the drug sensitivity score reflects the degree of association between cells and drug sensitivity/resistance. Click to see details about drug sensitivity score.
1.Click the “Drug name” or “Drug SMILES” button to select the drug identification method you wish to use. Click on the two dropdown menus to choose the desired drug name and the corresponding dataset, then click the "Submit" button to view the results.
2.Click on each of the four dropdown menus to select the Cell group of interest, Drug sensitivity score (CS value or Binary value), Functional/state activity category, and subcategory. Then, click the button (Refresh) to update the results.
3.Cell trajectory plot of malignant cells.
4.Cell trajectory plot of malignant cells colored by different drug sensitivity scores (CS value, Binary value).
5.Cell trajectory plot of malignant cells colored by functional activity scores.
6.Scatter plot showing the correlation between drug sensitivity score and functional activity score in malignant cells.
7.Cell trajectory plot of malignant cells colored by pseudotime.
8.Bubble plot showing the average functional activity scores at four different time stages (bubble size: proportion of cell clusters; bubble color: average functional activity score).
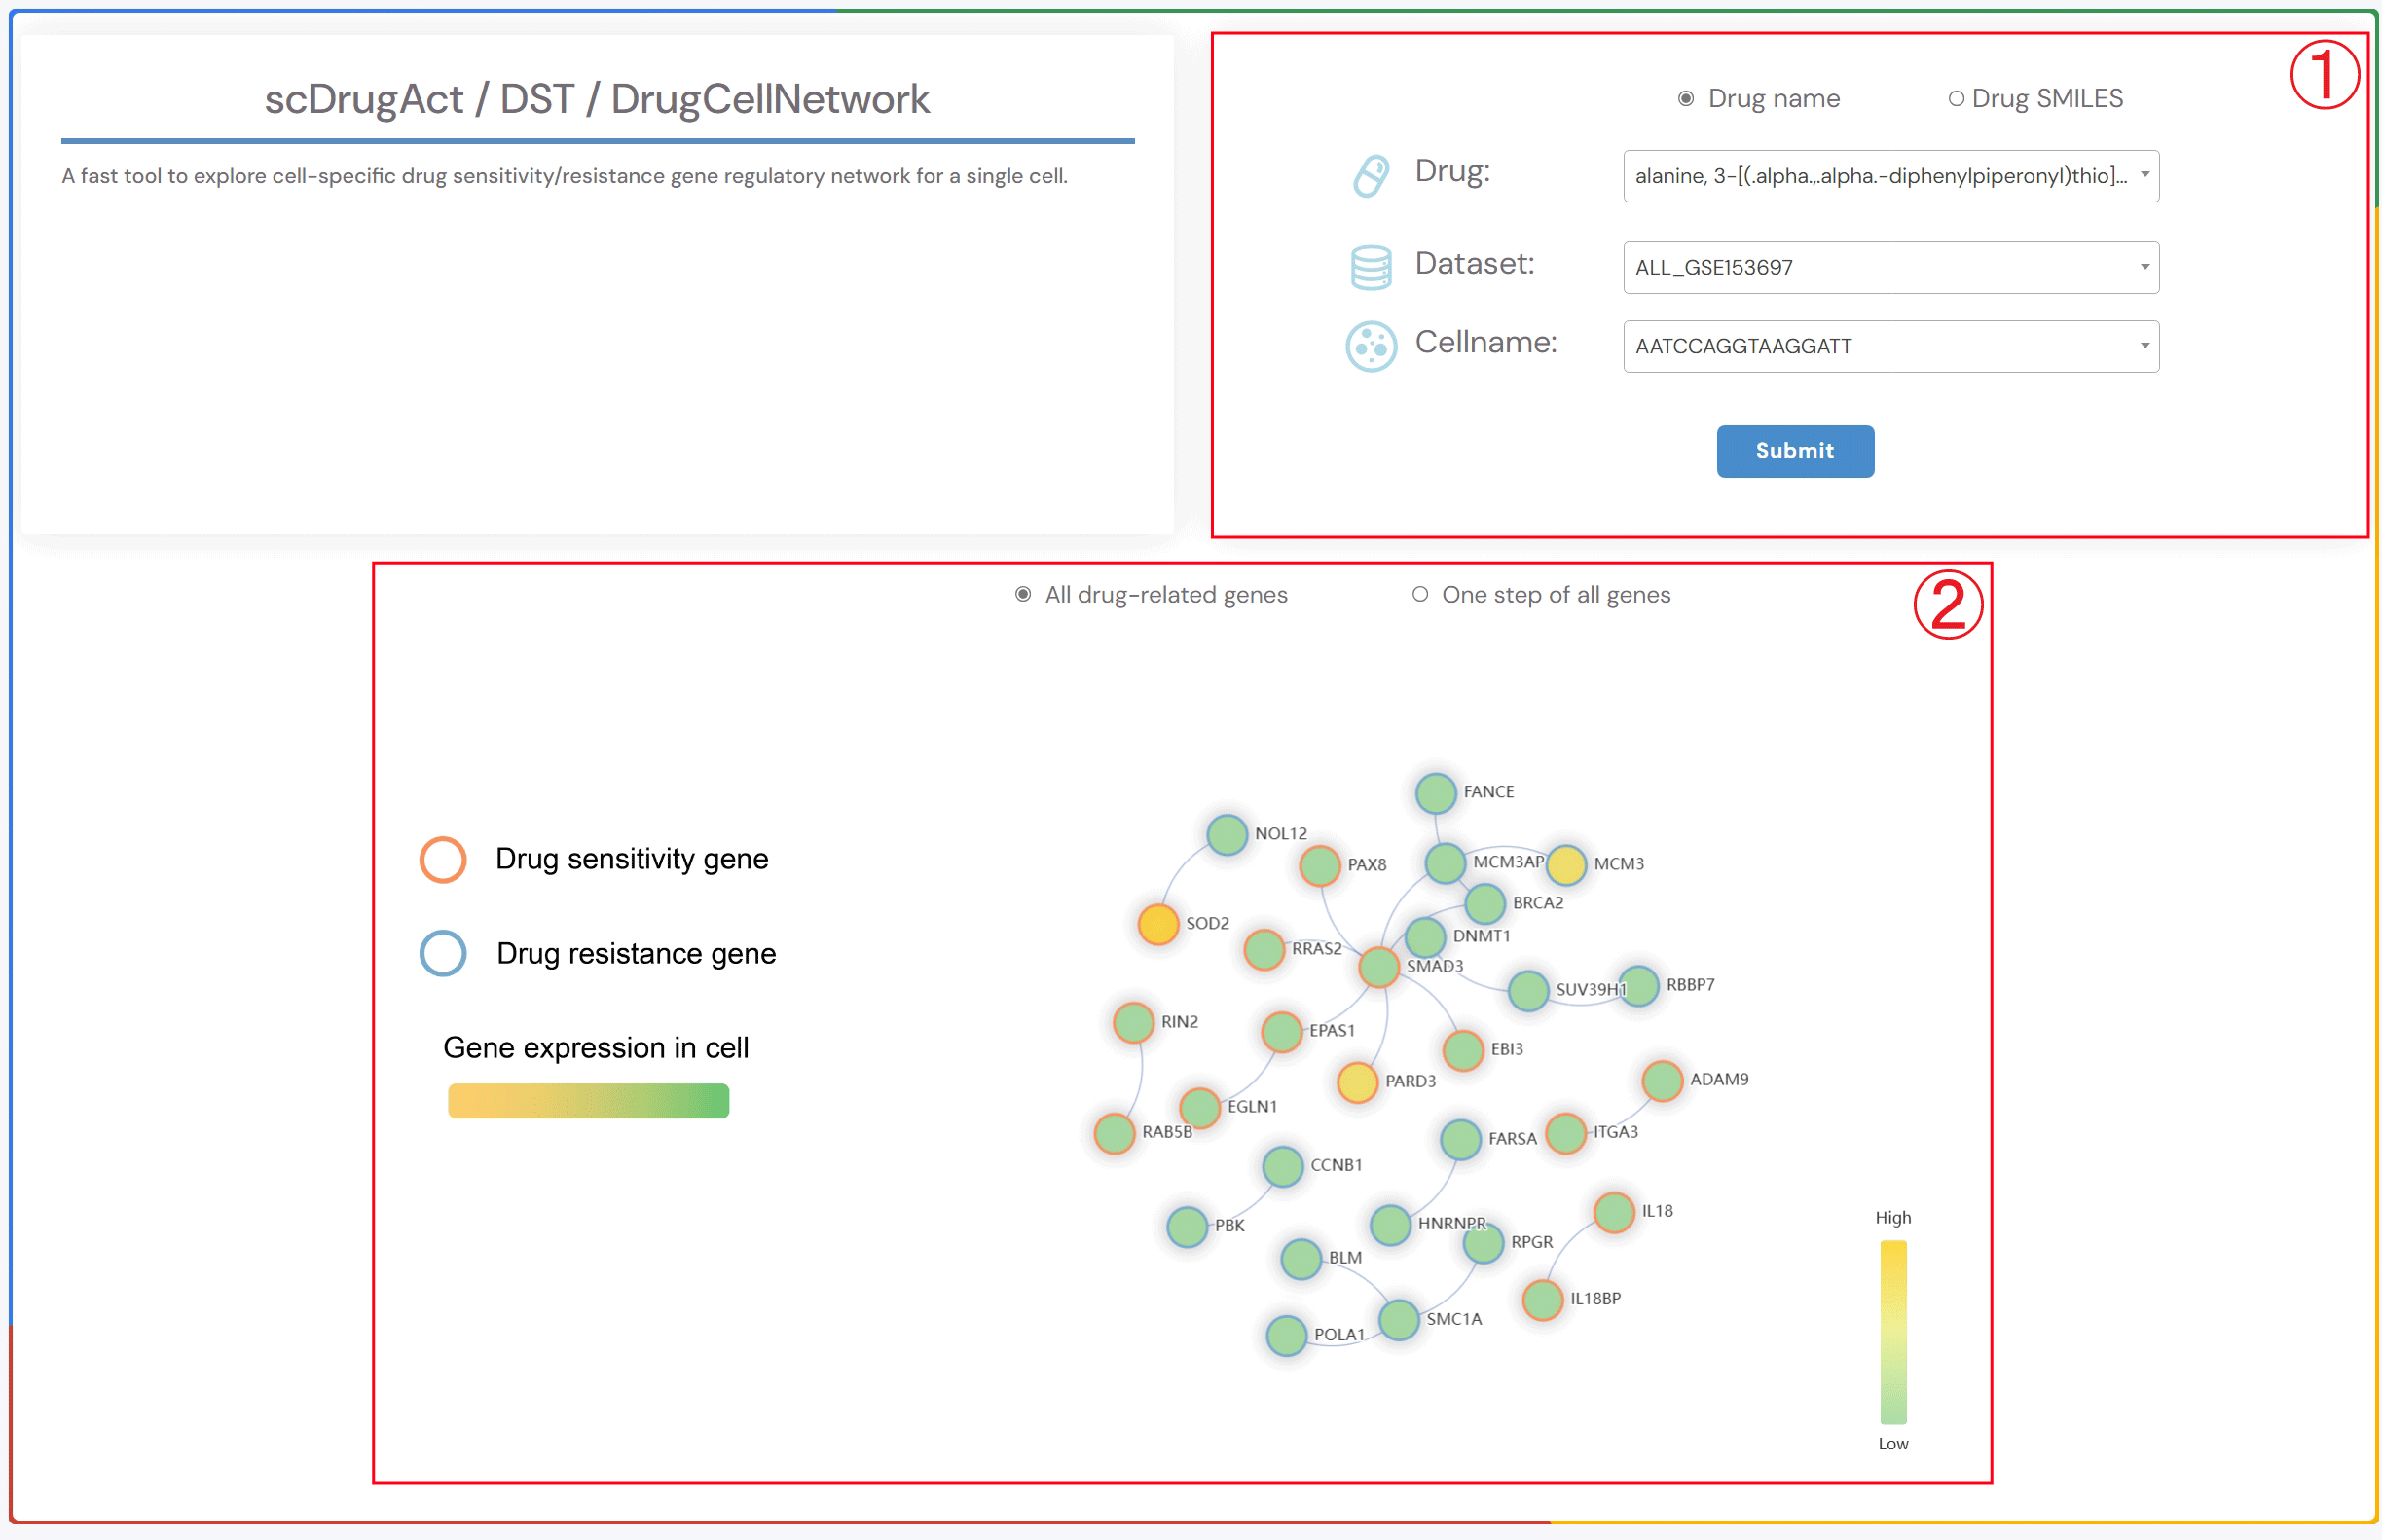
A fast tool to explore cell-specific drug sensitivity/resistance gene regulatory network for a single cell.
1.Click the “Drug name” or “Drug SMILES” button to choose your preferred drug identification method. Then, click on the three dropdown menus to select the drug name of interest, the corresponding dataset, and the cell name. Finally, click the “Submit” button to view the results.
2.Click the “All drug-related genes” button to display the gene regulatory network of all drug-related genes specific to the cell. Click the “One step of all genes” button to display the gene regulatory network of one-step neighbor genes of all drug-related genes specific to the cell. Circle fill color: gene expression level. Circle red border: Drug sensitivity gene. Circle blue border: Drug resistance gene.
A fast tool to explore similarity of SMILES structure of drugs and similarity (Jaccard coefficient) of cell-types associated with sensitivity/resistance of drugs.
1.In the “search” box, you can select the drug name or double-click the drug name of interest in the “Available options” dropdown menu to add it to the “Selected options” dropdown menu on the right. Click the “Submit” button to view the results. “add” adds the drug to the right dropdown menu. “remove” removes the drug from the right dropdown menu. “remove all” deletes all drugs from the right dropdown menu.
2.Heatmap of the similarity of SMILES structure of drugs and the similarity (Jaccard coefficient) of response cell-types of drugs.
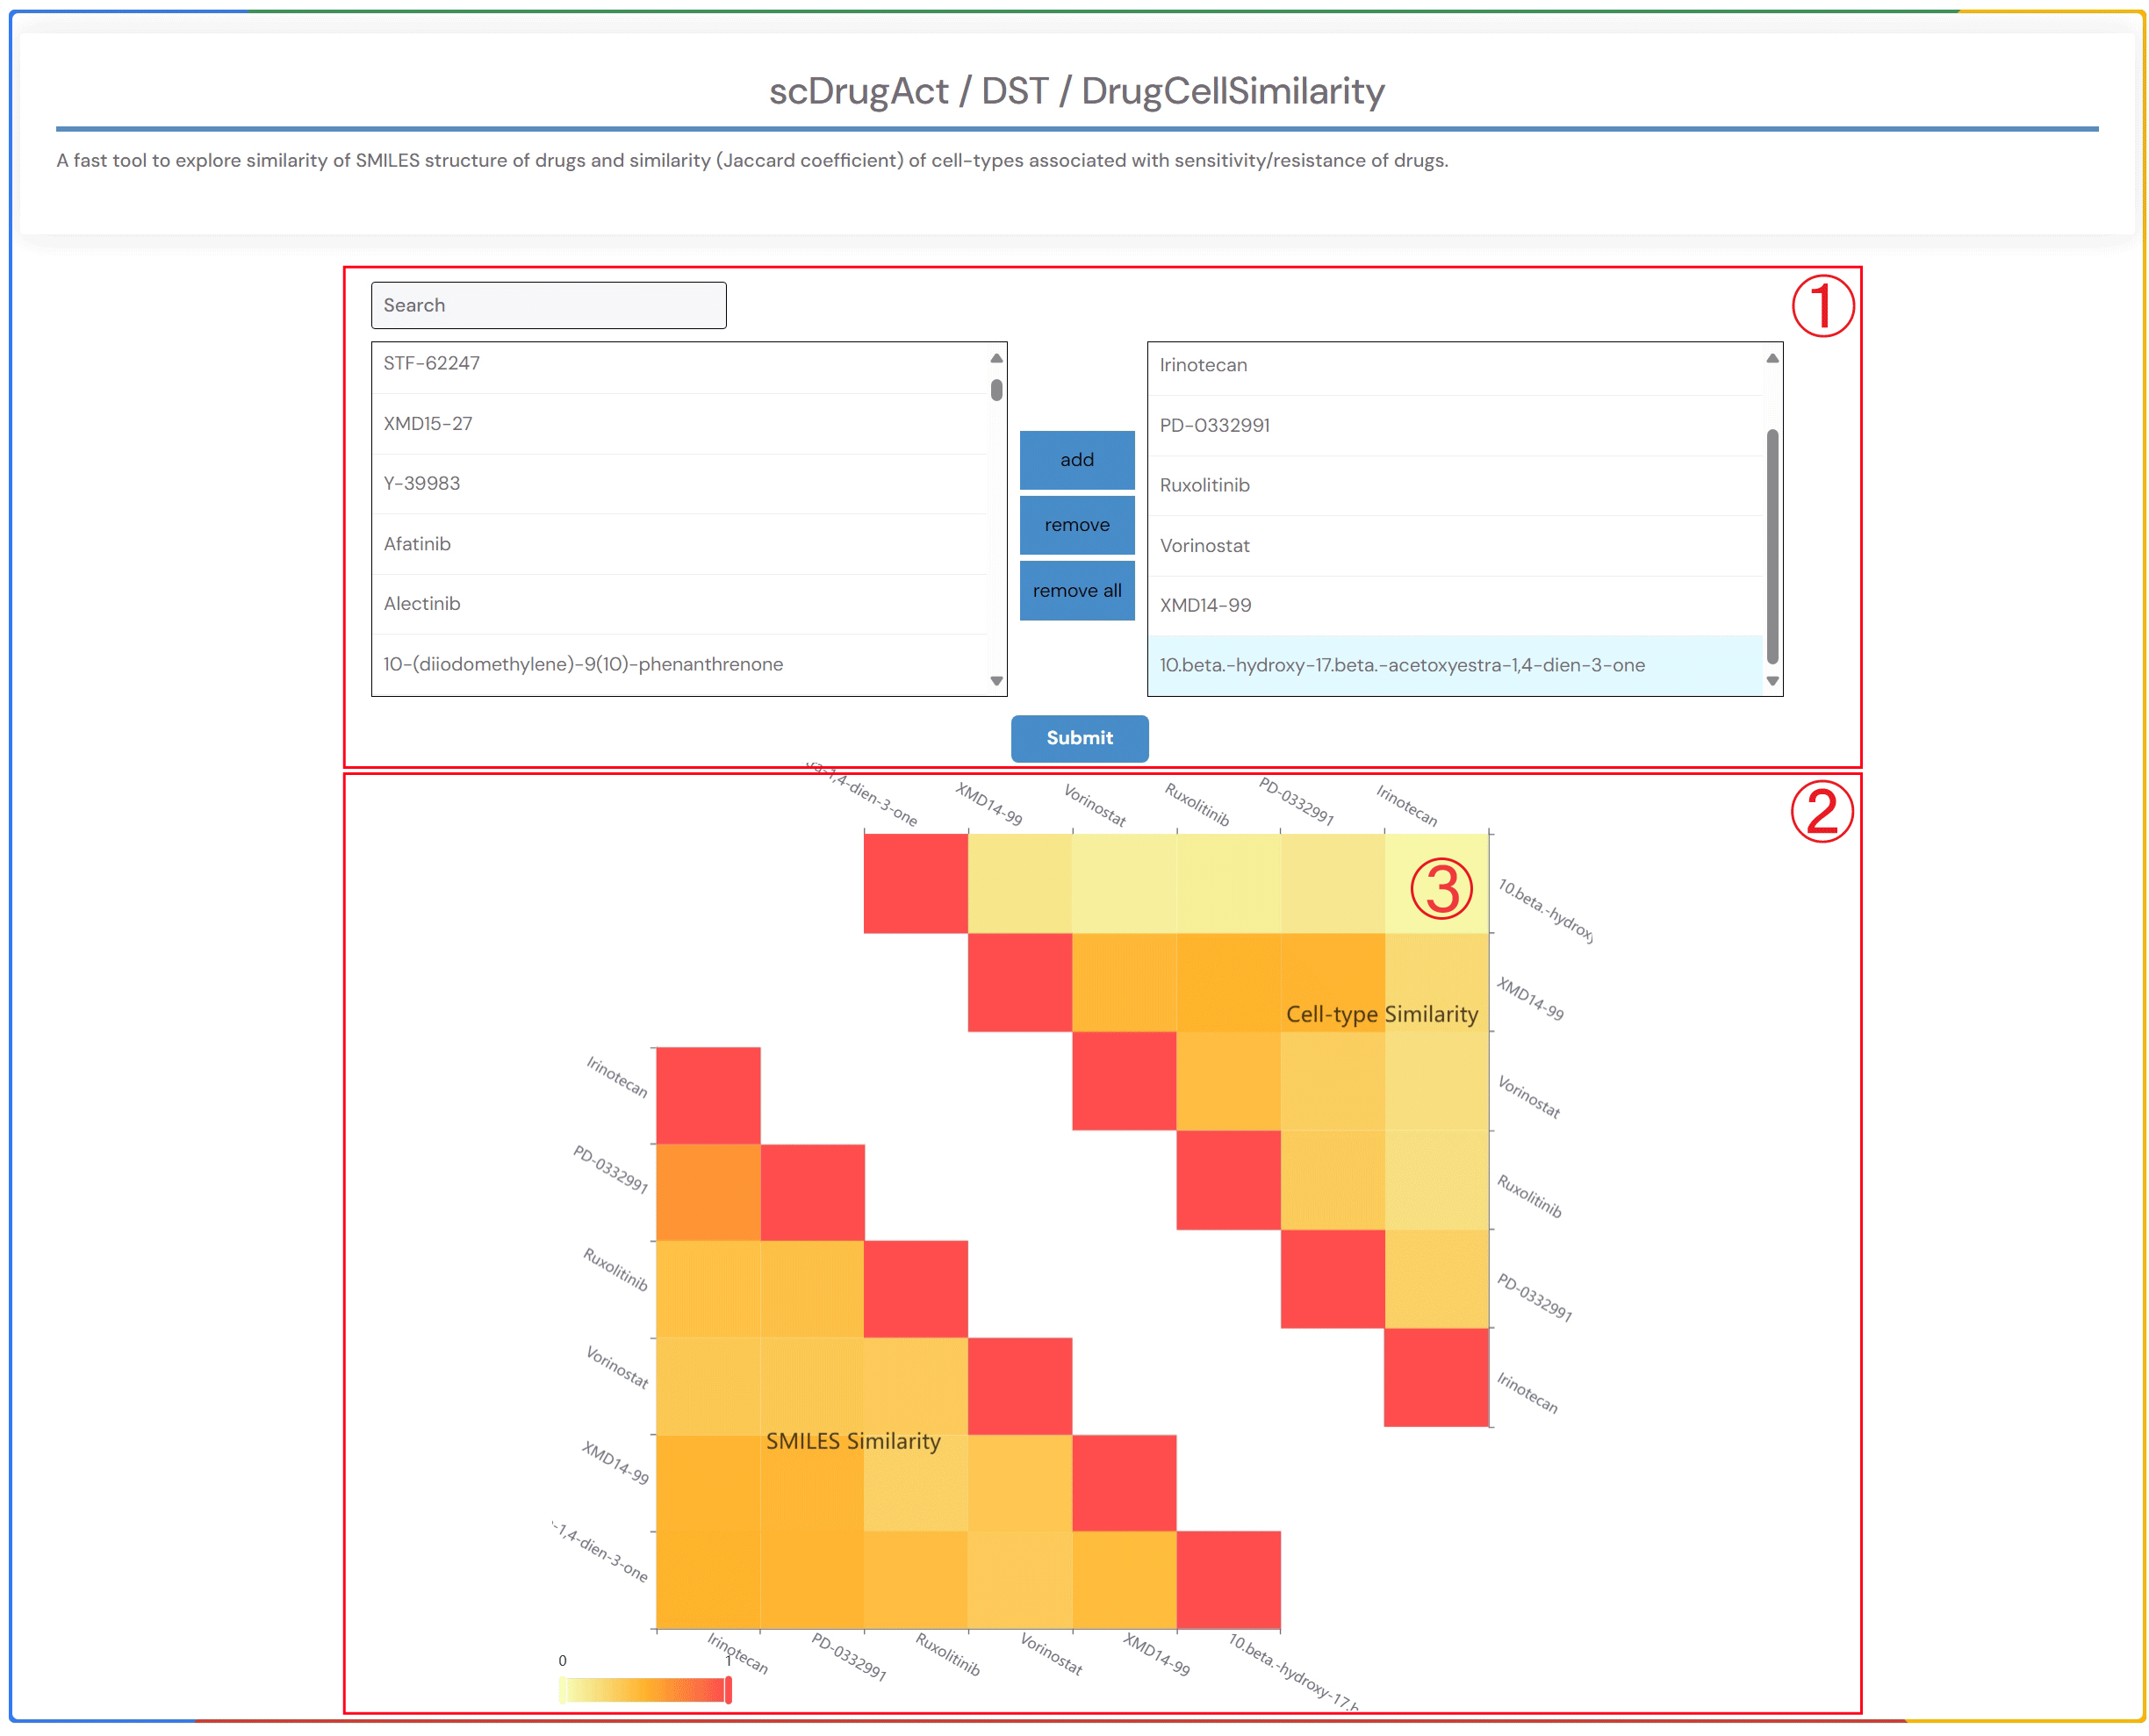
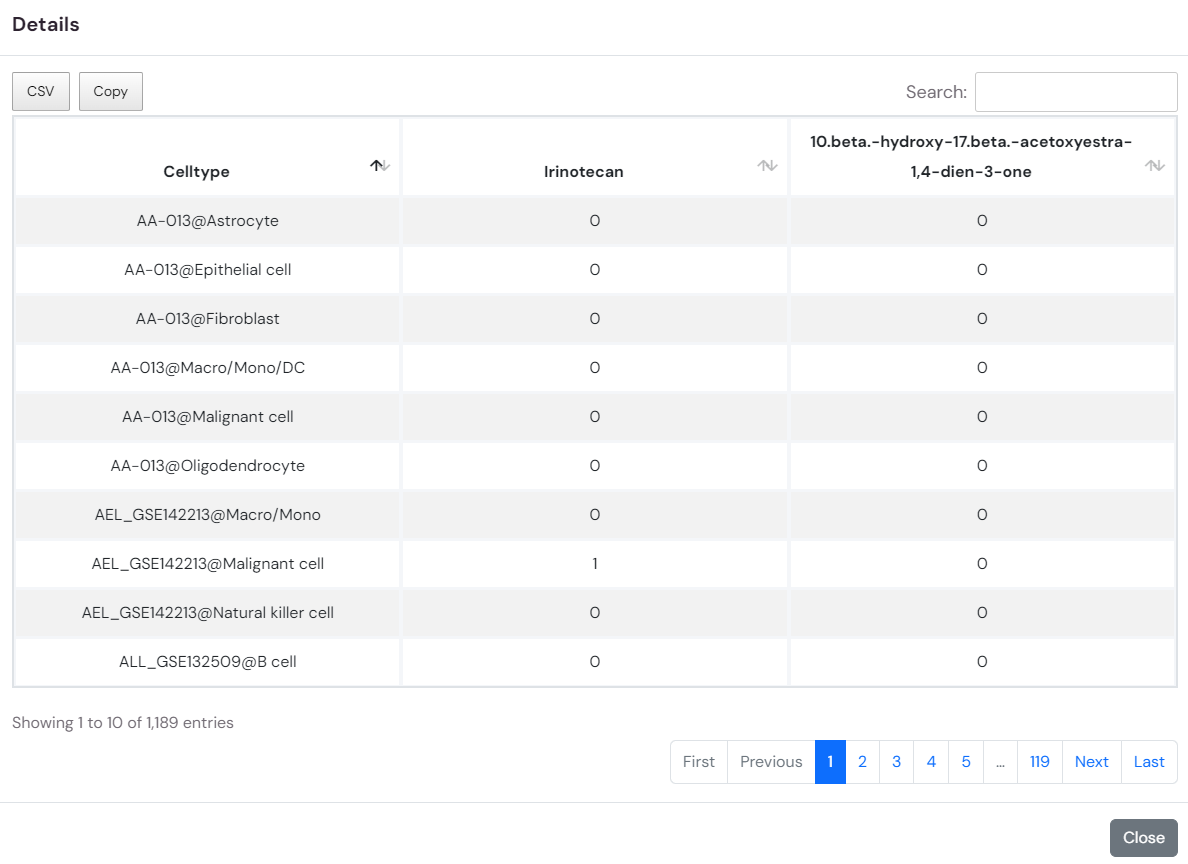
3.By clicking on the heatmap element showing the similarity (Jaccard coefficient) of drug response cell types, you can access detailed information on the effects of the related drug across various cell types in different datasets within the database.
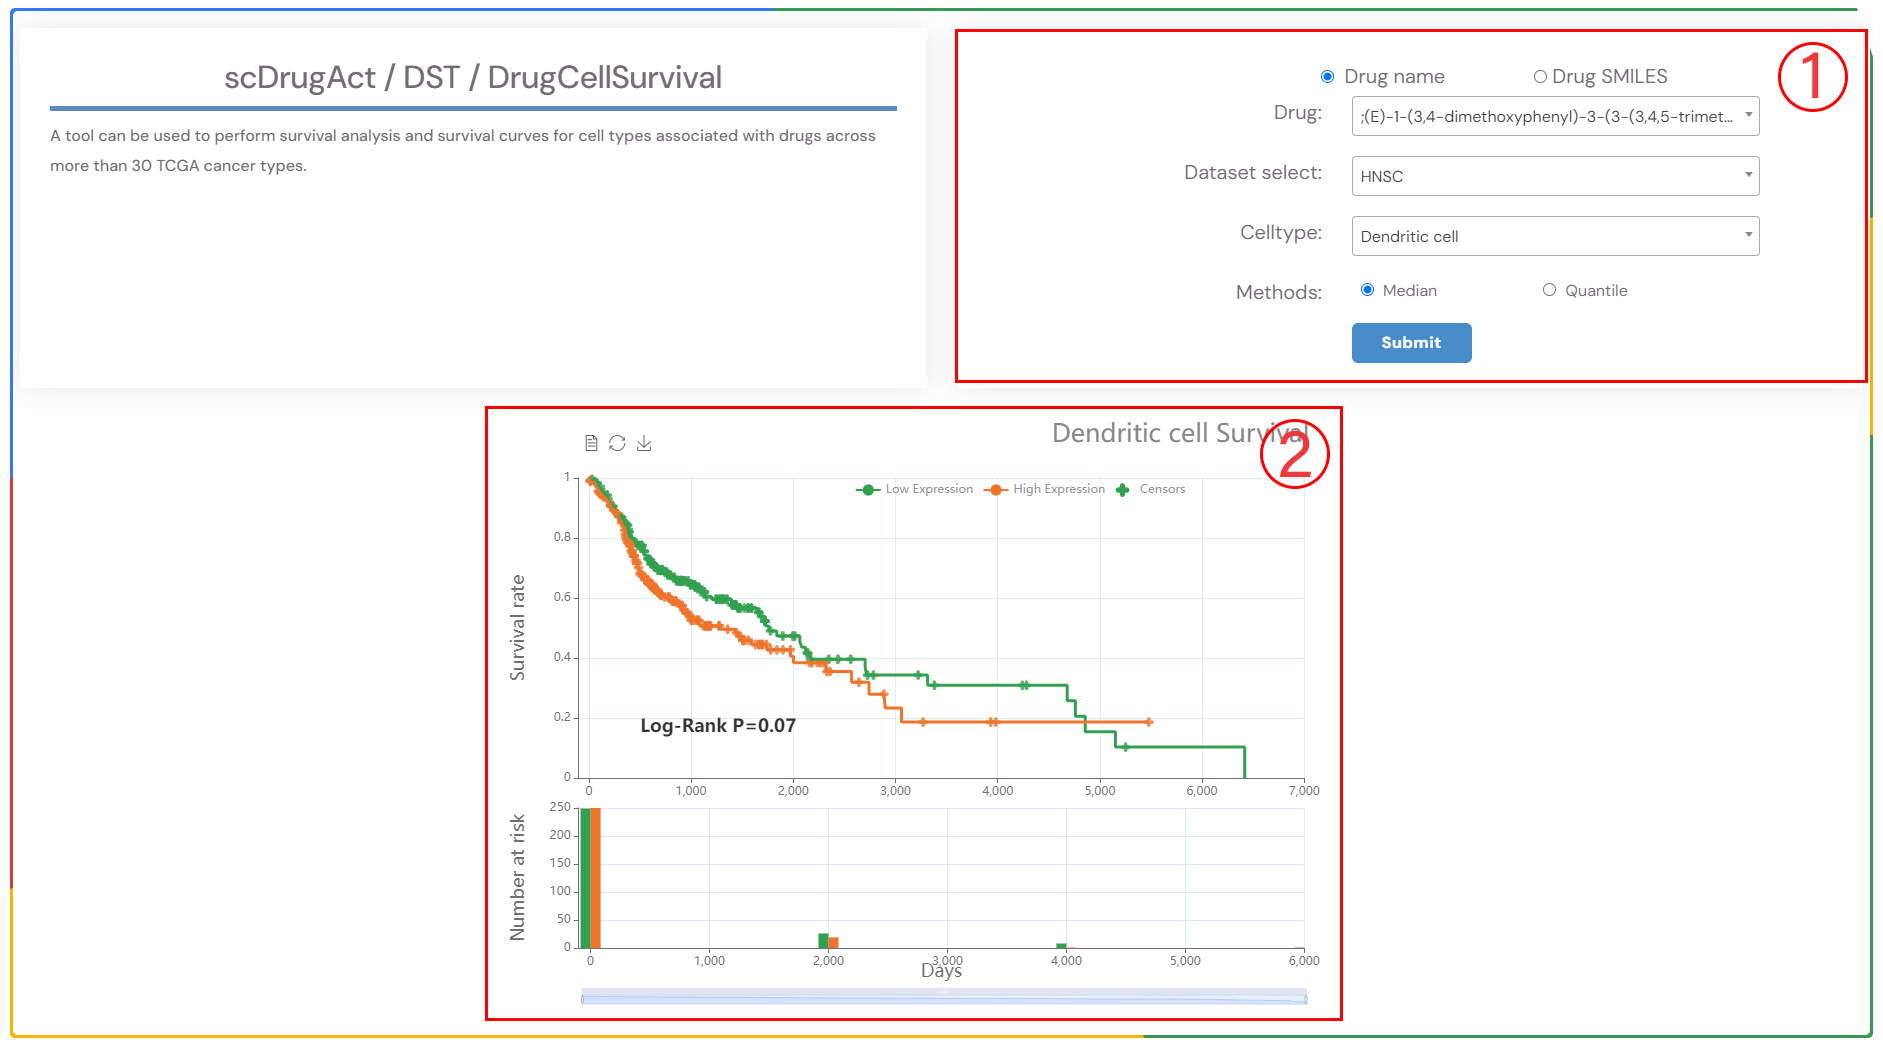
A tool can be used to perform survival analysis and survival curves for cell types associated with drugs across more than 30 TCGA cancer types.
1.Select a drug, the cancer type, and the corresponding cell type of interest from the three dropdown menus. Choose the survival analysis method (‘Median’ or ‘Quartiles’), and then click the ‘Submit’ button to view the results. ‘Median’ refers to the time at which 50% of individuals are still alive, while ‘Quartiles’ includes other percentiles in addition to the median survival time..
2.Survival analysis result plot.
A tool can be used to perform survival analysis and survival curves for cell types associated with drugs across more than 30 TCGA cancer types.
1.Click on the dropdown menus to choose the desired drug name, then click the "Submit" button to view the results.
2.The gene regulatory network of all drug-related genes.
3.Detailed information on the gene set of all drug-related genes..
A tool can be used to perform survival analysis and survival curves for cell types associated with drugs across more than 30 TCGA cancer types.
1.Click the “Drug name” or “Drug SMILES” button to select the drug identification method you wish to use. Click on the dropdown menus to choose the desired drug name, then click the "Submit" button to view the results.
2.Bar chart showing the count of cell lines regulated by drug-related up/down-regulated genes.
3. Tree plots of drug-related up/down gene functional enrichment, with clickable gene
nodes to display related functions.Bar Plot of the Top 10 GO Terms from
Gene Ontology Enrichment Analysis.
ScDrugAct-Search For Single-Cell Drug Perturbation (Figure 2-1)
1.Select the drug name or SMILES for your search.
2.Search perturbation promotion/inhibition associations between drug/small molecule and cell types by using drug/small molecule, cell type or cancer type.
3.Set the number of dataset that supporting associations between drugs and cell types.
4.Example: click for example information; SEARCH: click to get search result; Reset: click to reset information that have been input.
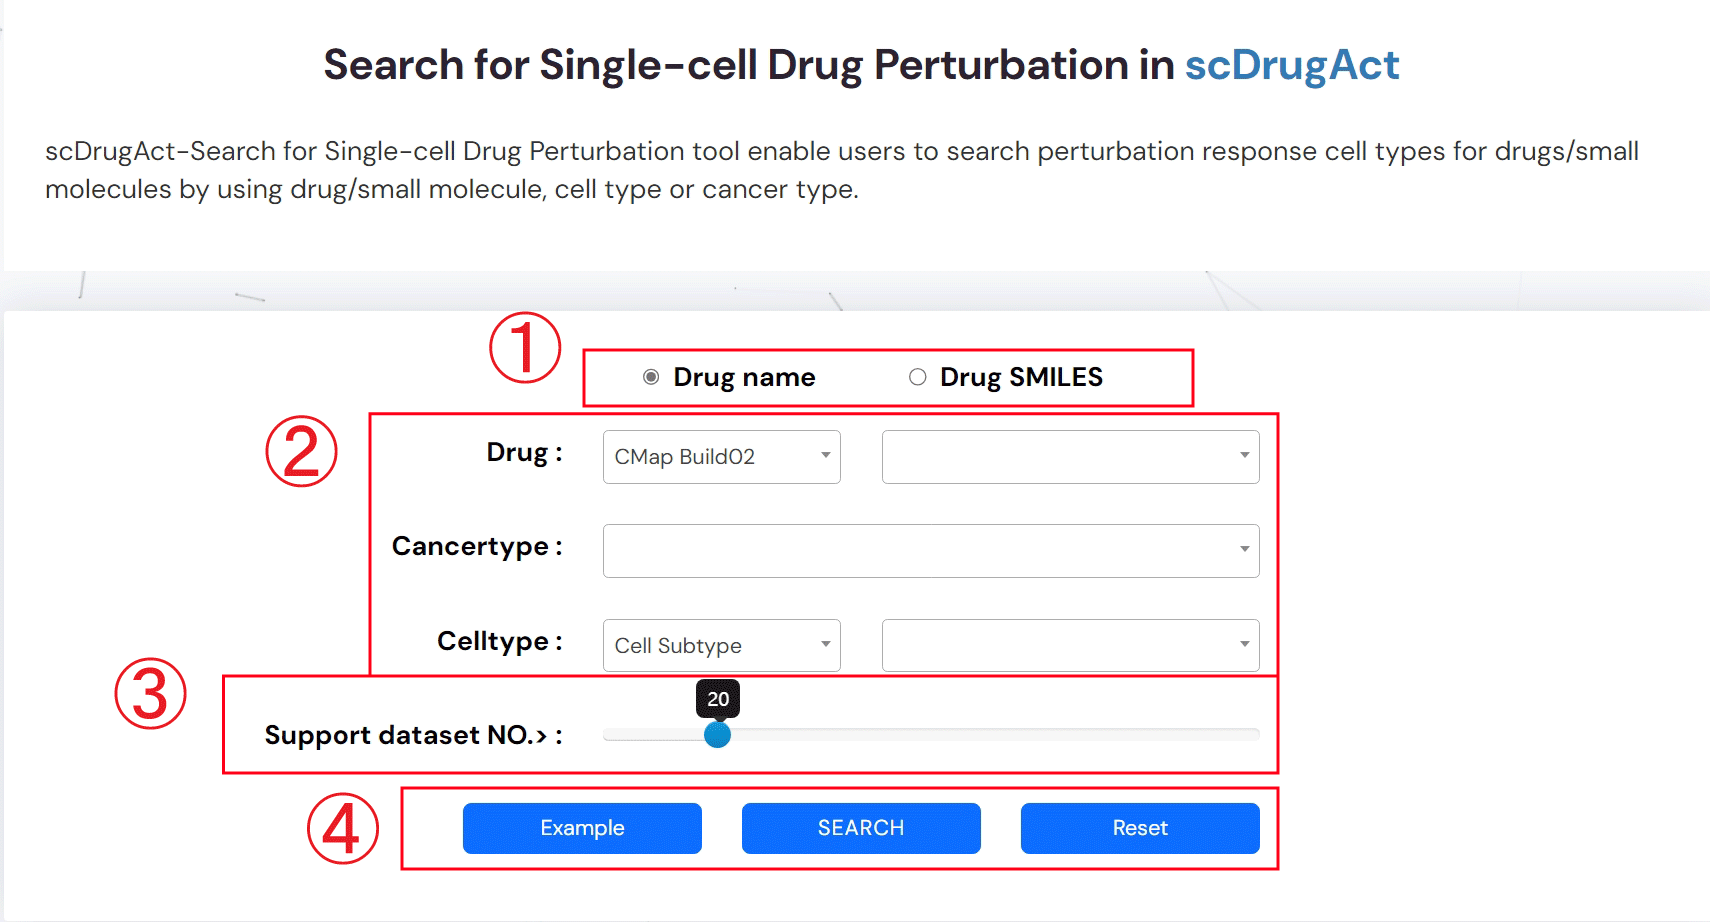
Figure 2-1. scDrugAct-Search for Single-cell Drug Sensitivity tool
The search result for Single-Cell Drug Perturbation (Figure 2-2)
1.Click to obtain the search result
2.Input keyword to search in the result table
3.The search result table
No. of cells: the number of cells in the corresponding cell type
No. of Prom.cells: the number of drug-promotion cells
No. of Inhib.cells: the number of drug-inhibition cells
Connection type: the type associations between drug and cell type, including promotion and inhibition
No.Support DataSet.Prom: the number of datasets that supporting promotion associations between drug and cell type
No.Support DataSet.Inhib: the number of datasets that supporting inhibition associations between drug and cell type
Tools: interfaces for further analysis
Details: click to see detailed descriptions about drug, dataset and the association between drug and cell type (Figure 2-3).
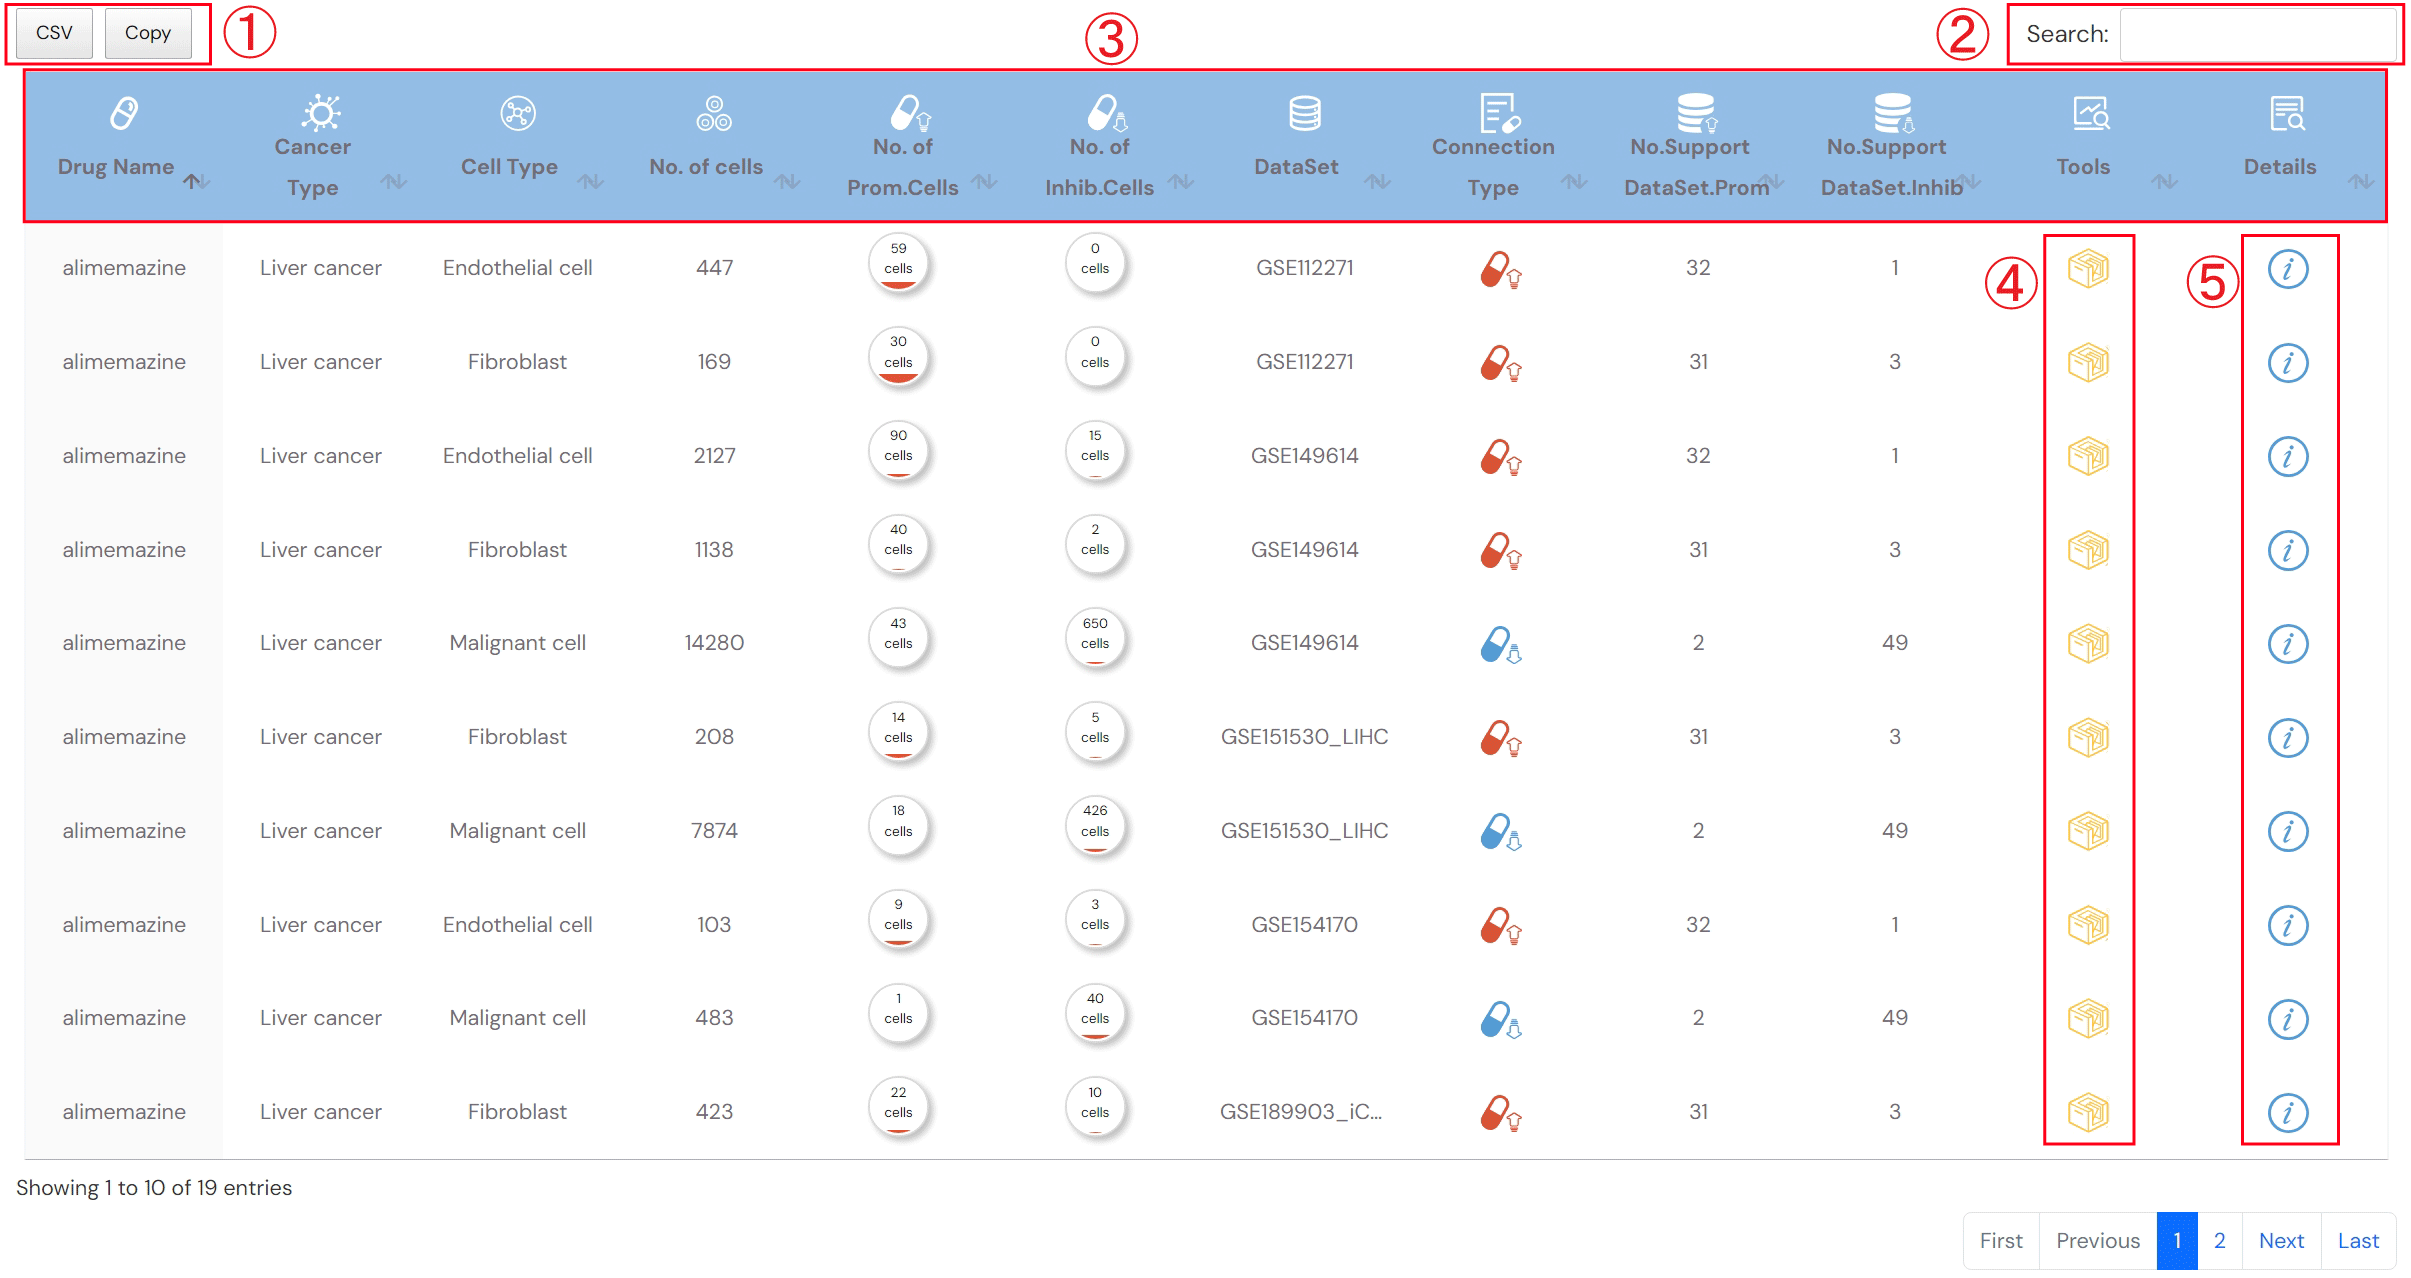
Figure 2-2. Search result for Single-cell Drug Perturbation tool
Detailed descriptions about drug, dataset and the association between drug and cell type (Figure 2-3).
1.Detailed description of drug
2.Detailed description of dataset
3.3.Detailed description of association between drug and cell type
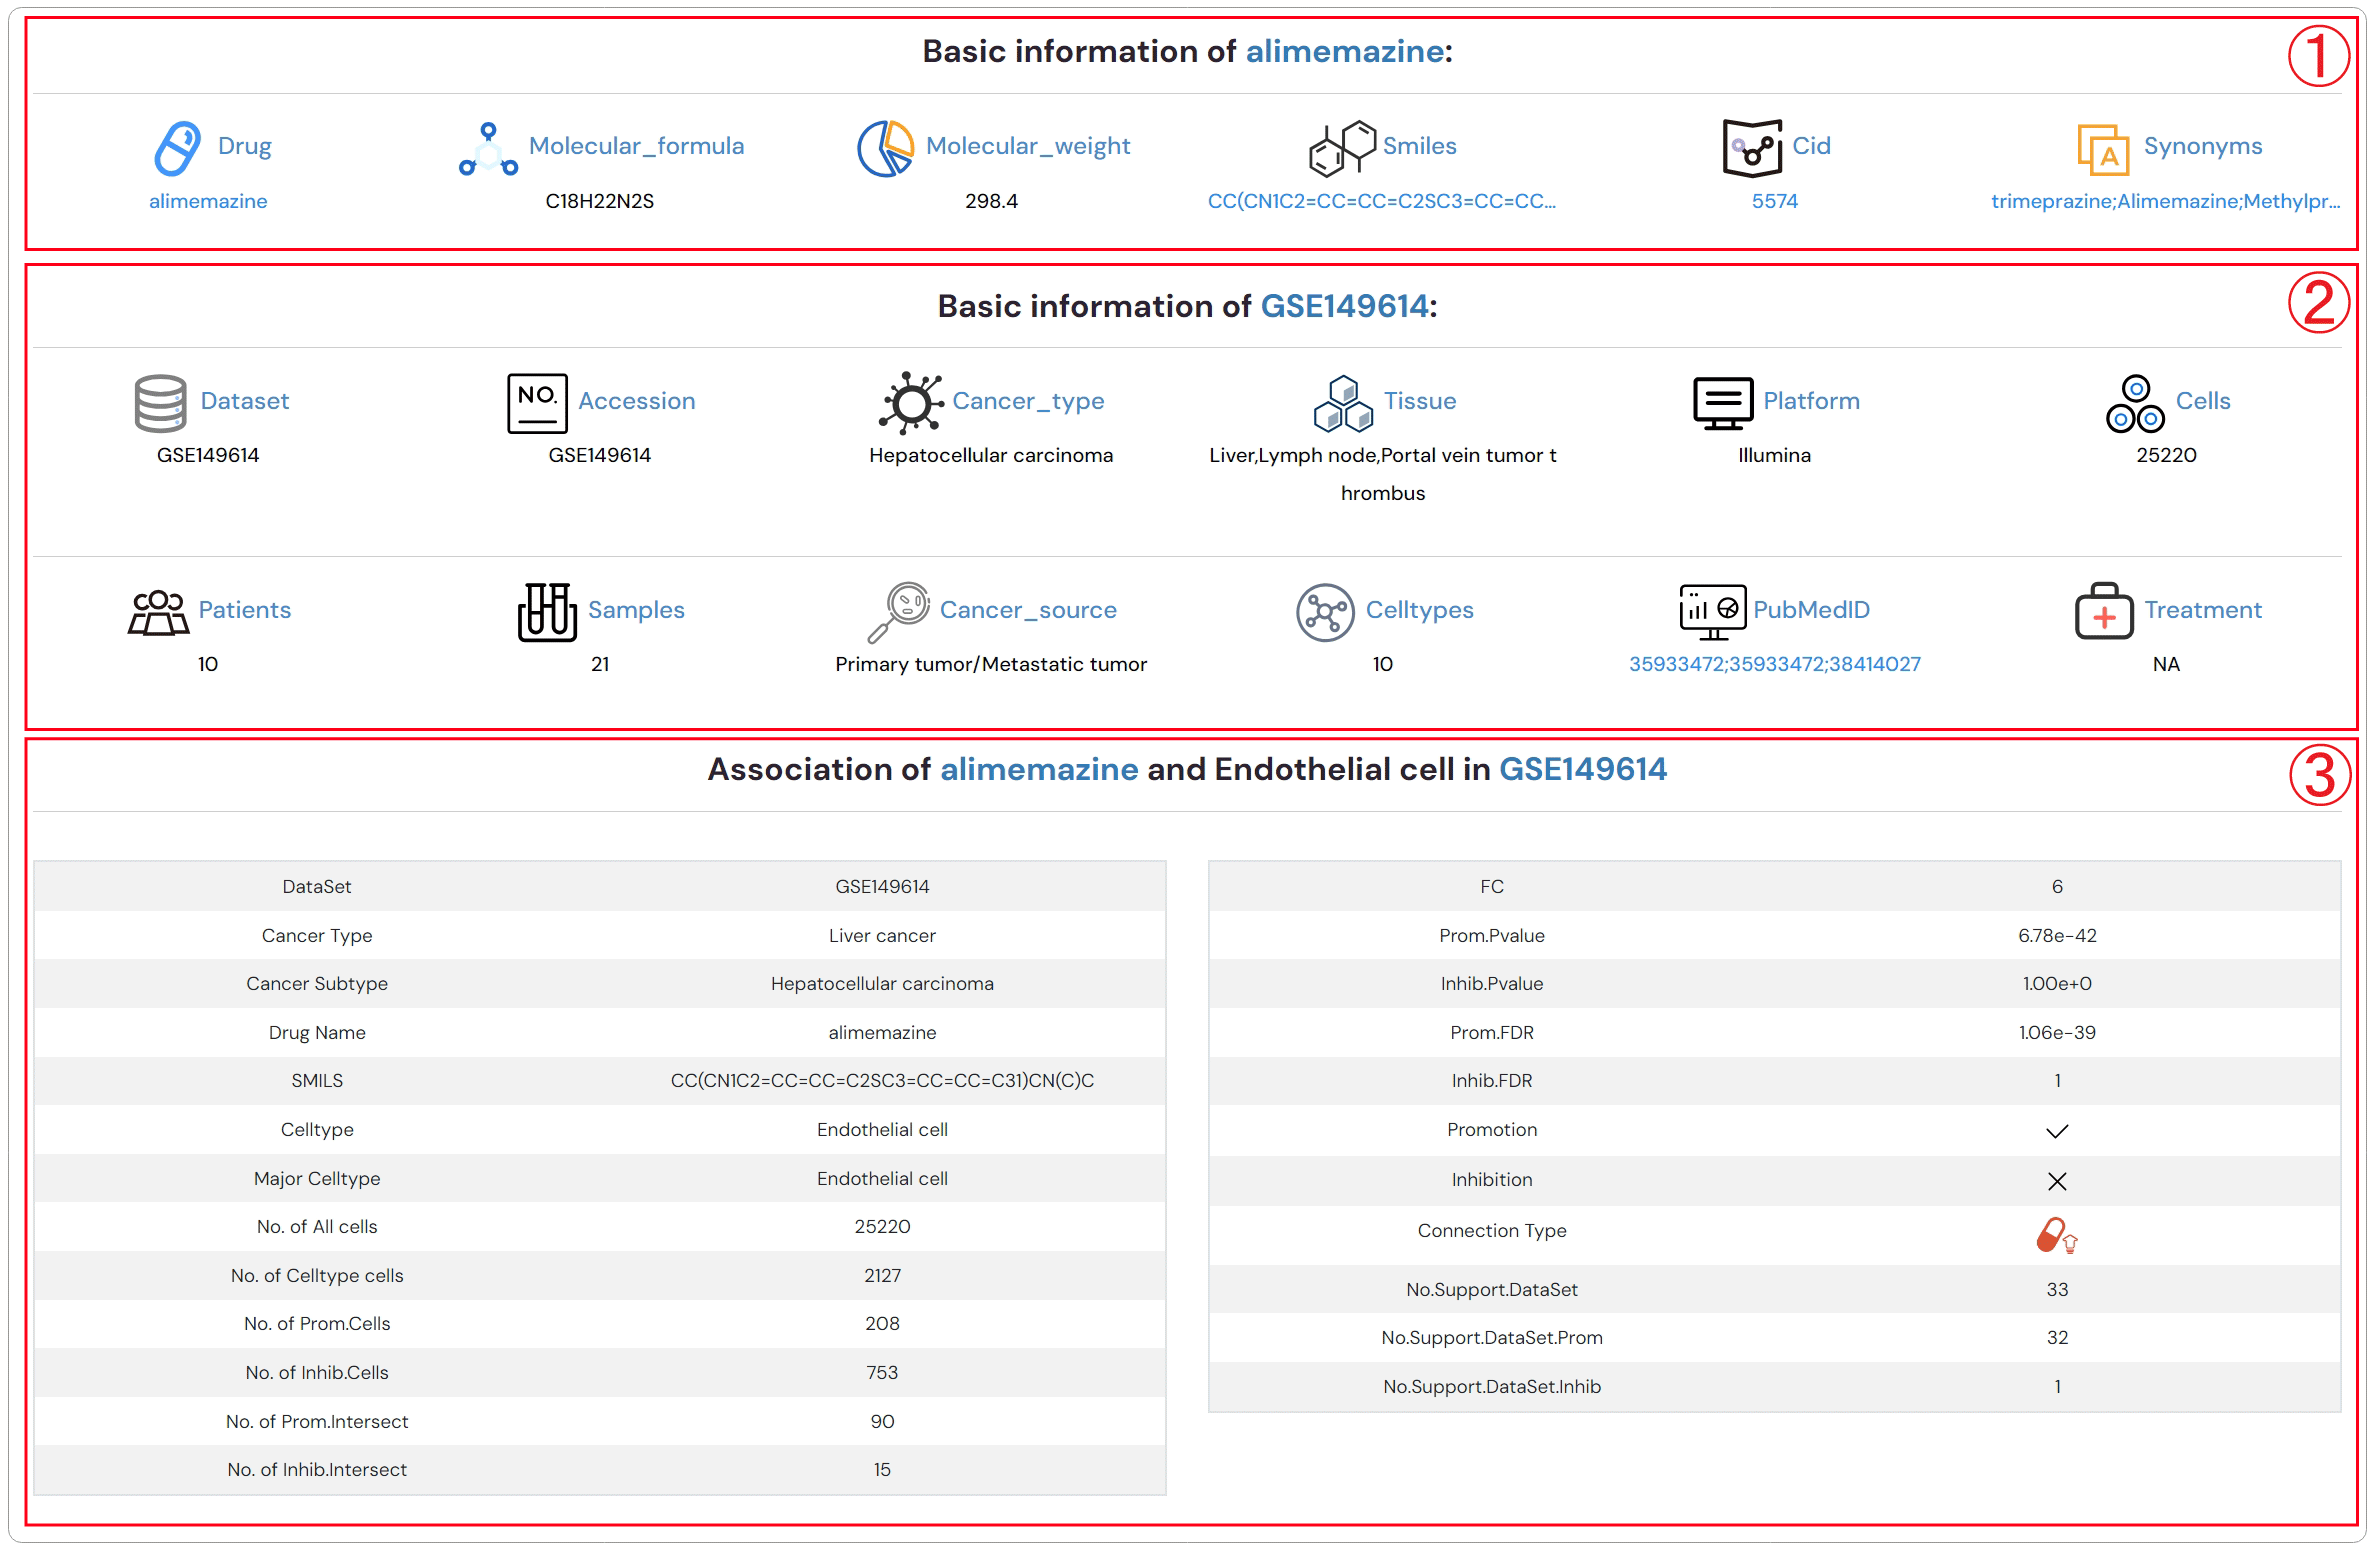
Figure 2-3. Detailed descriptions about drug, dataset and the association between drug and cell type
ScDrugAct-Search For Single-Cell Drug Sensitivity (Figure 2-4)
1. 1.Select the drug name or SMILES for your search.
2. Search sensitivity/resistance associations between drug/small molecule and cell types by using drug/small molecule, cell type or cancer type.
3. Set the number of datasets that supporting associations between drugs and cell types.
4. Example: click for example information; SEARCH: click to get search result; Reset: click to reset information that have been input.
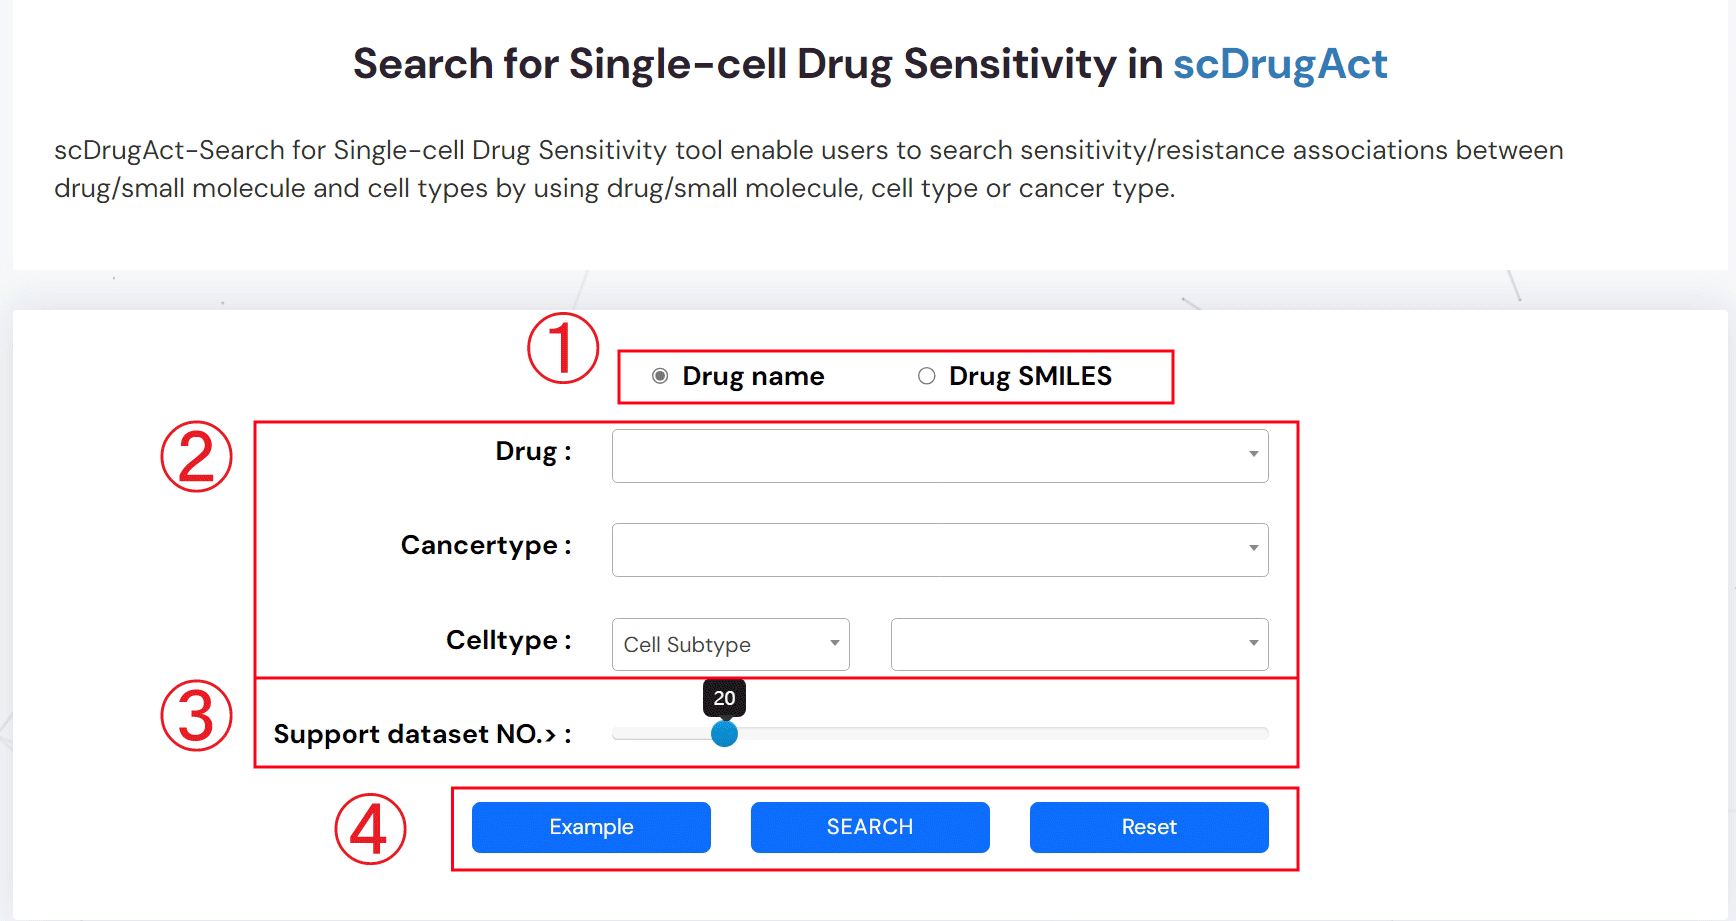
Figure 2-4. scDrugAct-Search for Single-cell Drug Sensitivity tool
The search result for Single-Cell Drug Sensitivity (Figure 2-5)
1.Click to obtain the search result
2.Input keyword to search in the result table
3.The search result table
No. of cells: the number of cells in the corresponding cell type
No. of Sens.cells: the number of drug-sensitivity cells
No. of Resi.cells: the number of drug-resistance cells
Connection type: the type associations between drug and cell type, including sensitivity and resistance
No.Support DataSet.Sens: the number of datasets that supporting sensitivity associations between drug and cell type
No.Support DataSet.Resi: the number of datasets that supporting resistanceassociations between drug and cell type
Tools: interfaces for further analysis
Details: click to see detailed descriptions about drug, dataset and the association between drug and cell type (Figure 2-6).
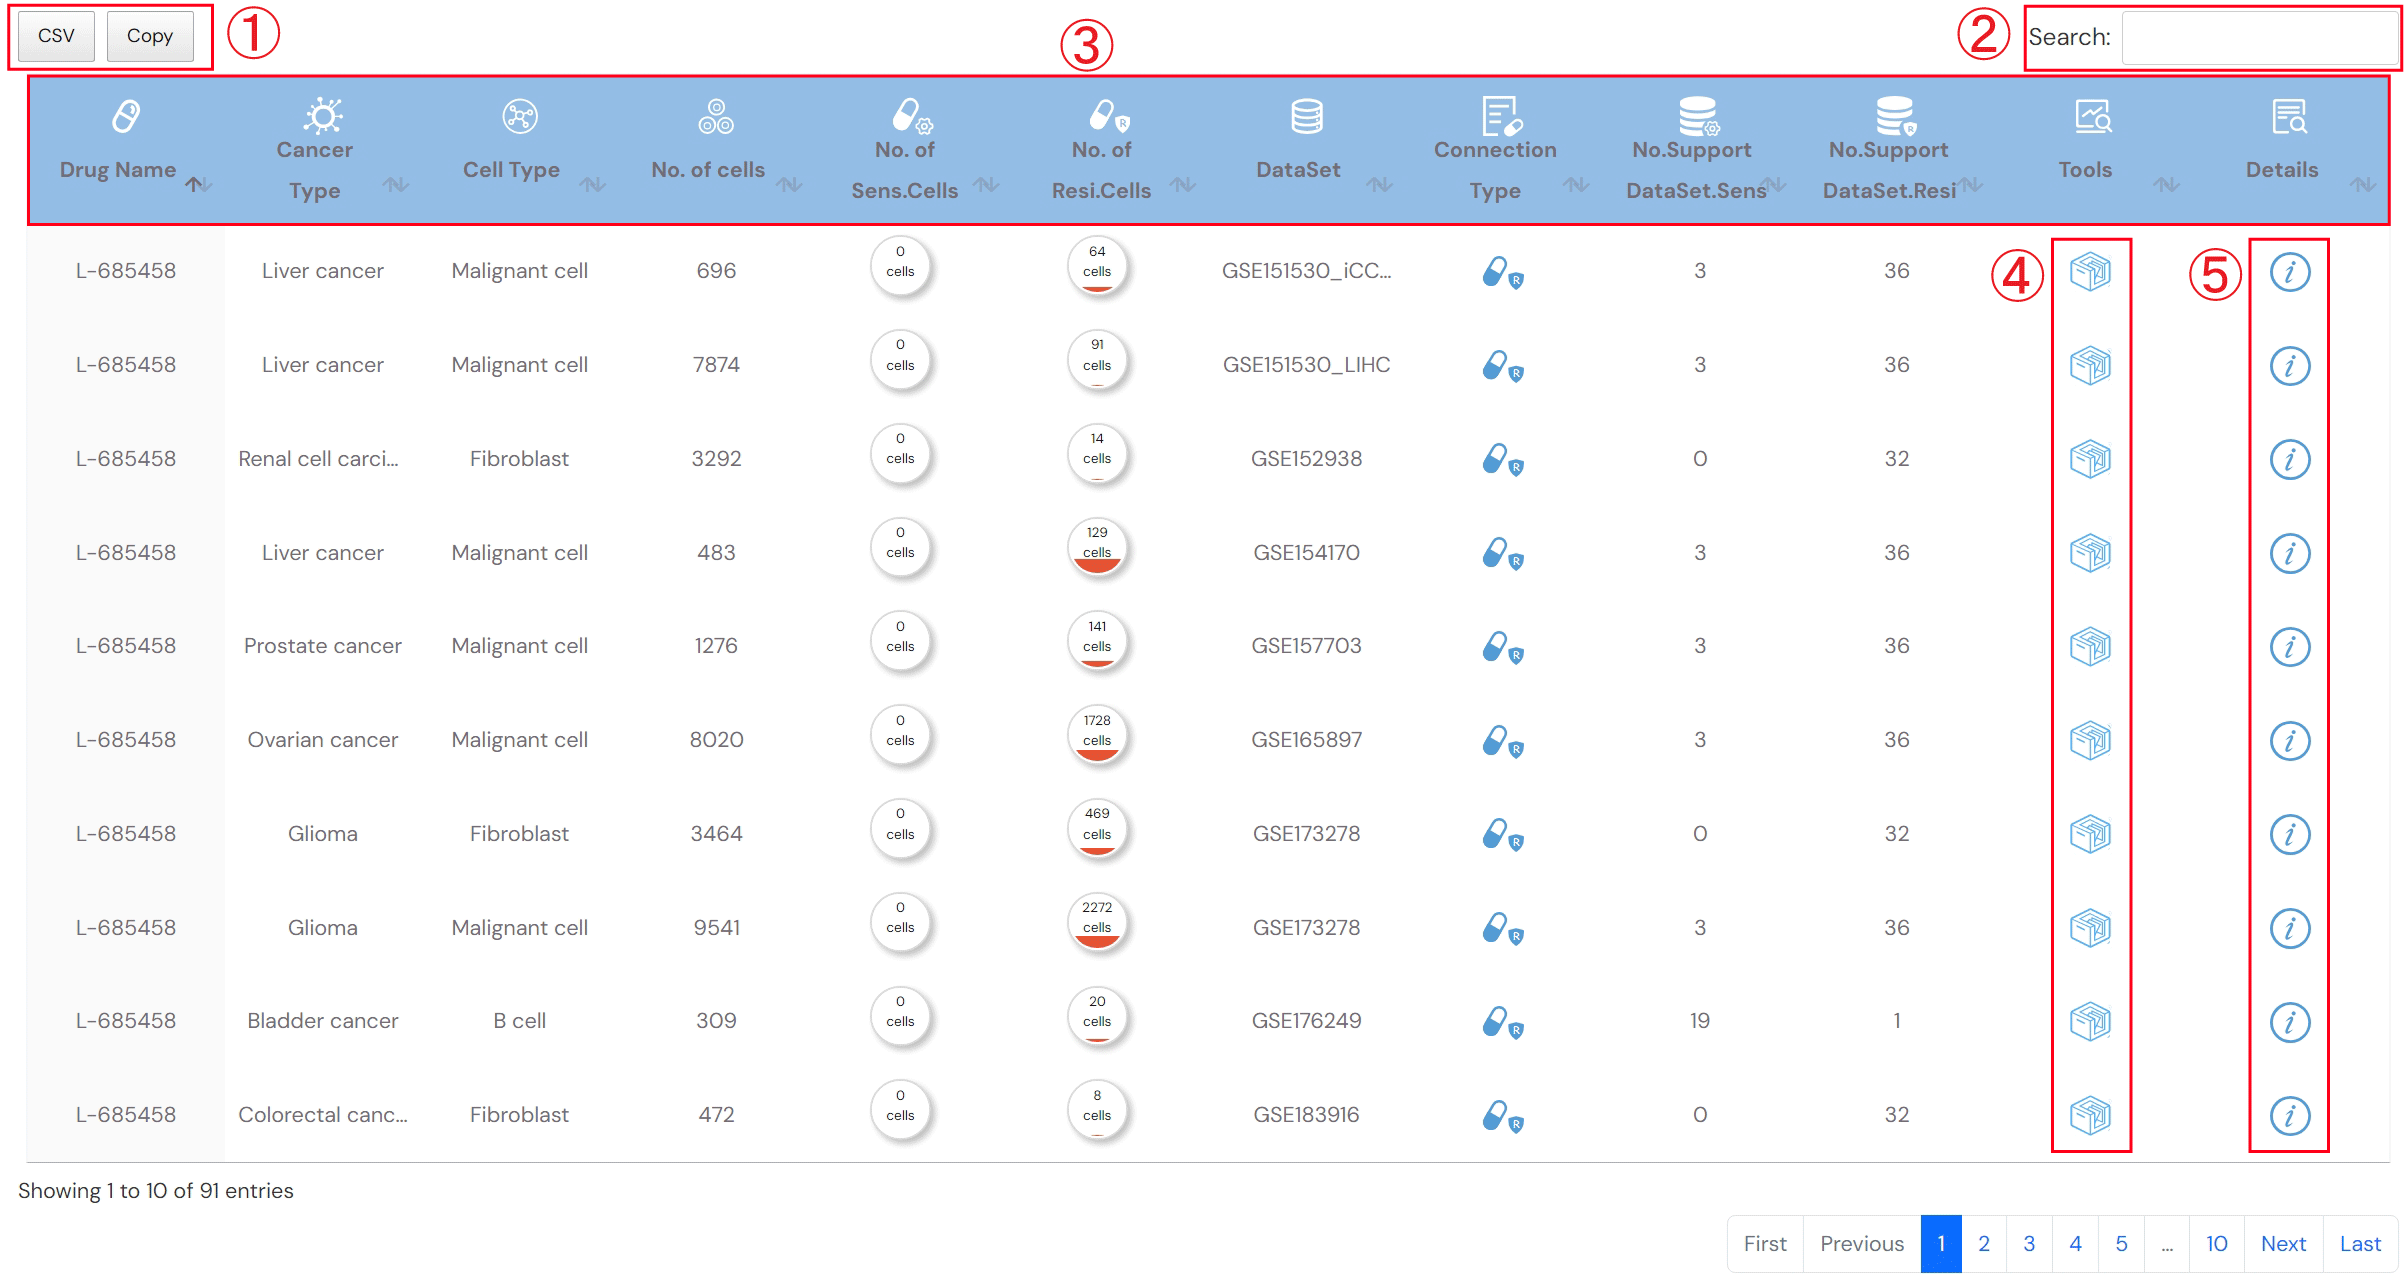
Figure 2-5. Search result for Single-cell Drug Sensitivity tool
Detailed descriptions about drug, dataset and the association between drug and cell type (Figure 2-6).
1.Detailed description of drug
2.Detailed description of dataset
3.Detailed description of association between drug and cell type
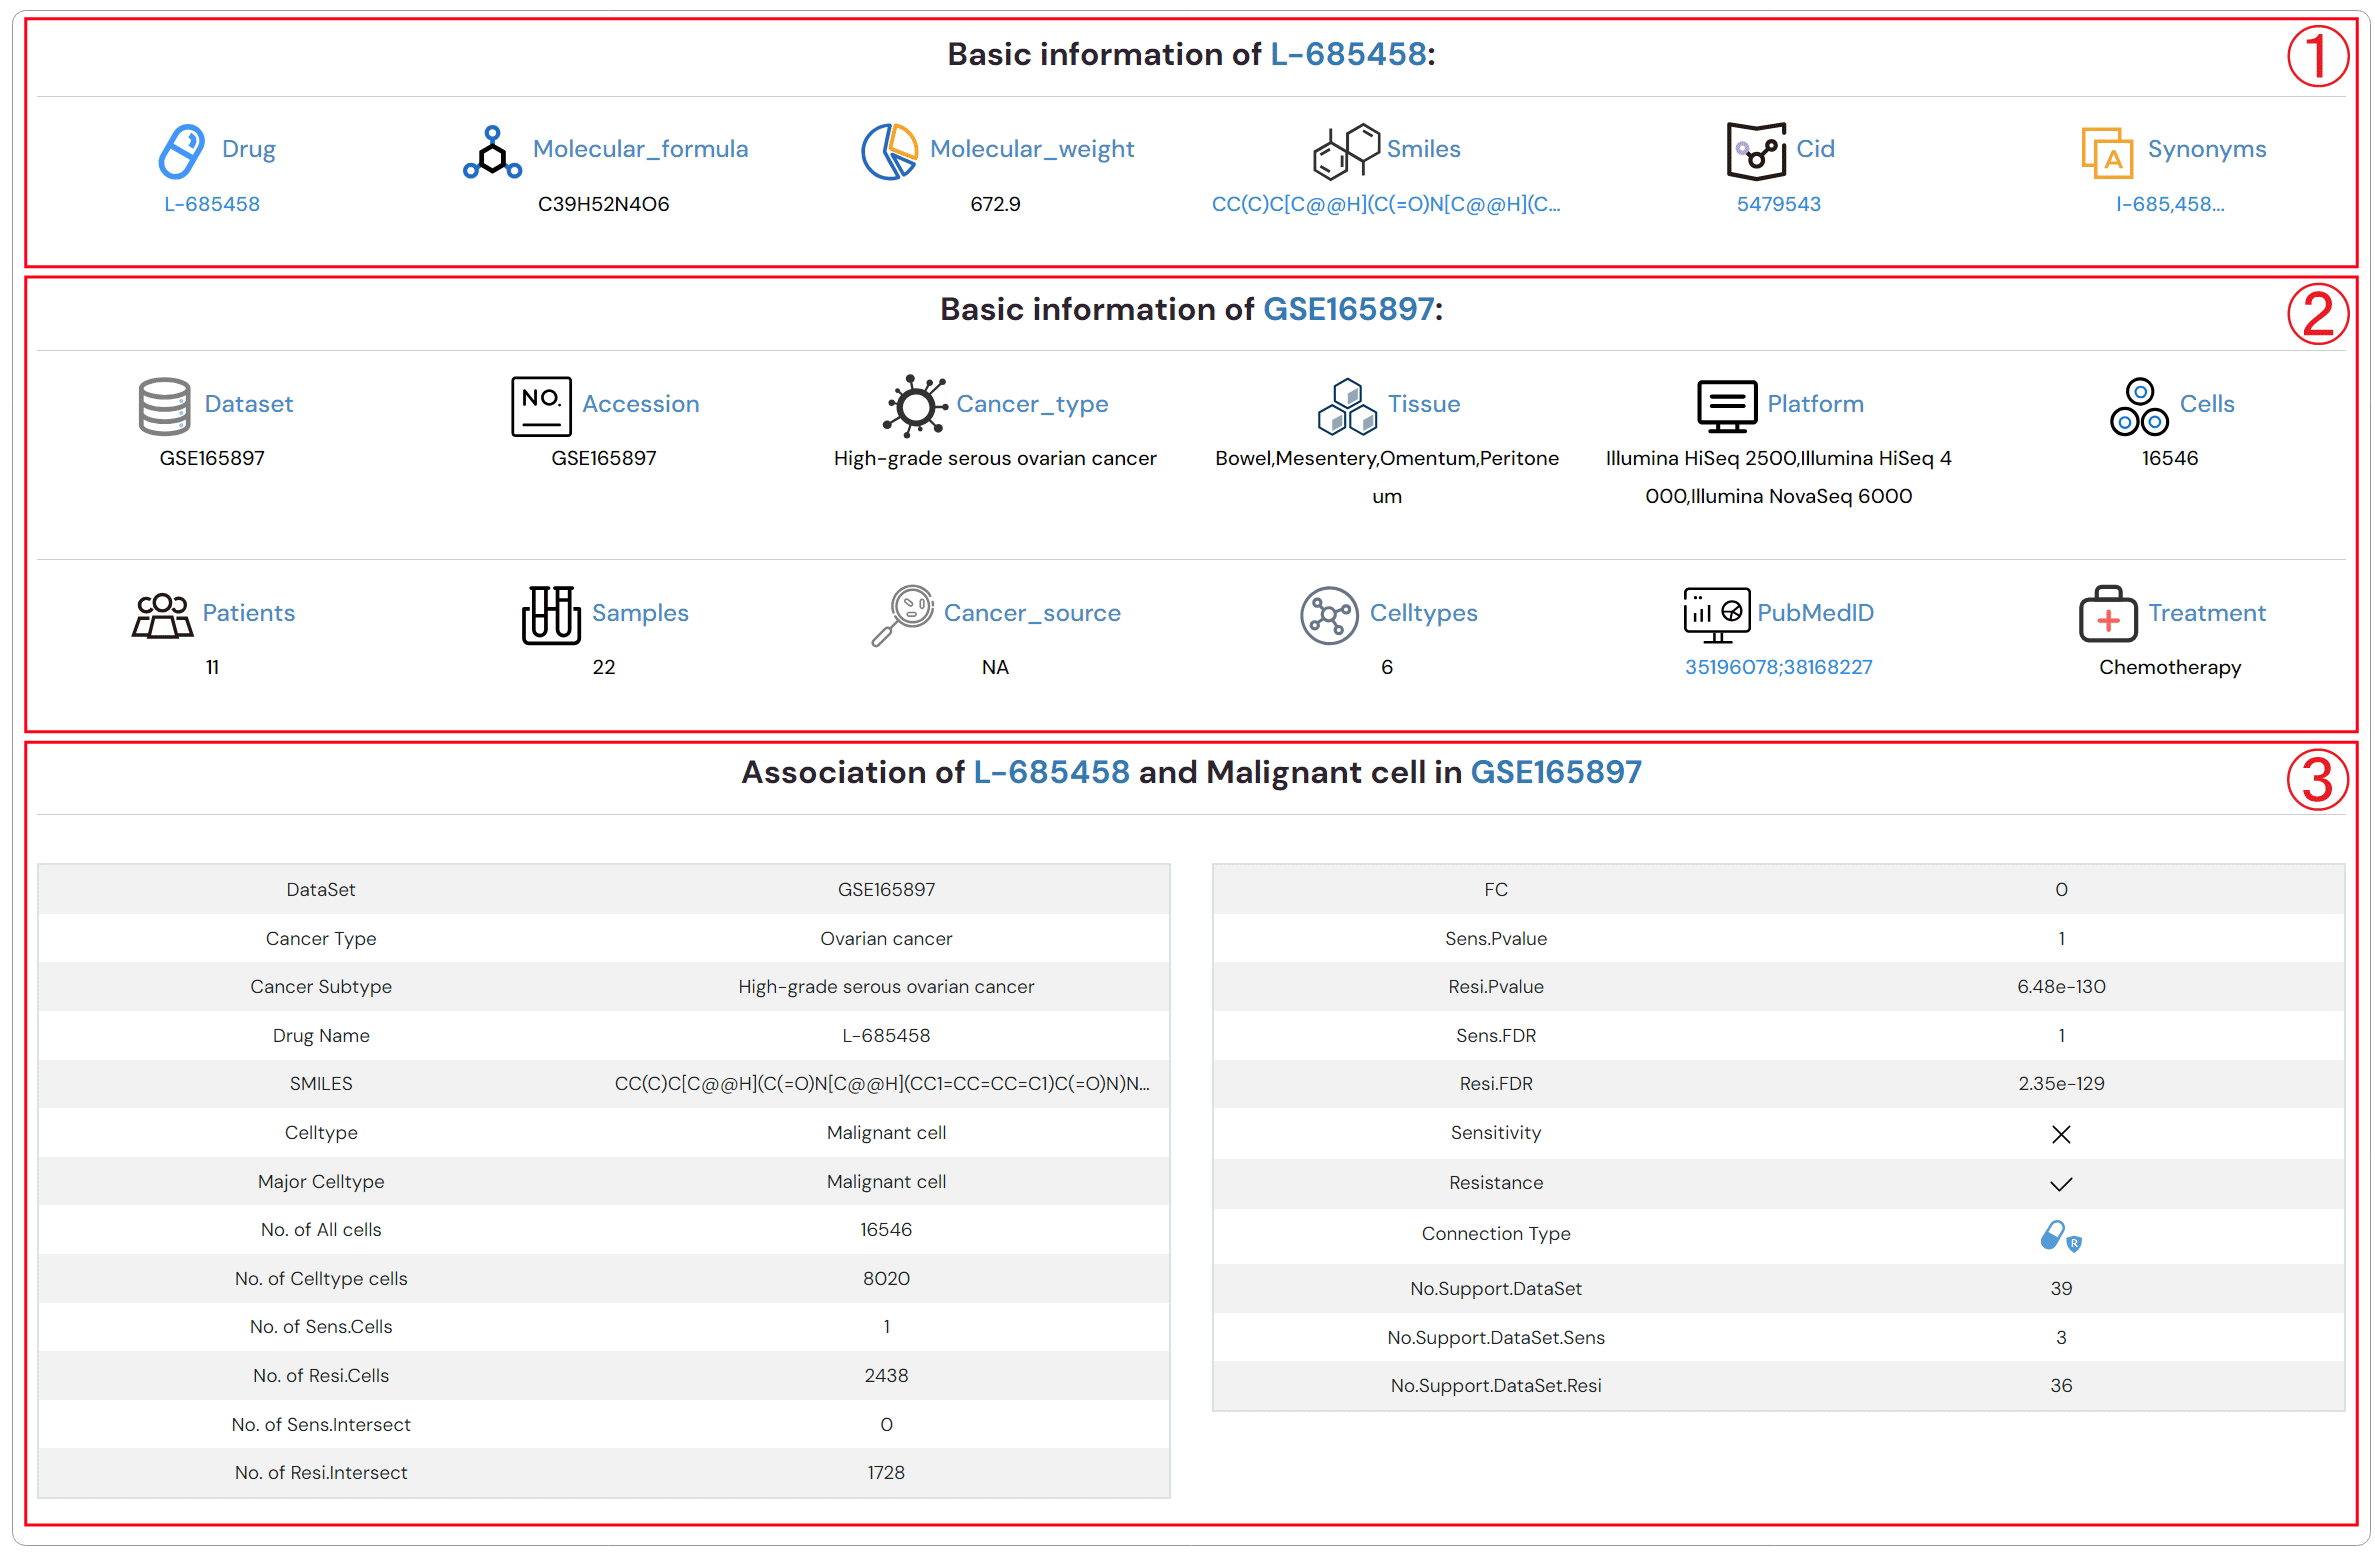
Figure 2-6. Detailed descriptions about drug, dataset and the association between drug and cell type
1. Browse Associations Between Drugs/Small Molecules and Cell Types.
2. Click to obtain the browse associations between cell types and drug perturbation.
3. Click to obtain the browse associations between cell types and drug sensitivity.
4. The browse result table
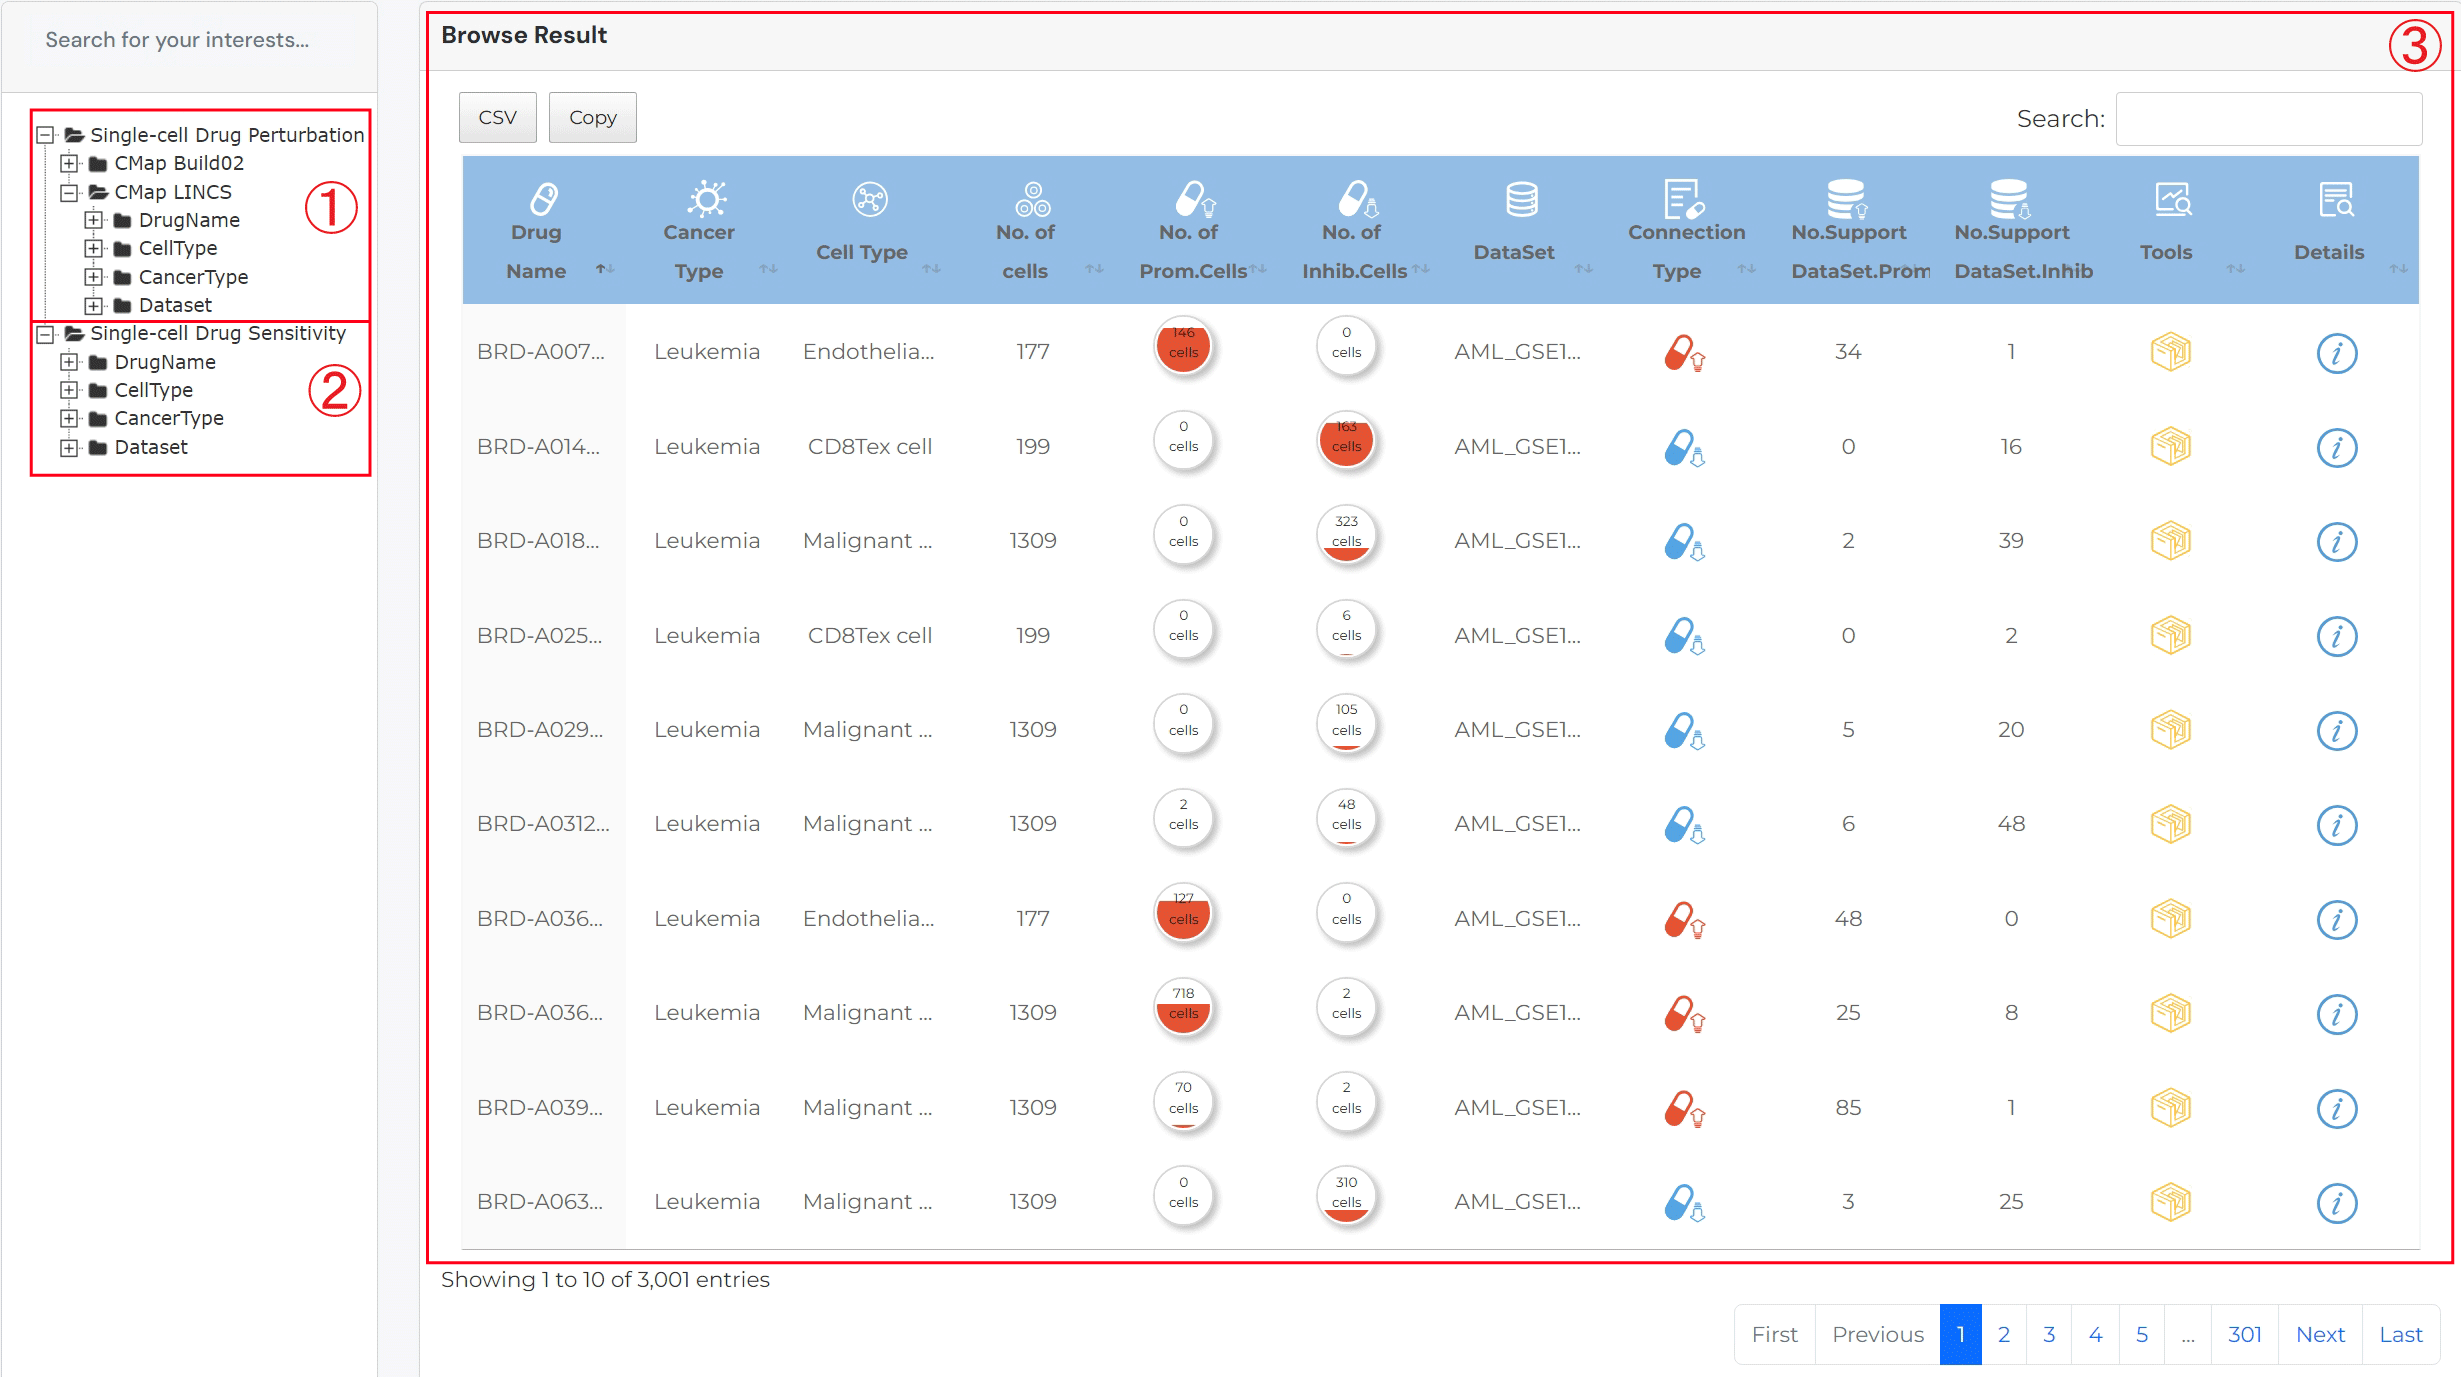
For result table of browse single-cell drug perturbation:
No. of cells: the number of cells in the corresponding cell type
No. of Prom.cells: the number of drug-promotion cells
No. of Inhib.cells: the number of drug-inhibition cells
Connection type: the type associations between drug and cell type, including promotion and inhibition
No.Support DataSet.Prom: the number of datasets that supporting promotion associations between drug and cell type
No.Support DataSet.Inhib: the number of datasets that supporting inhibition associations between drug and cell type
Tools: interfaces for further analysis
Details: click to see detailed descriptions about drug, dataset and the association between drug and cell type
The search result for browse Single-Cell Drug Sensitivity:
No. of cells: the number of cells in the corresponding cell type
No. of Sens.cells: the number of drug-sensitivity cells
No. of Resi.cells: the number of drug-resistance cells
Connection type: the type associations between drug and cell type, including sensitivity and resistance
No.Support DataSet.Sens: the number of datasets that supporting sensitivity associations between drug and cell type
No.Support DataSet.Resi: the number of datasets that supporting resistance associations between drug and cell type
Tools: interfaces for further analysis
Details: click to see detailed descriptions about drug, dataset and the association between drug and cell type.
Users can download the following data:
1.Drug-perturbation up-/down-regulated genes from CMap Build02, CMap LINCS L1000 and drug-sensitivity/resistance related genes from RNAactDrug.
2.Information of scRNA-seq dataset, and drug-cell connection profiles across all datasets.
3.Download drug-cell type associations.