Overview the CPAD
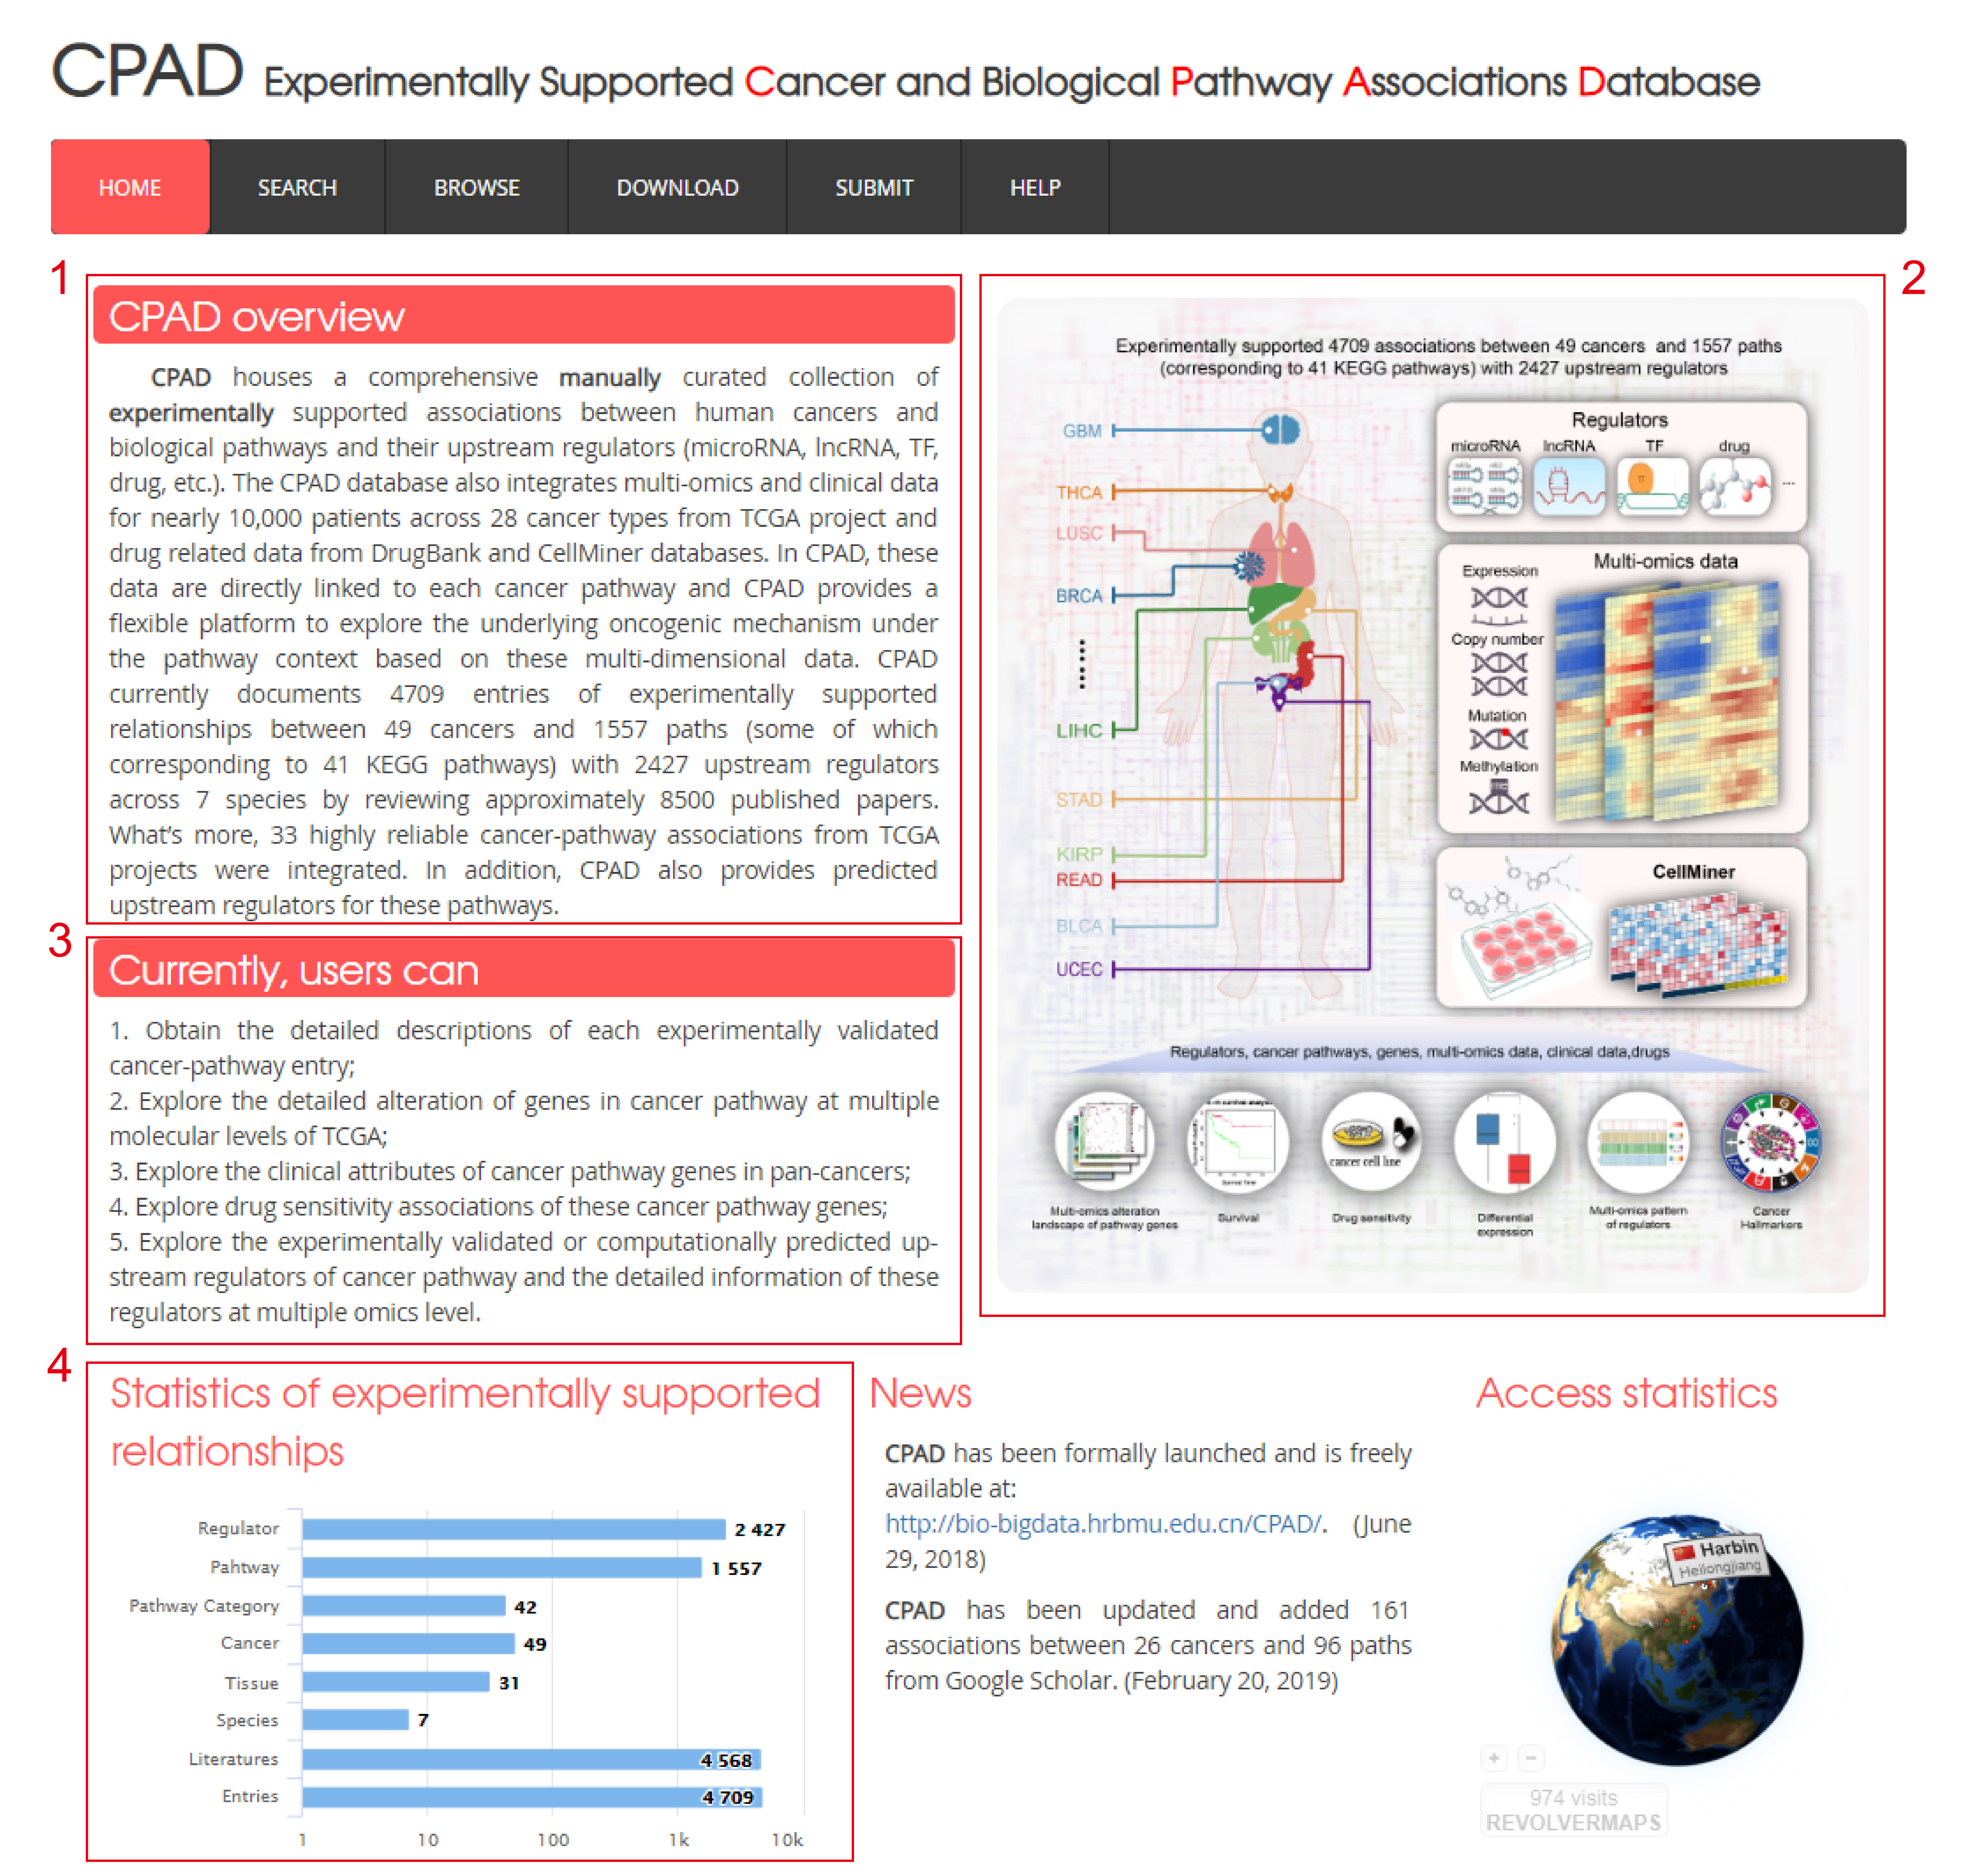
1. A brief introduction about the database;
2. The integrated data contents and functions of the database;
3. Main functions introduction of the database;
4. The statistics of the data in database, including the number of cancers, pathway and entries etc.
Quick start guide for search page
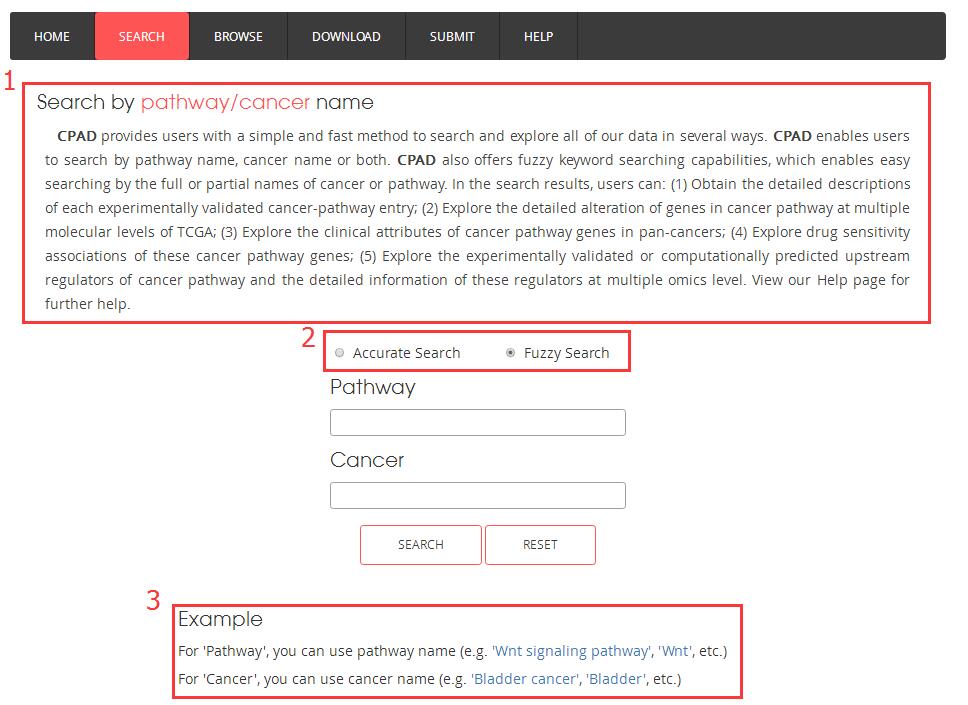
1. A brief guide to getting started;
2. You can select accurate search or fuzzy search;
3. A simple example for input.
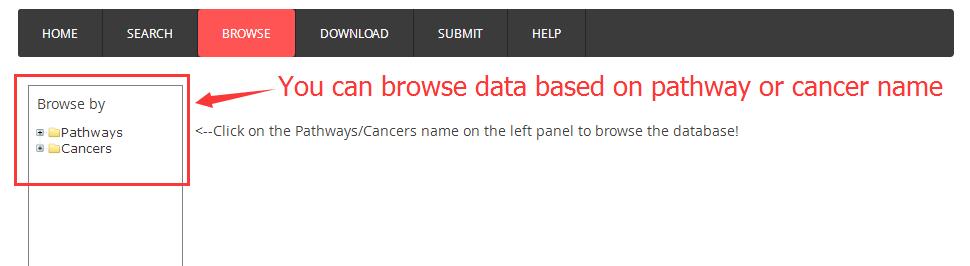
Quick start guide for browse page
Result and Detail
2. The detail information
2.1 Expression
2.2 Mutation
2.3 Copy number variation
2.4 Methylation
2.5 Survival
2.6 Drug sensitivity information
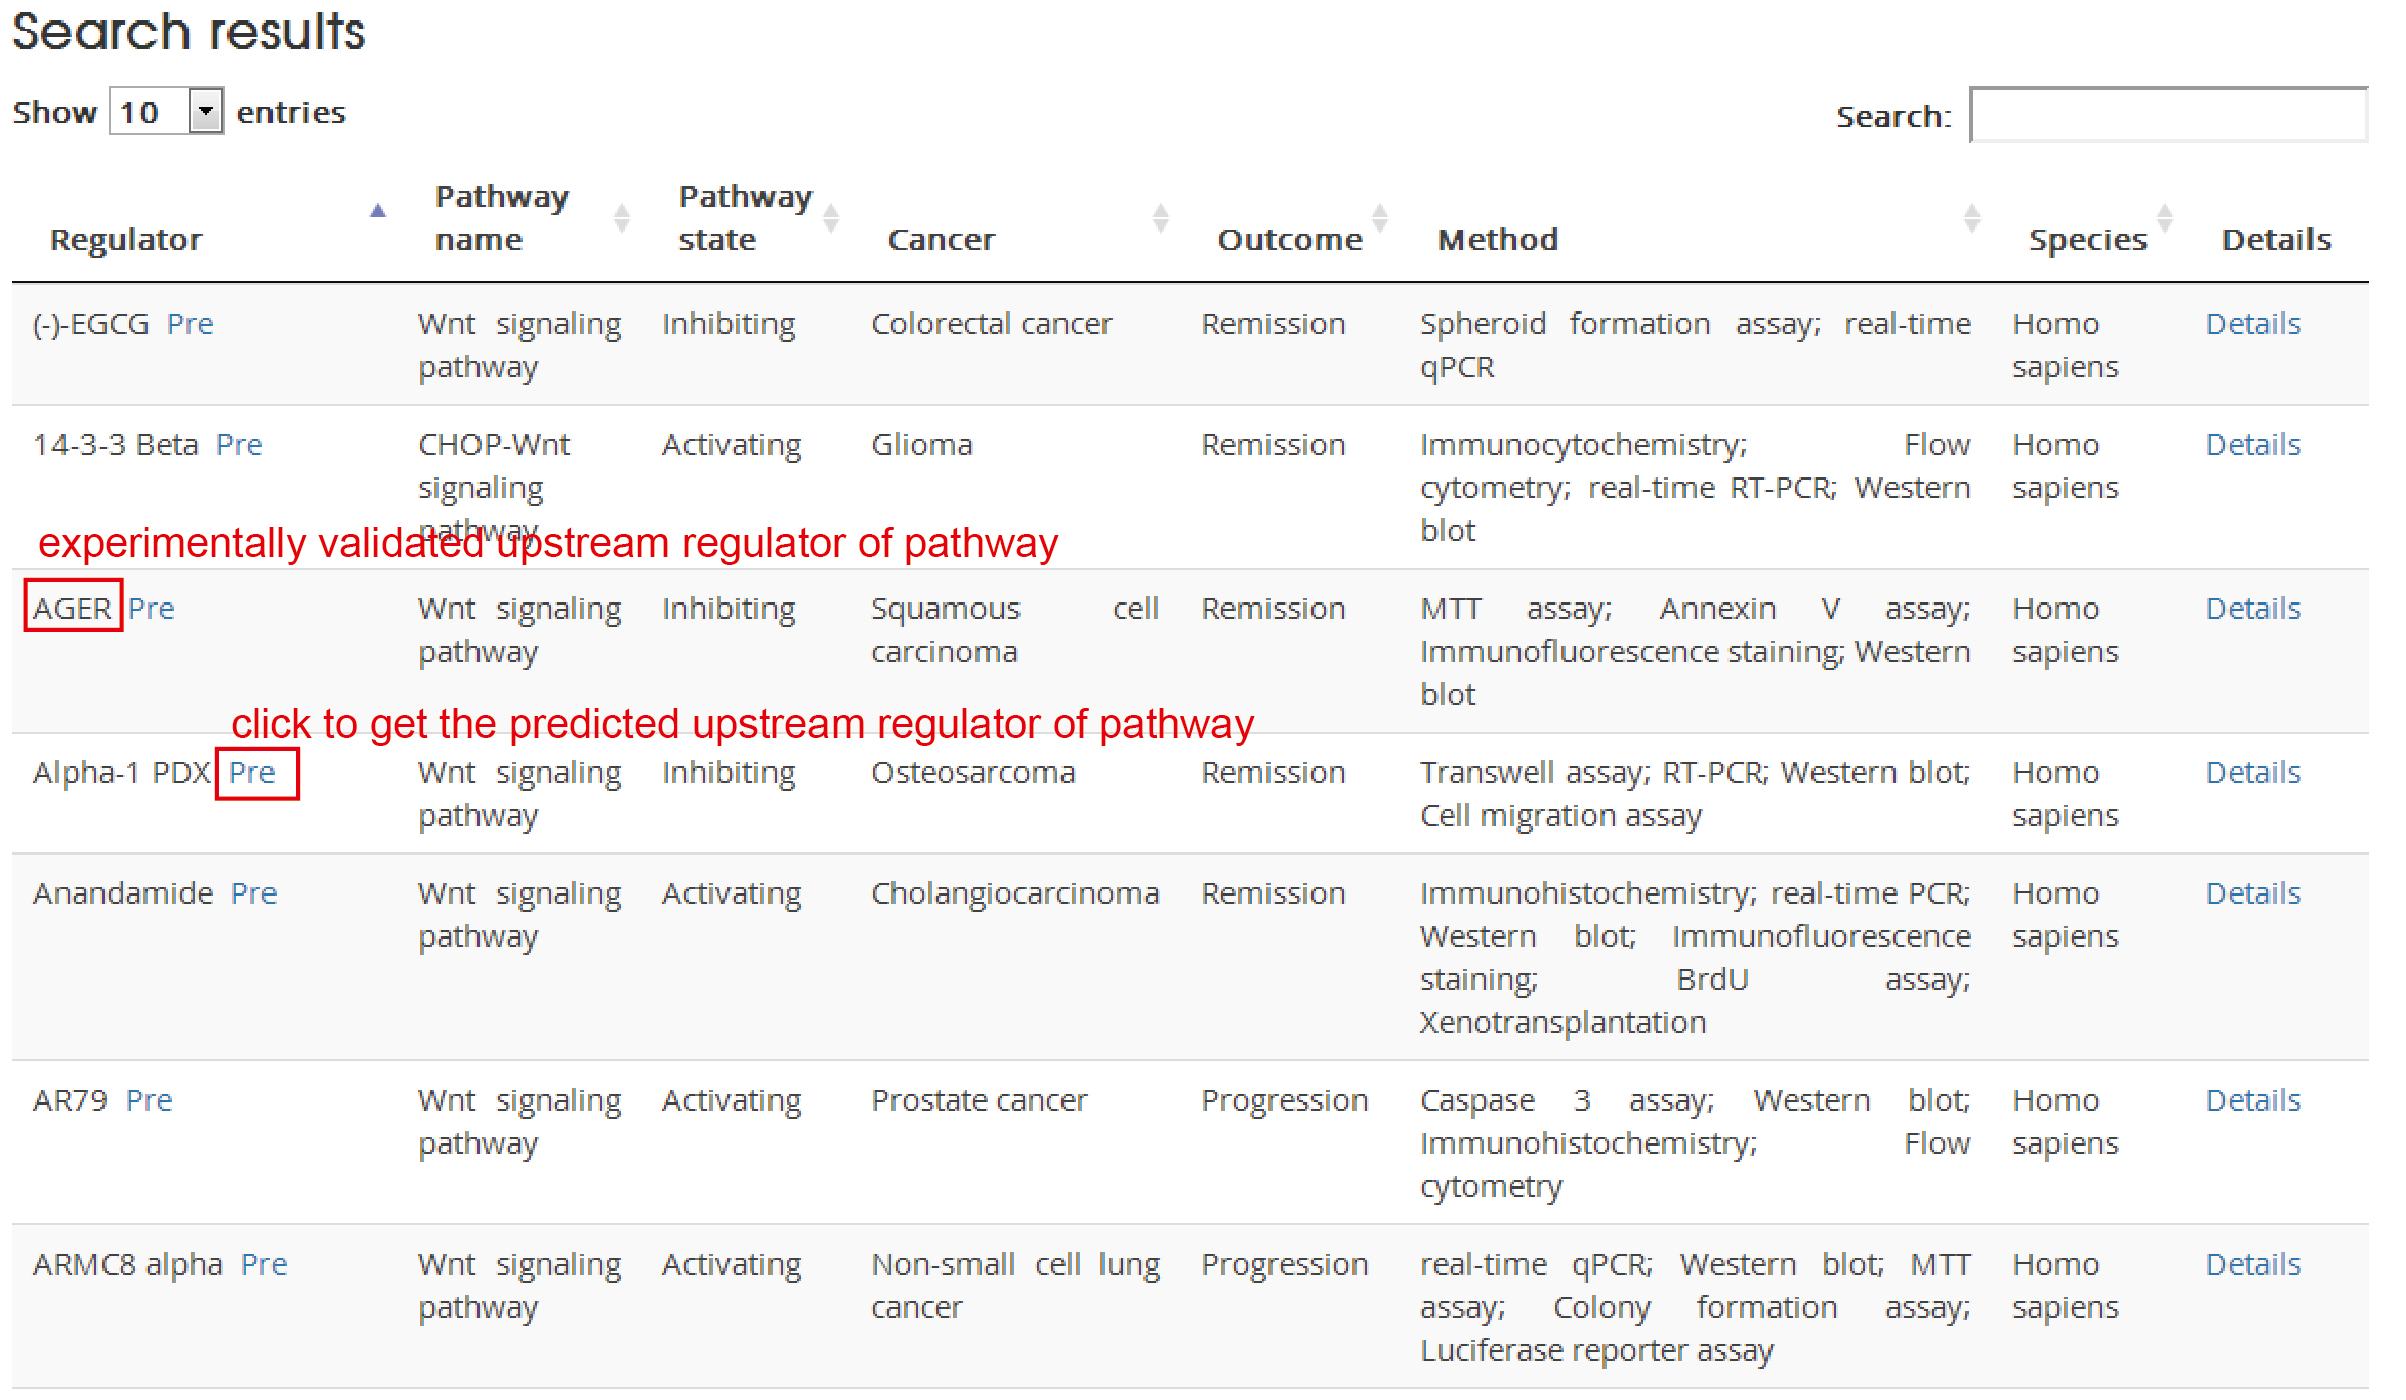
Search/browse result table:
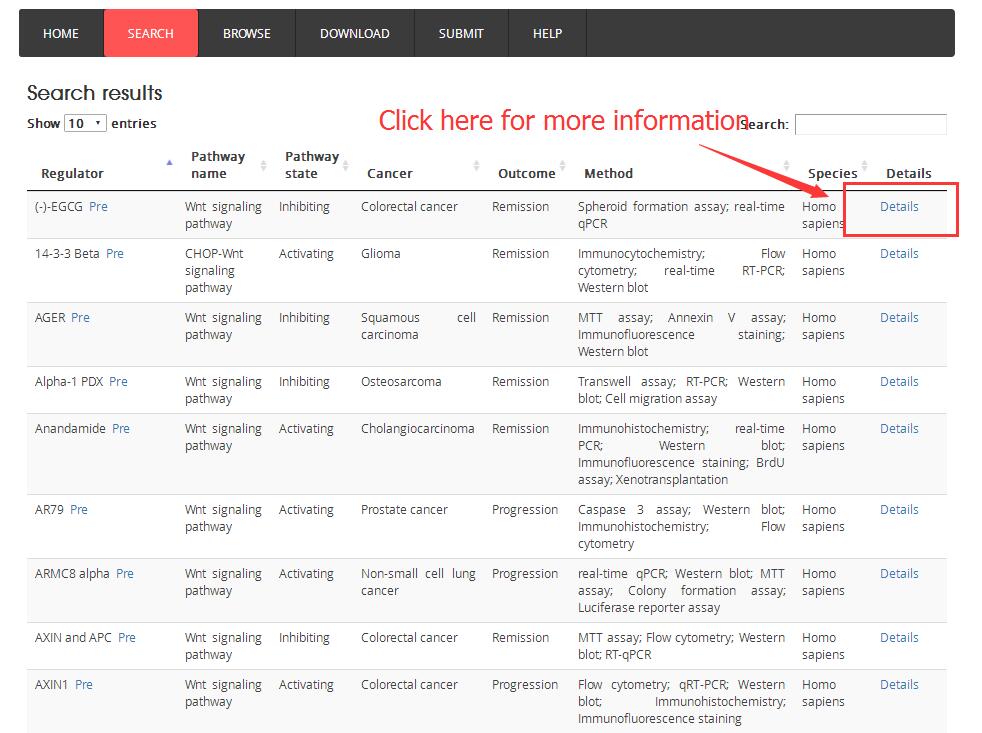
The detail information after click the ‘Details’:
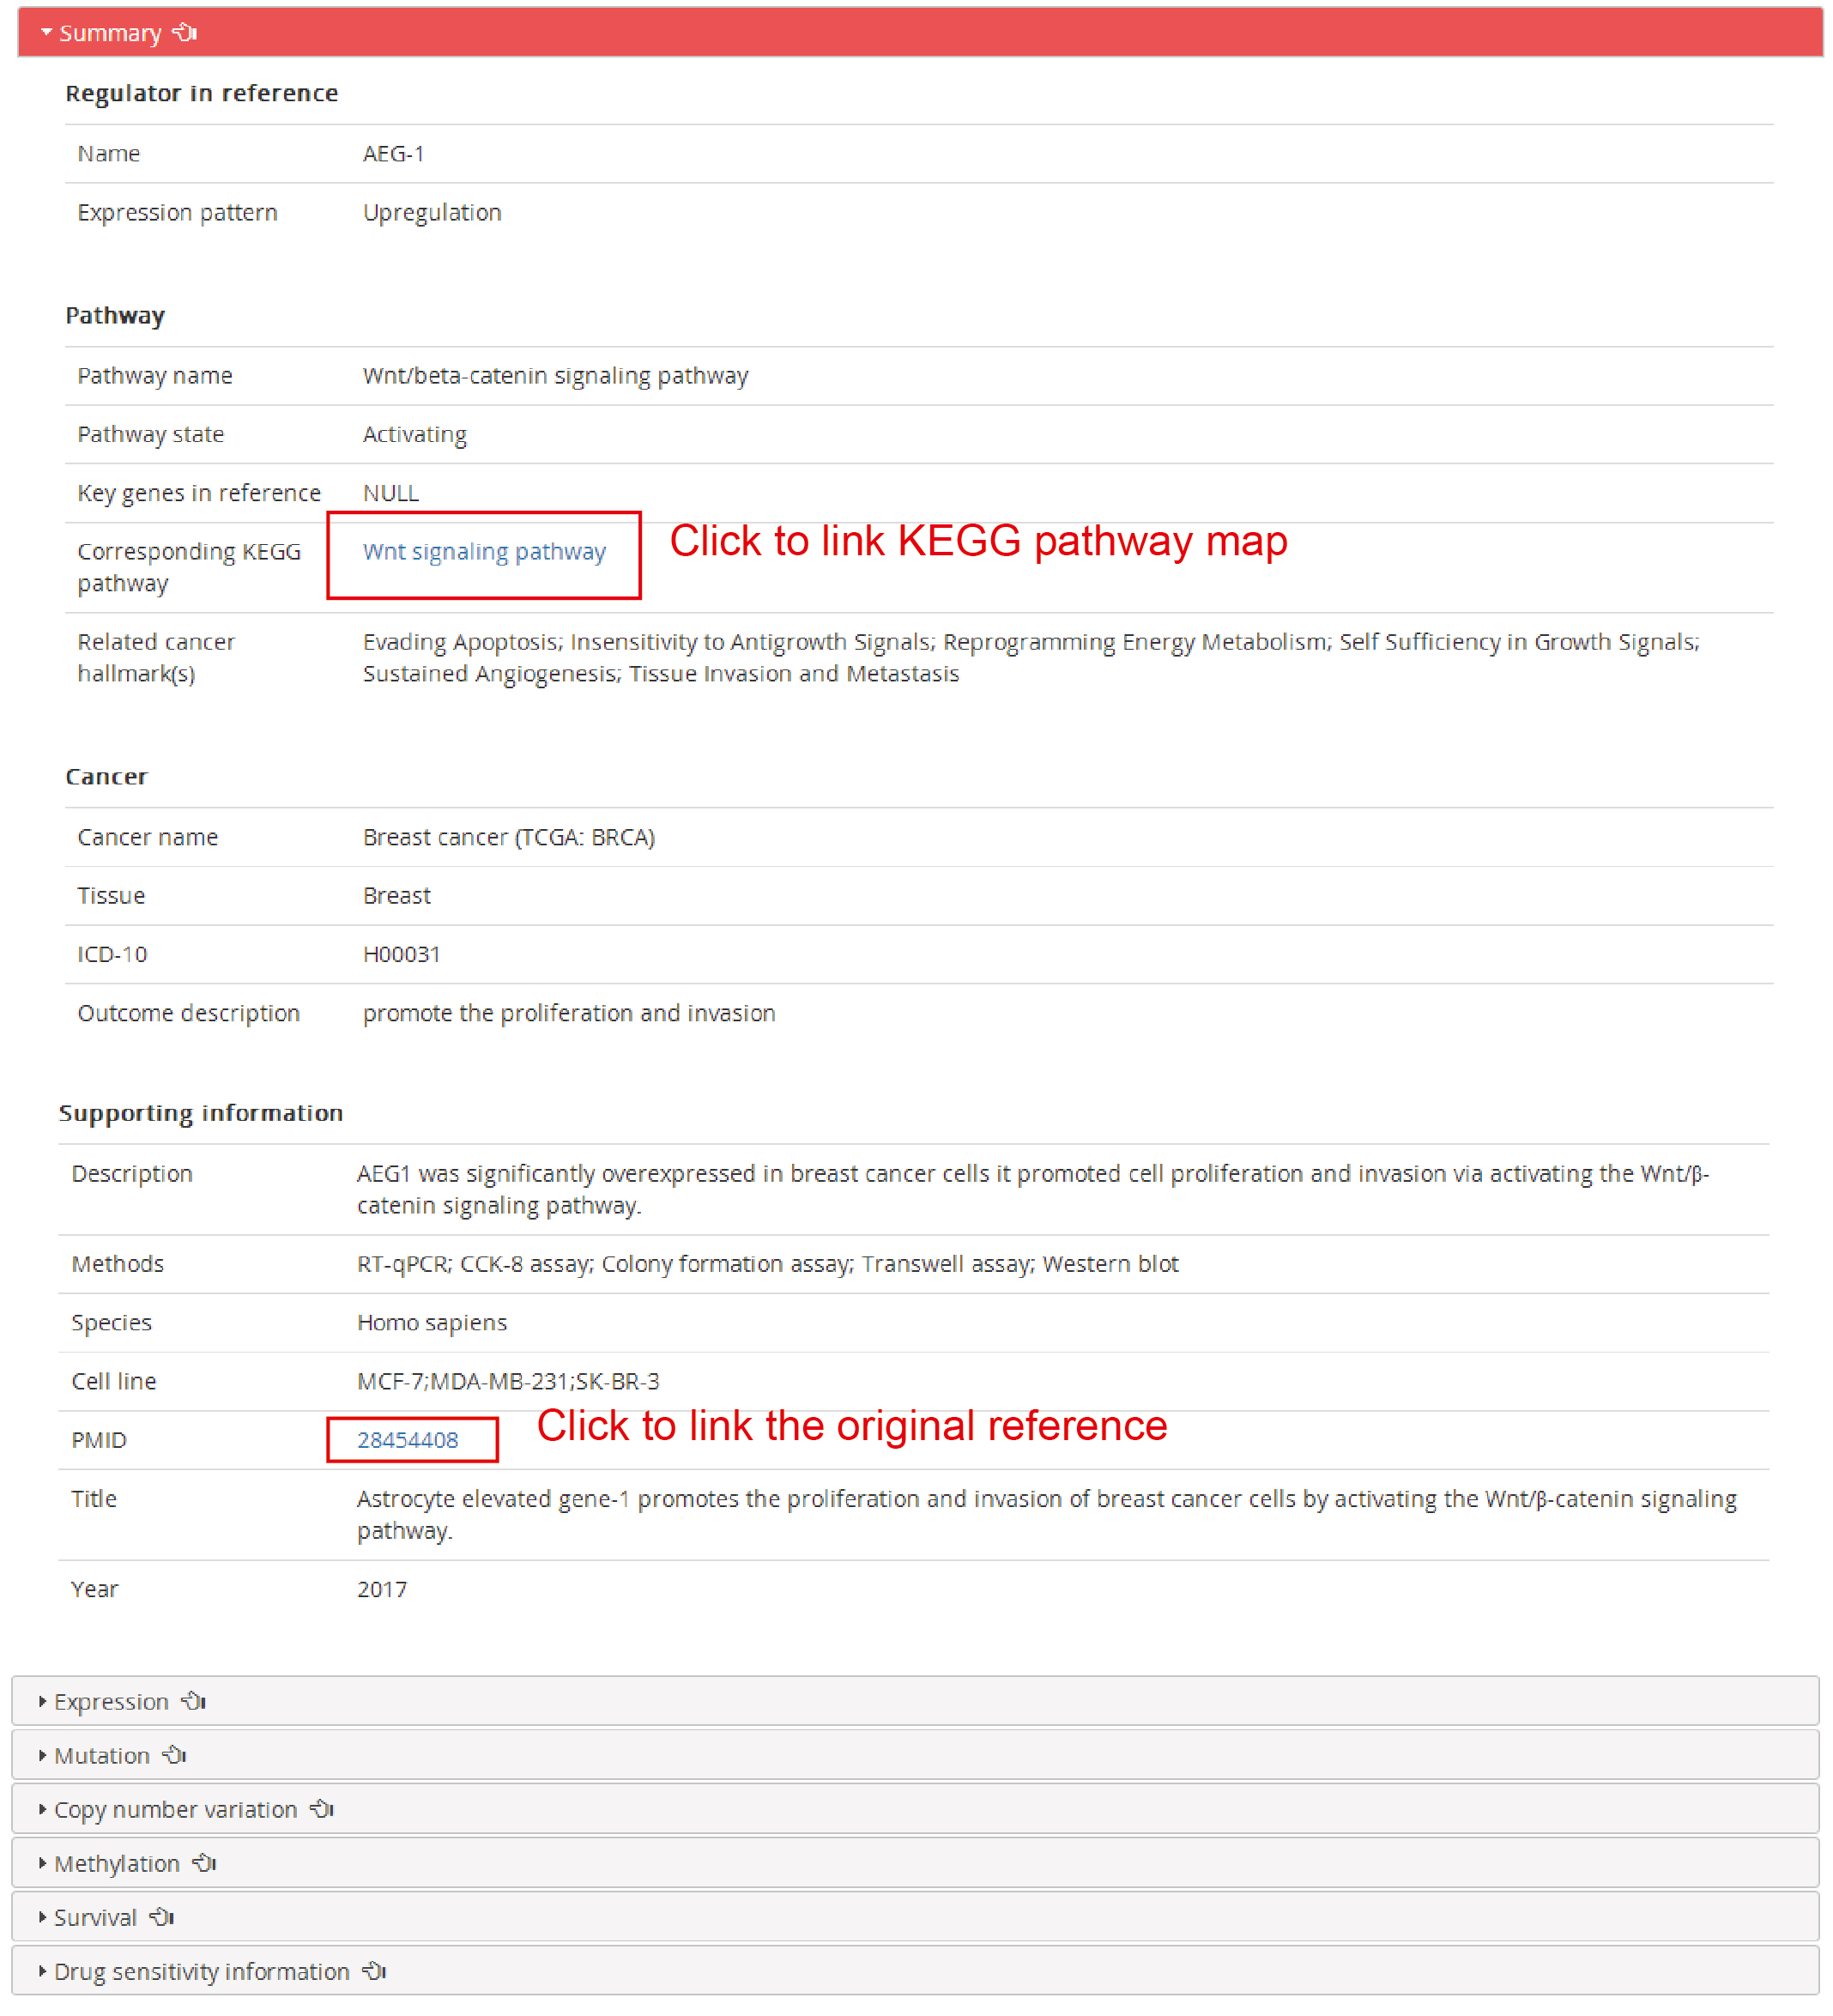
The detail framework including summary, expression, mutation, copy number variation, methylation, survival and drug sensitivity information.
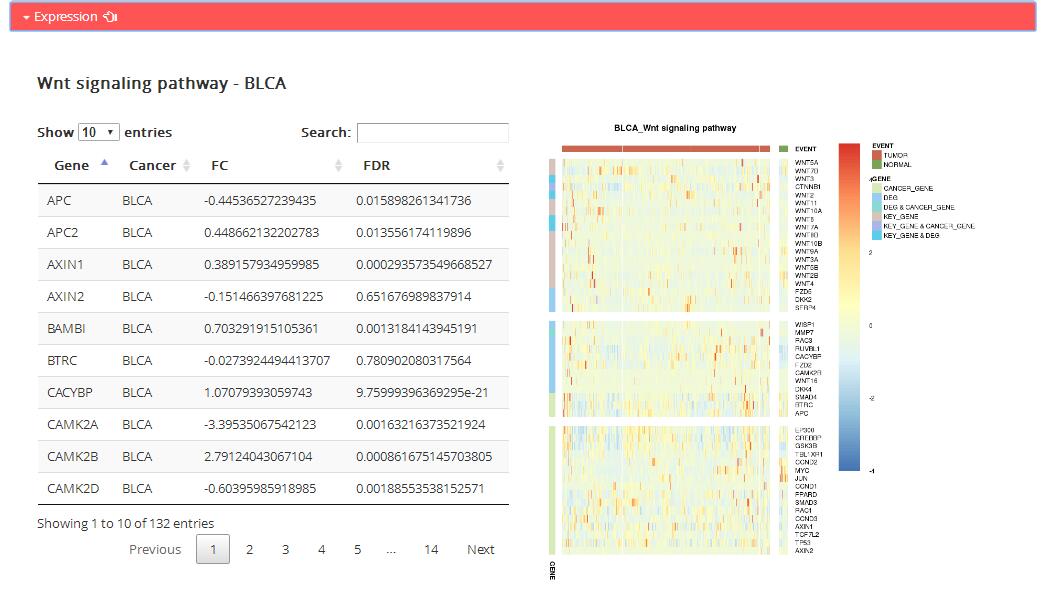
Expression: expression information of genes in corresponding KEGG pathway
Table: the table shows dfferential expression pattern of all genes in corresponding KEGG pathway.
Gene: Pathway gene in corresponding KEGG pathway
Cancer: Corresponding TCGA caner type
FC: A base-2 logarithm to fold changes of genes expression between tumor samples and normal samples
FDR: False discovery rate of t-test of genes expression between tumor samples and normal samples
Figure: the map shows specific genes expression in corresponding KEGG pathway.
KEY_GENE: including key genes in reference and genes showed in pathway name
DEG: Differentially expressed genes in corresponding KEGG pathway
CANCER_GENE: Cancer-related genes in corresponding KEGG pathway
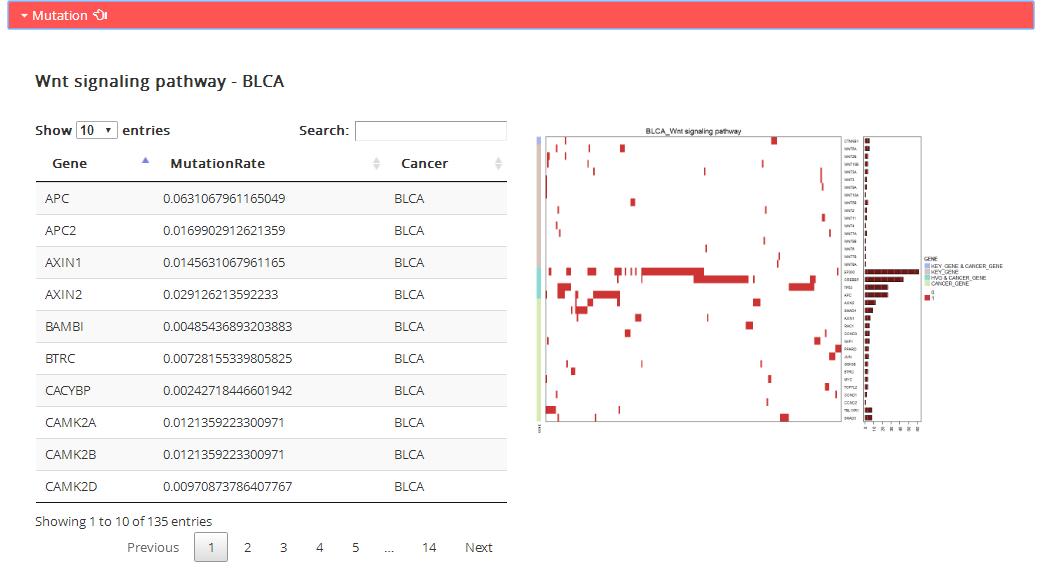
Mutation: Mutation information of genes in corresponding KEGG pathway
Table: the table shows mutation rate of all genes in corresponding KEGG pathway.
Gene: Pathway genes in corresponding KEGG pathway
MutationRate: The mutation frequency in the TCGA cancer samples (except the silent)
Cancer: Corresponding TCGA cancer type
Figure: the map shows specific genes mutation status in corresponding KEGG pathway.
Unsupervised 2-way hierarchical cluster of the cancer samples according to mutation status of key gene (KEY_GENE),
cancer gene (CANCER_GENE), high variable gene (HVG, MutationRate> 0.05) contained in the pathway genes.
Red indicates mutant. Silent mutations are removed. White indicates wild. Genes colored by the seven gene categories.
Different categories are separated by white gap. Corresponding number of mutations per sample are plotted on the right.
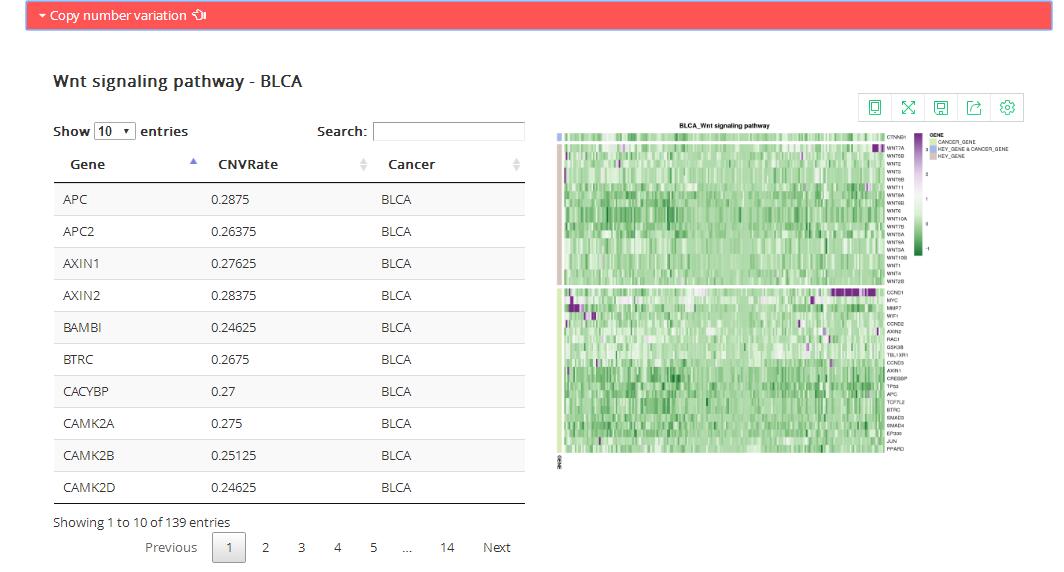
Copy number variation: copy number of genes in corresponding KEGG pathway
Table: the table shows copy number variation rate of all genes in corresponding KEGG pathway.
Gene: Pathway genes in corresponding KEGG pathway
CNVRate: The copy number variation frequency in the TCGA cancer samples from GISTIC2.0
Cancer: Corresponding TCGA cancer type
Figure: the map shows specific genes copy number in corresponding KEGG pathway.
Unsupervised 2-way hierarchical cluster of the cancer samples according to copy number level of key gene (KEY_GENE),
cancer gene (CANCER_GENE), high variable gene (HVG, CNVRate > 0.3) contained in the pathway genes.
Genes colored by the gene categories.
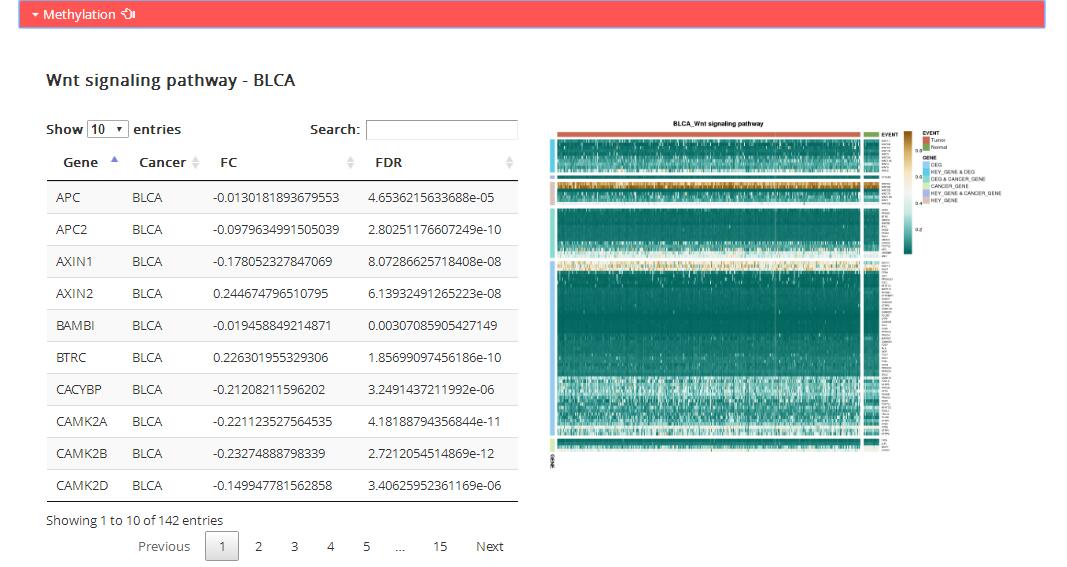
Methylation: DNA methylation level of genes in corresponding KEGG pathway
Table: the table shows dfferential methylation level of all genes in corresponding KEGG pathway.
Gene: Pathway genes in corresponding KEGG pathway
Cancer: Corresponding TCGA cancer type
FC: Differential methylation level calculated by ChAMP
FDR: The statistically significant differences in DNA methylation level between tumor and normal samples calculated by ChAMP
Figure: the map shows specific genes methylation level in corresponding KEGG pathway.
Unsupervised 2-way hierarchical cluster of the samples according to methylation level of key gene (KEY_GENE),
cancer gene (CANCER_GENE), differential methylation genes (DMG, FC>0, FDR< 0.0001 according to the R package ChAMP)
contained in the pathway genes.Samples colored by the sample type (Tumor: red; Normal: green).
Genes colored by the gene categories.
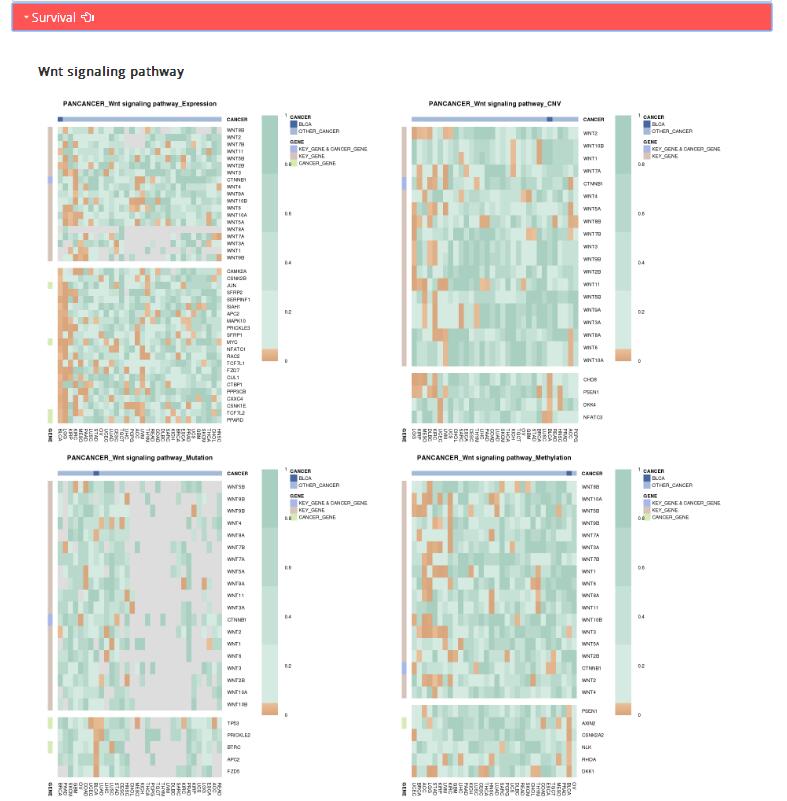
Survival: survival P values of corresponding KEGG pathway genes in TCGA pan-cancers based on four omics data in TCGA: expression data, copy number data, mutation data and methylation data.
Heatmap: the map shows the survival P values of key genes and genes whose survival P values are less than 0.05 in current corresponding TCGA caner.
KEY_GENE: Including key genes in reference and genes showed in pathway name
CANCER_GENE: Cancer-related genes in corresponding KEGG pathway
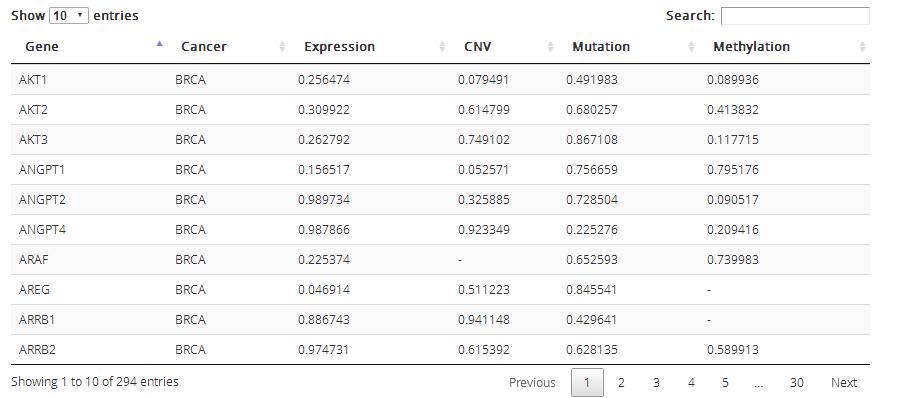
Table: the table shows survival P values of all genes in corresponding KEGG pathway based on four omics data in TCGA: expression data, copy number data, mutation data and methylation data.
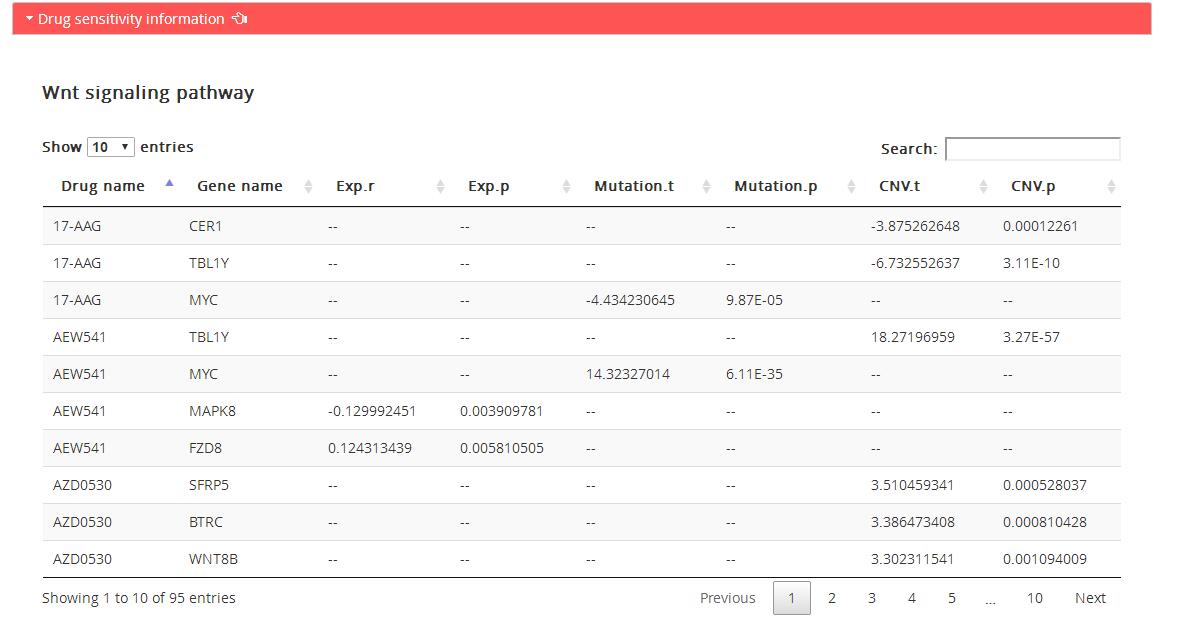
Drug sensitivity information: genes associated with drug sensitivity in corresponding KEGG pathway based on three omics data: expression data, mutation data and copy number data, and drug sensitivity data in CellMiner.
Drug name: Drug name
Gene name: Name of genes in corresponding KEGG pathway
Exp.r: Pearson correlation coefficient between gene expression and drug IC50 value across CellMiner cell lines
Exp.p: P value of pearson correlation coefficient between gene expression and drug IC50 value
Mutation.t: Statistic of t-test of drug sensitivity data (IC50 value) between gene mutation cell line group and gene wild type cell line group.
Mutation.p: P value of t-test of drug sensitivity between gene mutation cell line group and gene wild type cell line group.
CNV.t: Statistic of t-test of drug sensitivity between gene high level copy number variation cell line group and gene low level copy number variation cell line group classified by GISTICv2.
CNV.p: P value of t-test of drug sensitivity between gene high level copy number variation cell line group and gene low level copy number variation cell line group classified by GISTICv2.
Regulator information
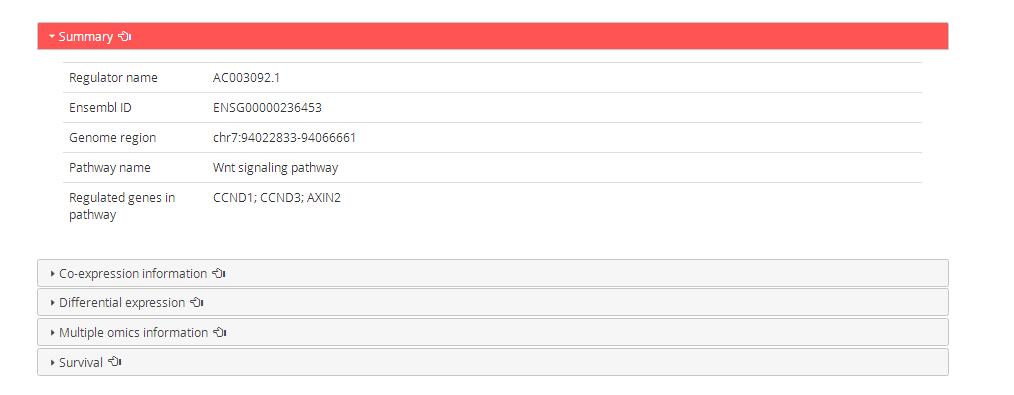
2. The detail information of predicted regulator
2.1 LncRNA/miRNA/TF
2.1.1 Co-expression information
2.1.2 Differential expression
2.1.3 Multiple omics information
2.1.4 Survival
2.2 Drug
In the search/browse result table, click ‘pre’ to explore detailed information of predicted upstream regulators of cancer pathway.
LncRNA/miRNA/TF
Prediction results: Predicted regulators for the cancer pathway and the dysregulated information at four omics level: expression, mutation, copy number and methylation.
Regulator: Regulator name
Pathway: Corresponding KEGG pathway
Enrichment FDR: The P value from gene enrichment analysis based on genes targeted by the regulator and corresponding
pathway genes by using hypergeometric test
Cancer name : Corresponding TCGA cancer type
Exp.FC: A base-2 logarithm to fold changes of the regulator expression between tumor samples and normal samples
Exp.FDR: False discovery rate of t-test of the regulator expression between tumor samples and normal samples
Mut.Rate: The mutation frequency of the regulator in the TCGA cancer samples (except the silent)
CNV.Rate: The copy number variation frequency of the regulator in the TCGA cancer samples from GISTIC2.0
Methy.FC: A base-2 logarithm to fold changes of the regulator methylation between tumor samples and normal samples
Methy.FDR: False discovery rate of t-test of the regulator methylation between tumor samples and normal samples
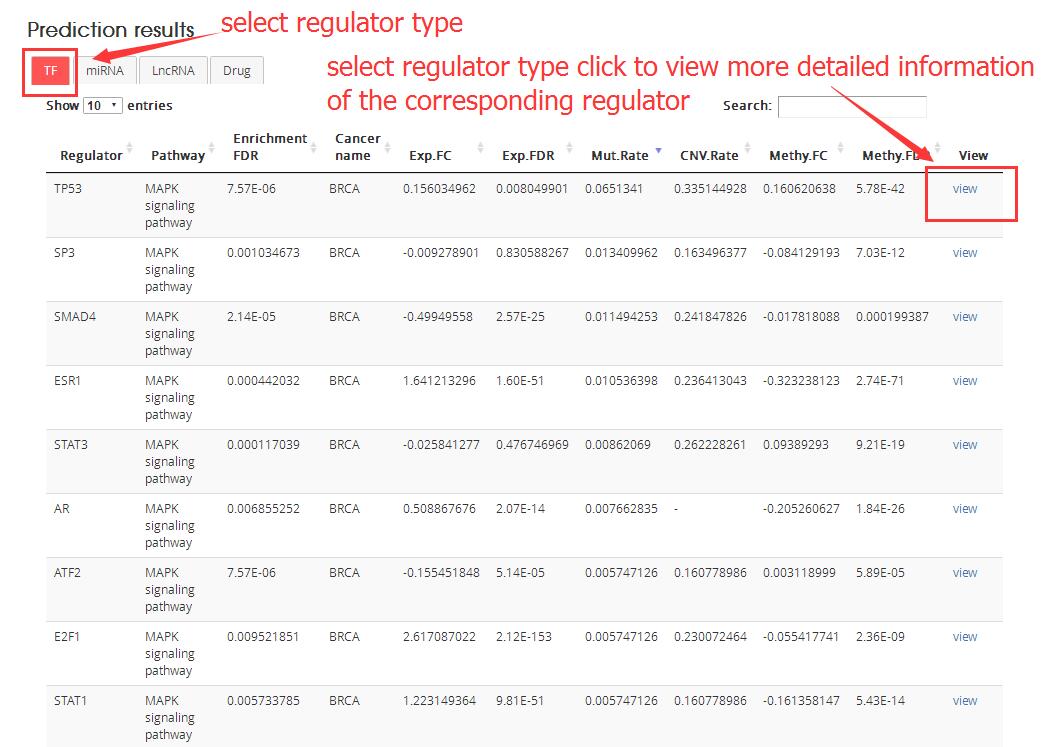
The detailed information of regulator after click ‘view’ as follows:
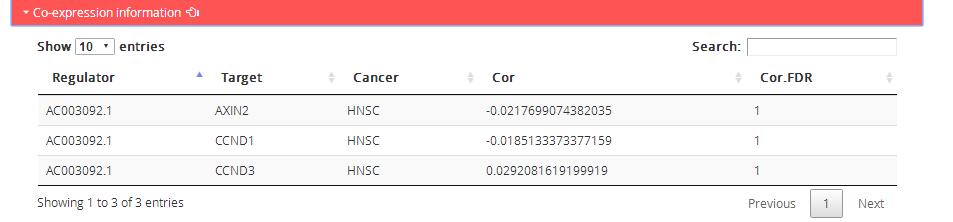
Co-expression information: Correlative expression of regulators and target genes in cancer pathway
Regulator: Regulator name
Target: Target genes in corresponding KEGG pathway
Cancer: Corresponding TCGA cancer type
Cor: Pearson correlation coefficient between regulator and target expression
Cor.FDR: P value of pearson correlation coefficient between regulator and target expression
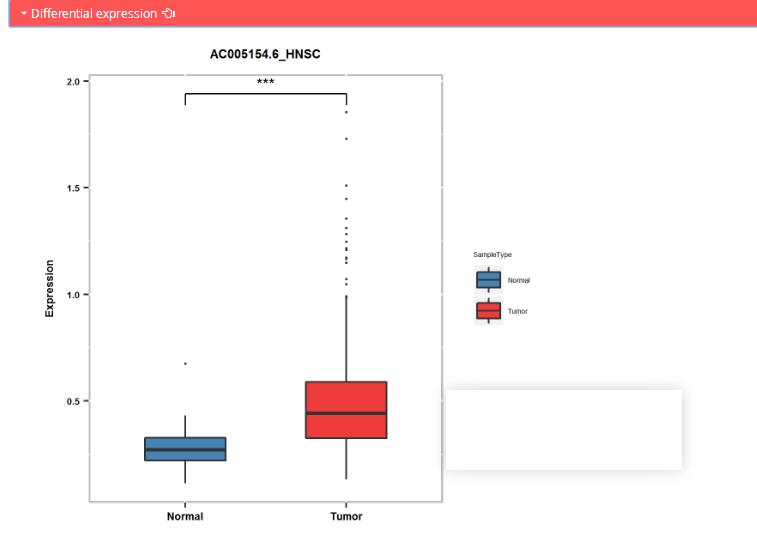
Differential expression: differential expression of regulator between normal and tumor samples in TCGA. * p < 0.05, **p < 0.01, and ***p < 0.001; Statistical analyses were by t-test
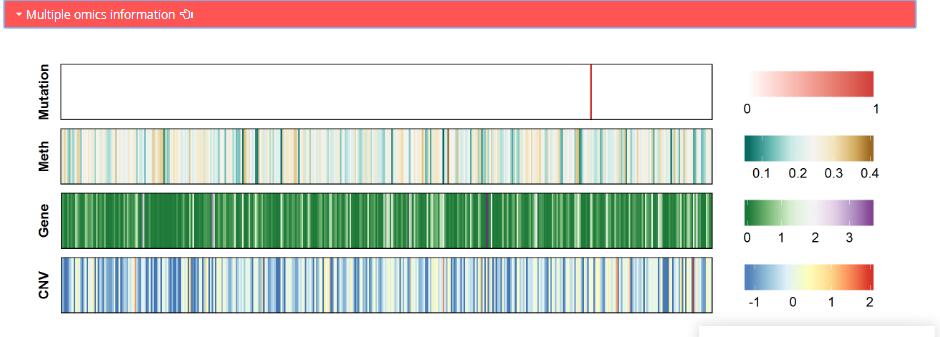
Multiple omics information: Multi-omic landsape of regulator in TCGA cancer samples
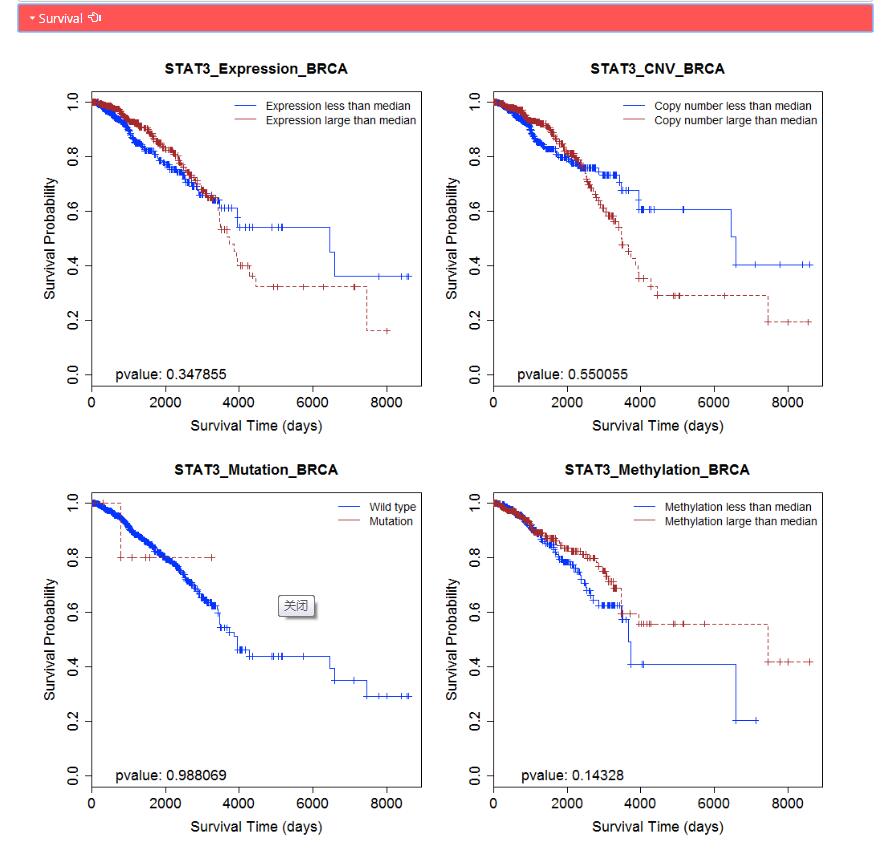
Survival: The Kaplan–Meier curves of regulator based based on four omics data in corresponding TCGA cancer: expression, mutation, copy number and methylation data.
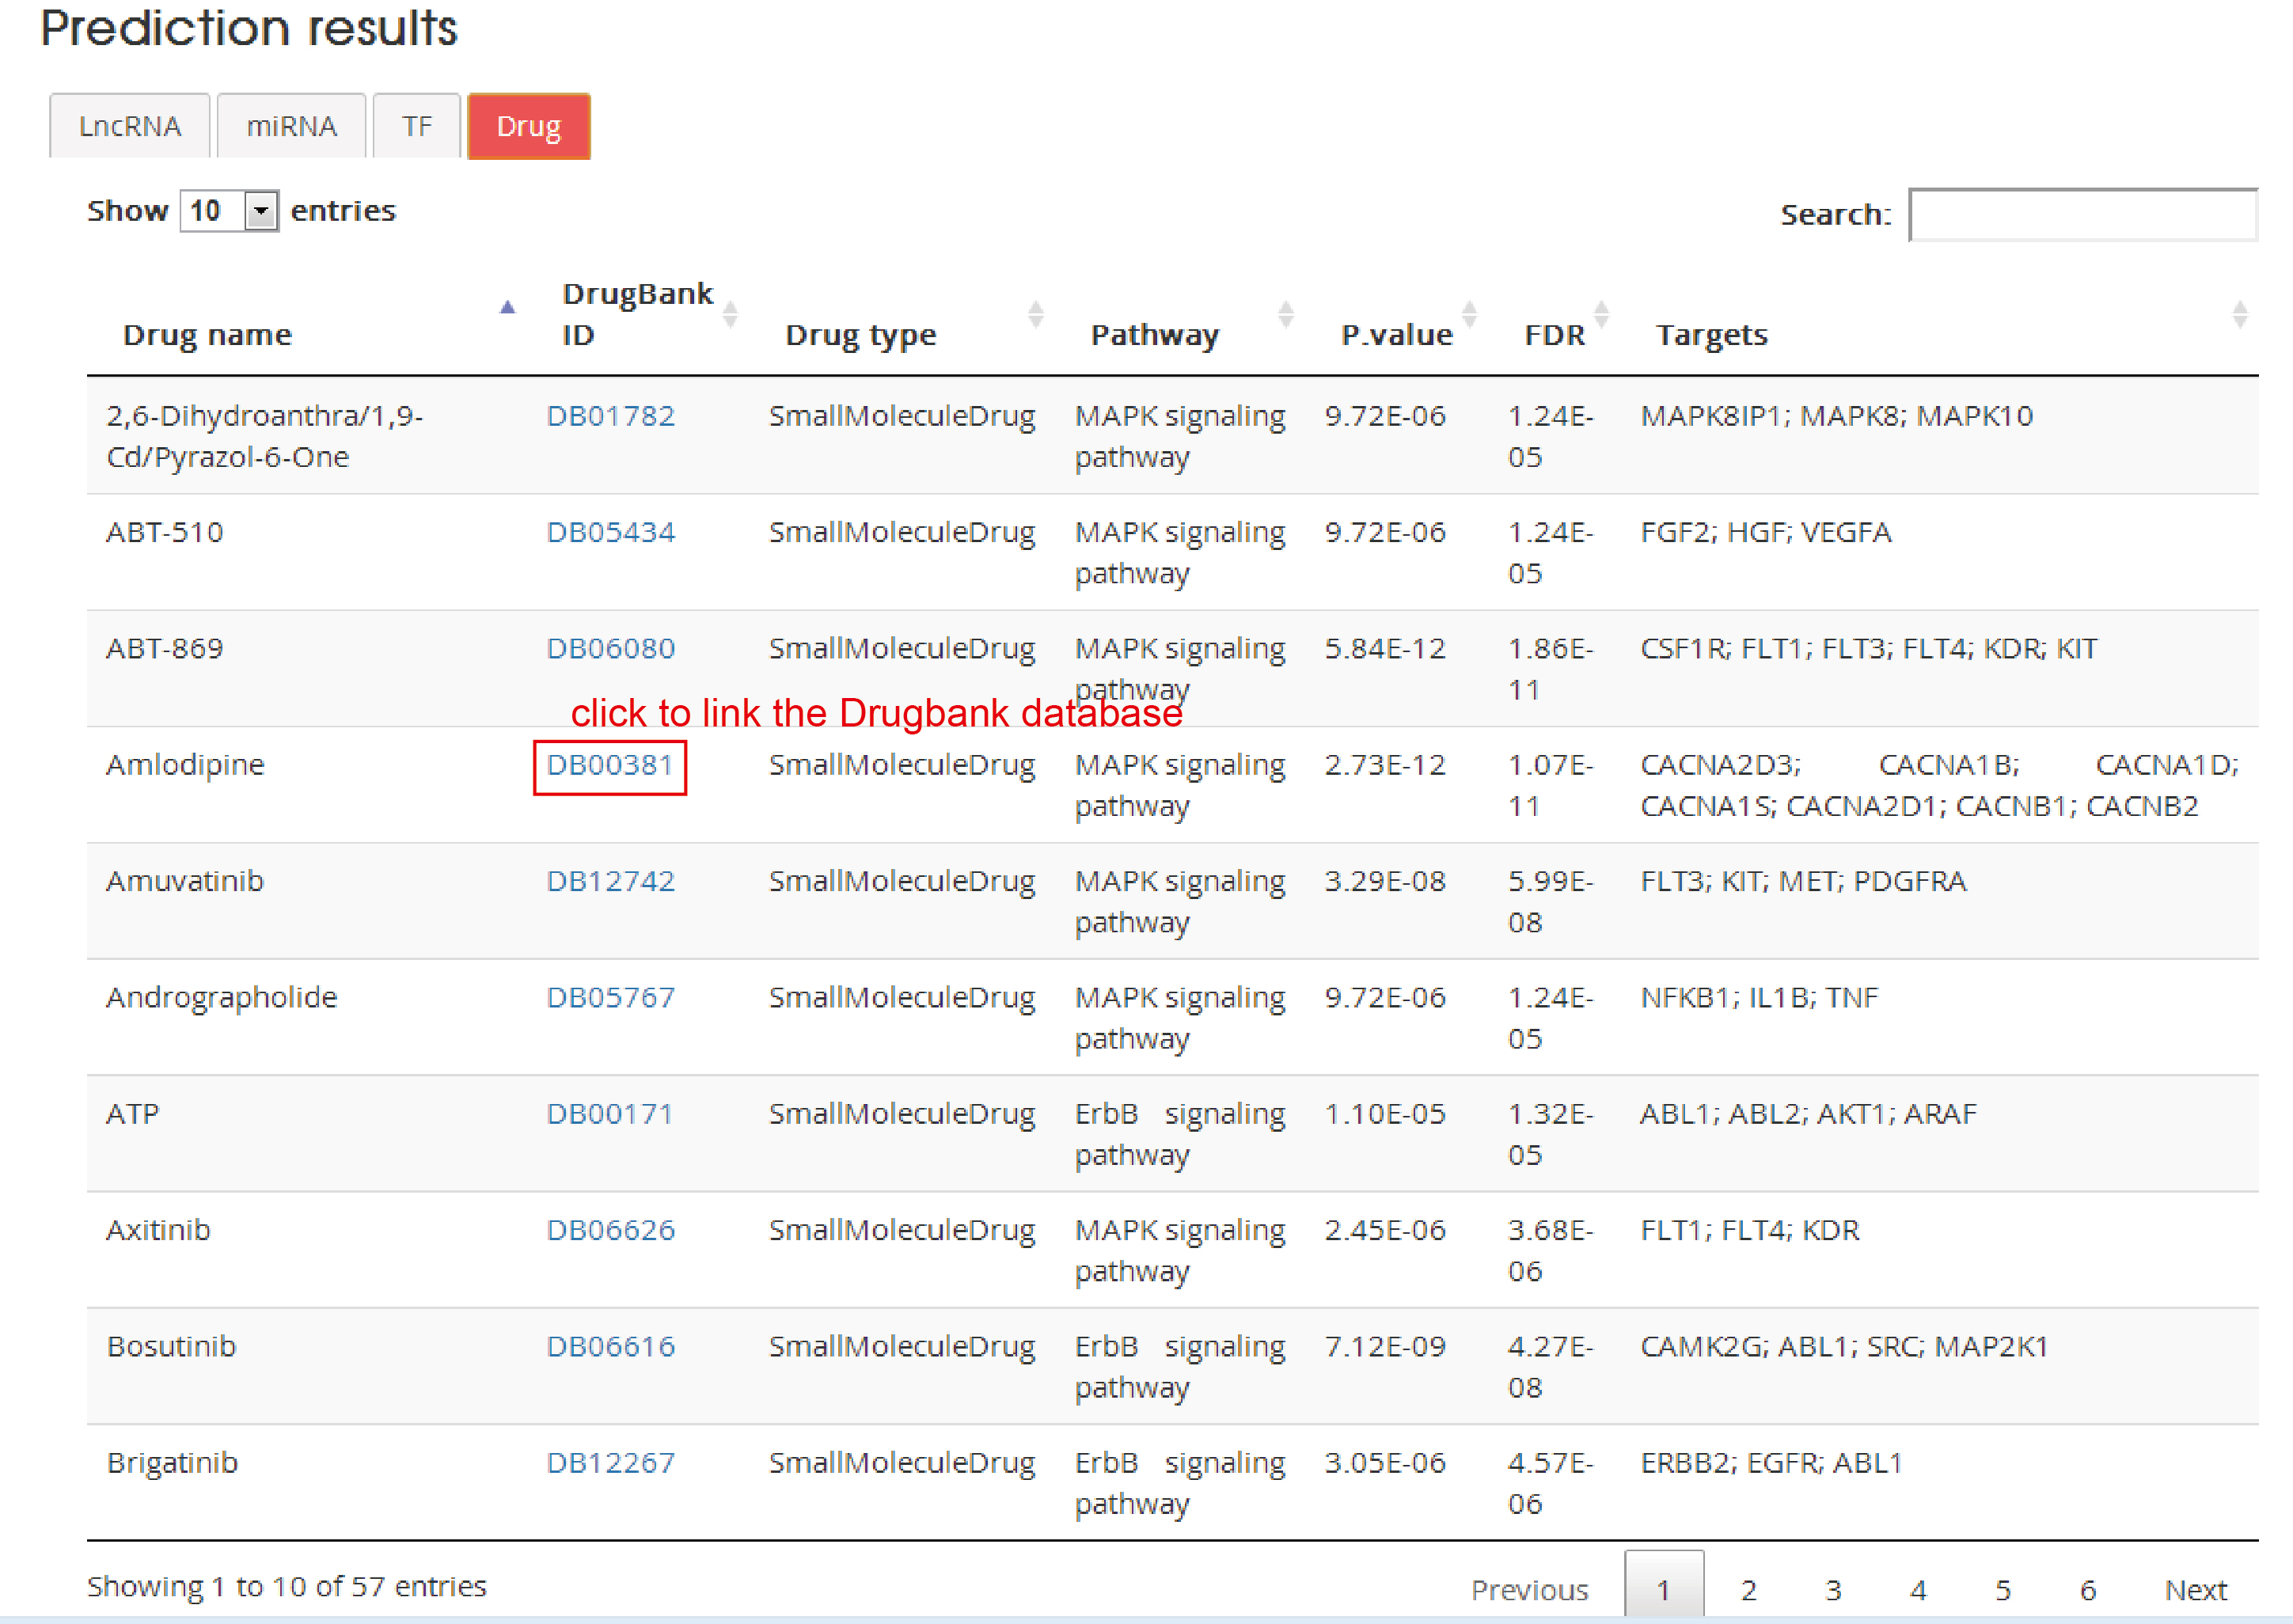
Drug
Drug name: Drug name
DrugBank ID: DrugBank accession number, click to link with Drugbank database
Drug type: Corresponding drug type according to DrugBank
Pathway : Corresponding KEGG pathway
P.value: The P value from gene enrichment analysis based on drug targets and corresponding pathway genes by using hypergeometric test
FDR: Corrected p value
Targets: Drug targets from DrugBank
Download help
The manually curated associations between human cancers and biological pathways can be downloaded
Submit new information
There is a submission page that allows researchist to submit newly experimentally supported cancer-pathway associations. Once approved by the submission review committee, the information will enter CPAD database and be available to the public in the update release. We sincerely appreciate your contribution.