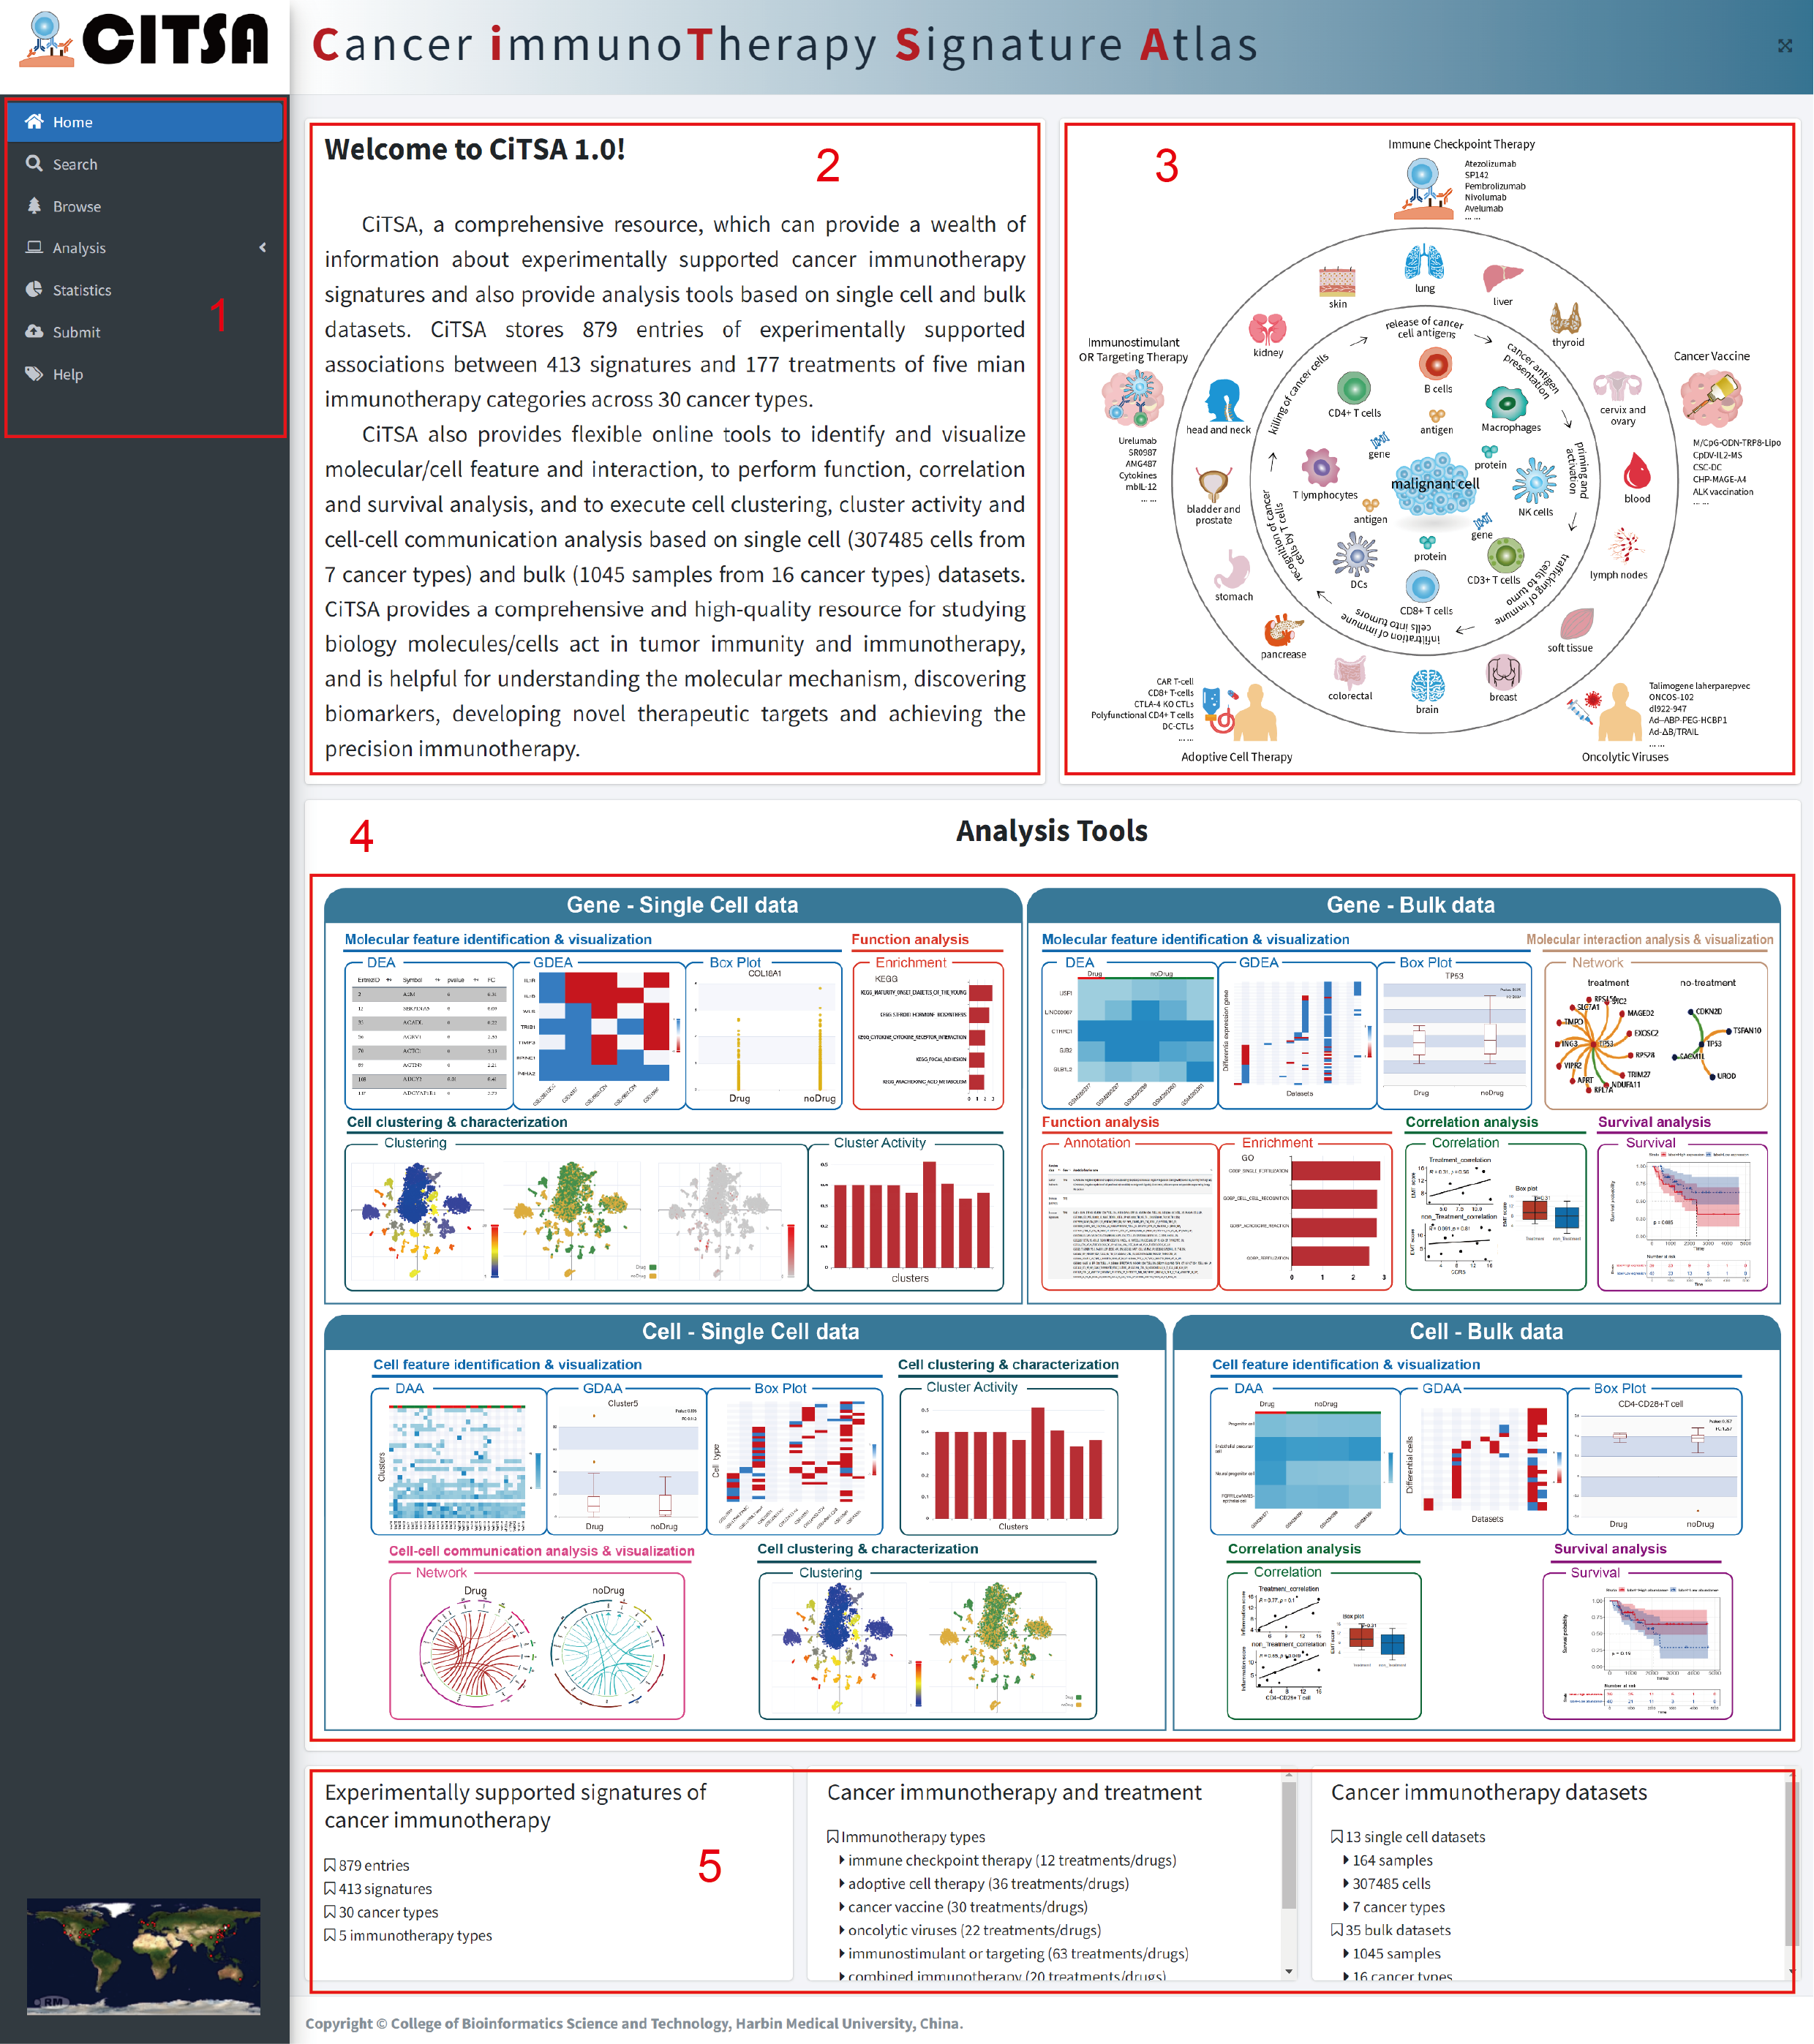
The Home page is displayed in Figure 1-1:
1.Main functions of the database are provided in menu bar form (boxed in red).
2.The brief introduction of CiTSA.
3. Graphic abstract for CiTSA.
4. The analysis tools in CiTSA.
5. Data information in CiTSA.
CiTSA provides comprehensive experimentally supported associations between genes/cells/proteins, etc.
and immunotherapy for human cancers. CiTSA provides users with a simple and fast method to search and
explore all our data in several ways. CiTSA enables users to search by gene/cell name, cancer name or
types of cancer immunotherapy. CiTSA also offers fuzzy keyword searching capabilities, which enables
easy searching by returning the closest possible matching records The Search page is displayed in Figure 2-1.
1. Input your interested cancer name, similar drop-down options will be generated as input.
2. Input the name of you interested gene/cell type.
3. Select your interested immunotherapy type from the pull-down list.
4.Click“submit”to start your search, click“Reset”to retype search options.
5. Usage example, users can click the “Bladder Cancer”, “CD274” or “CD4-CD28+ T cell” as an example to start your search.
6. Quick search can be started by click the name of cancer type (subtype) in blue color.
7. Statistic the distribution of cancer immunotherapy related gene/cell signatures.

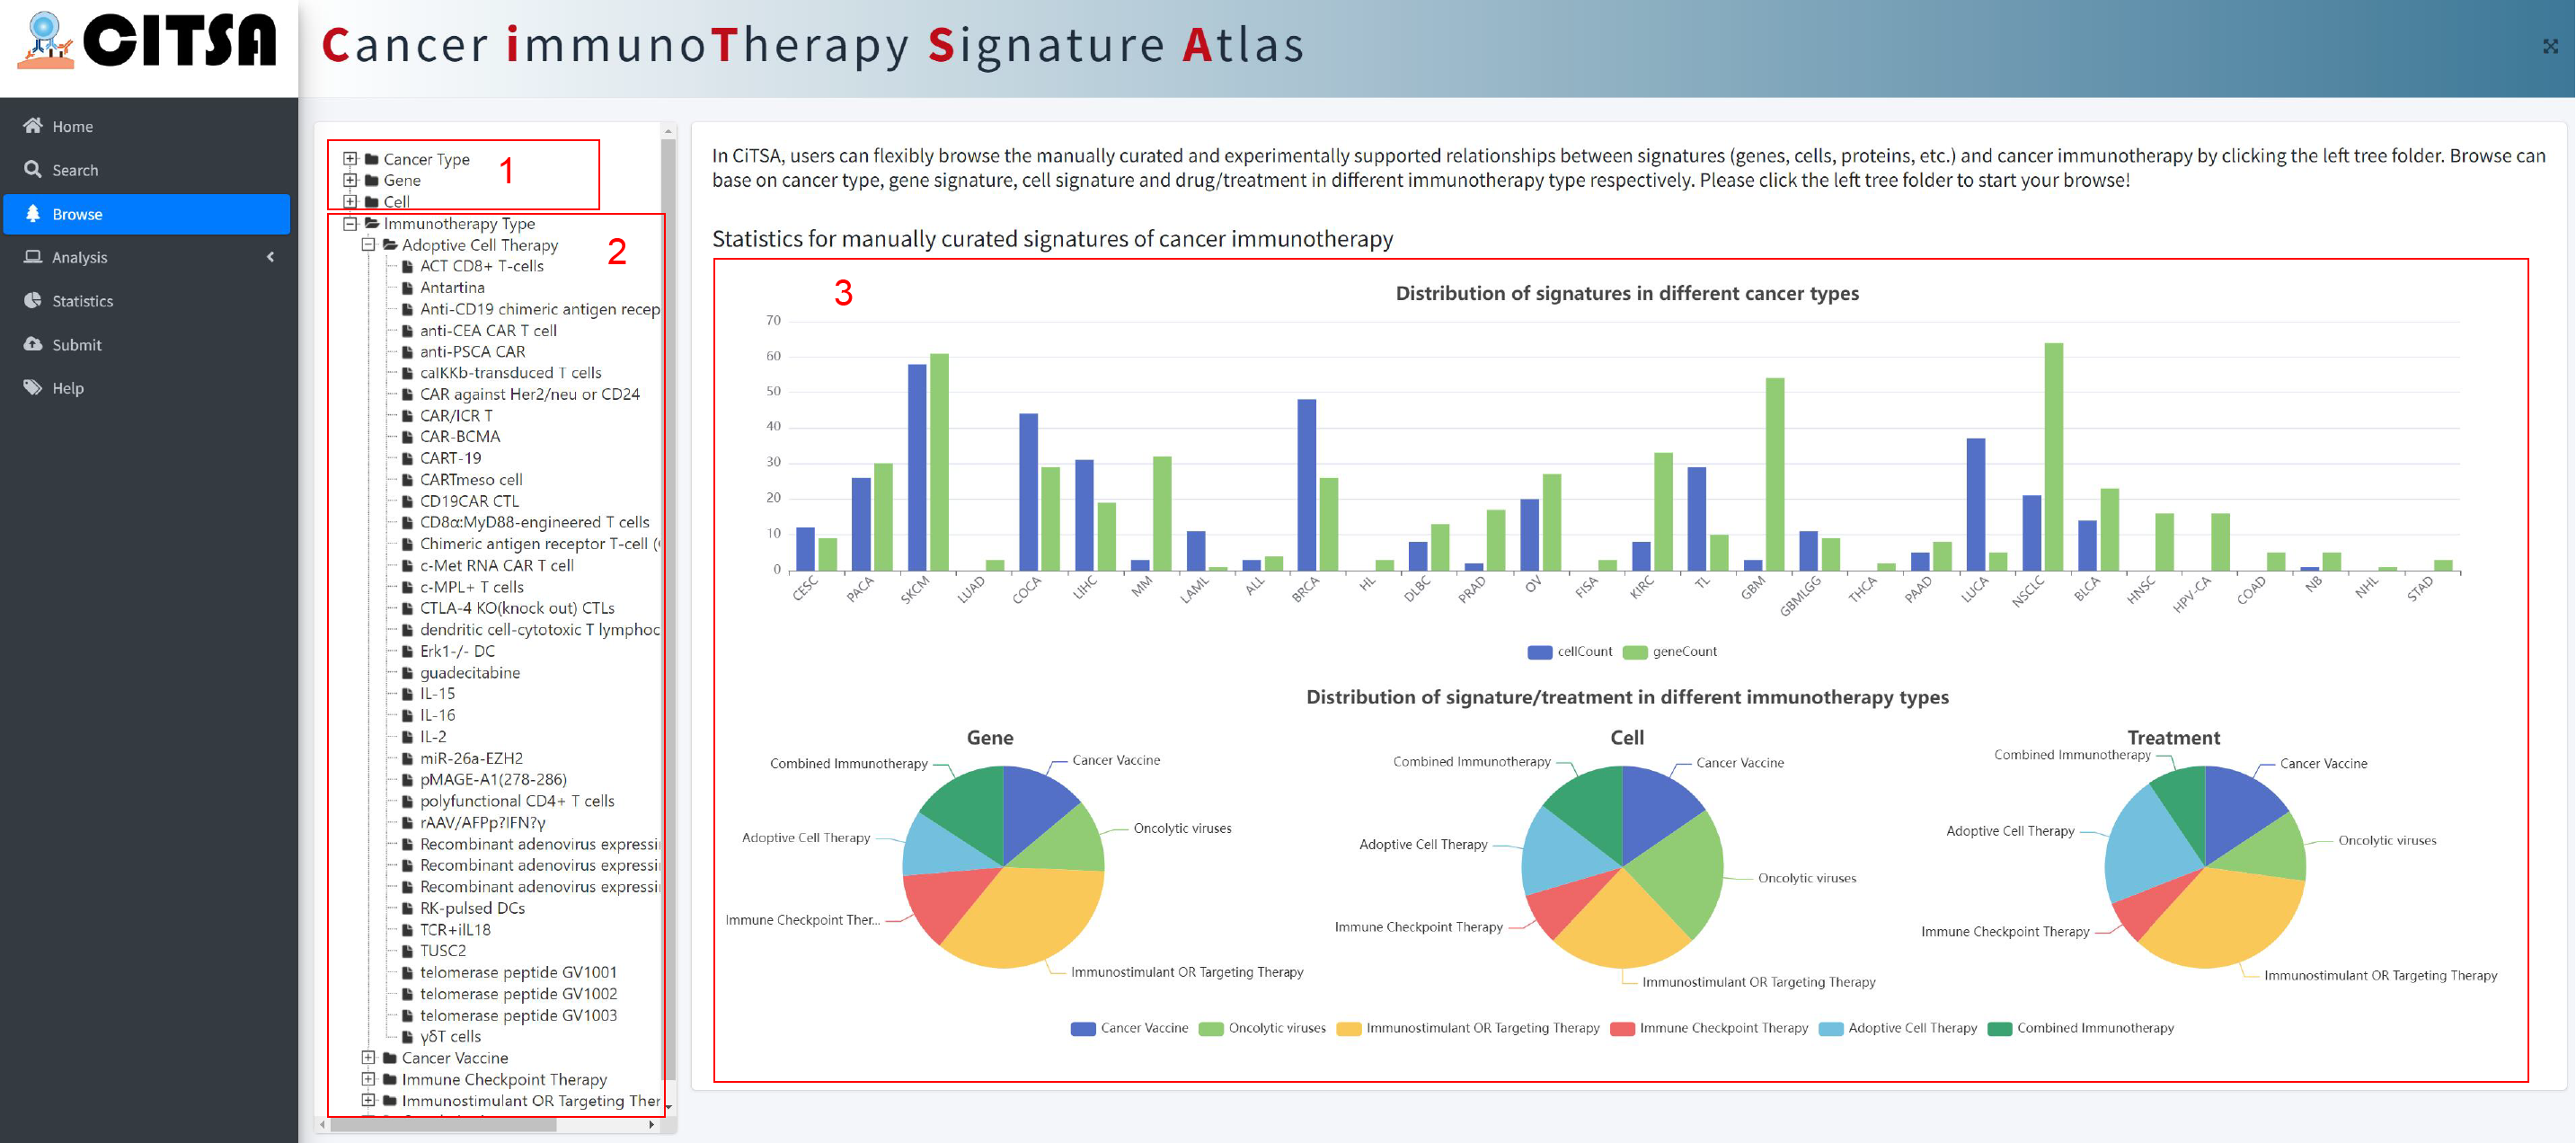
In CiTSA, users can flexibly browse the manually curated and experimentally supported relationships
between signatures (genes, cells, etc.) and cancer immunotherapy by clicking the left tree
folder. Browse can base on cancer type, gene signature, cell signature and drug/treatment in
different immunotherapy type respectively.
1. Click the tree folder to browse the corresponding experimentally supported associations according
to different Cancer Types, Gene or Cell Type, respectively.
2. Click to browse the associations according to drug/treatment in the corresponding immunotherapy type.
3. Statistics for manually curated signatures of cancer immunotherapy.
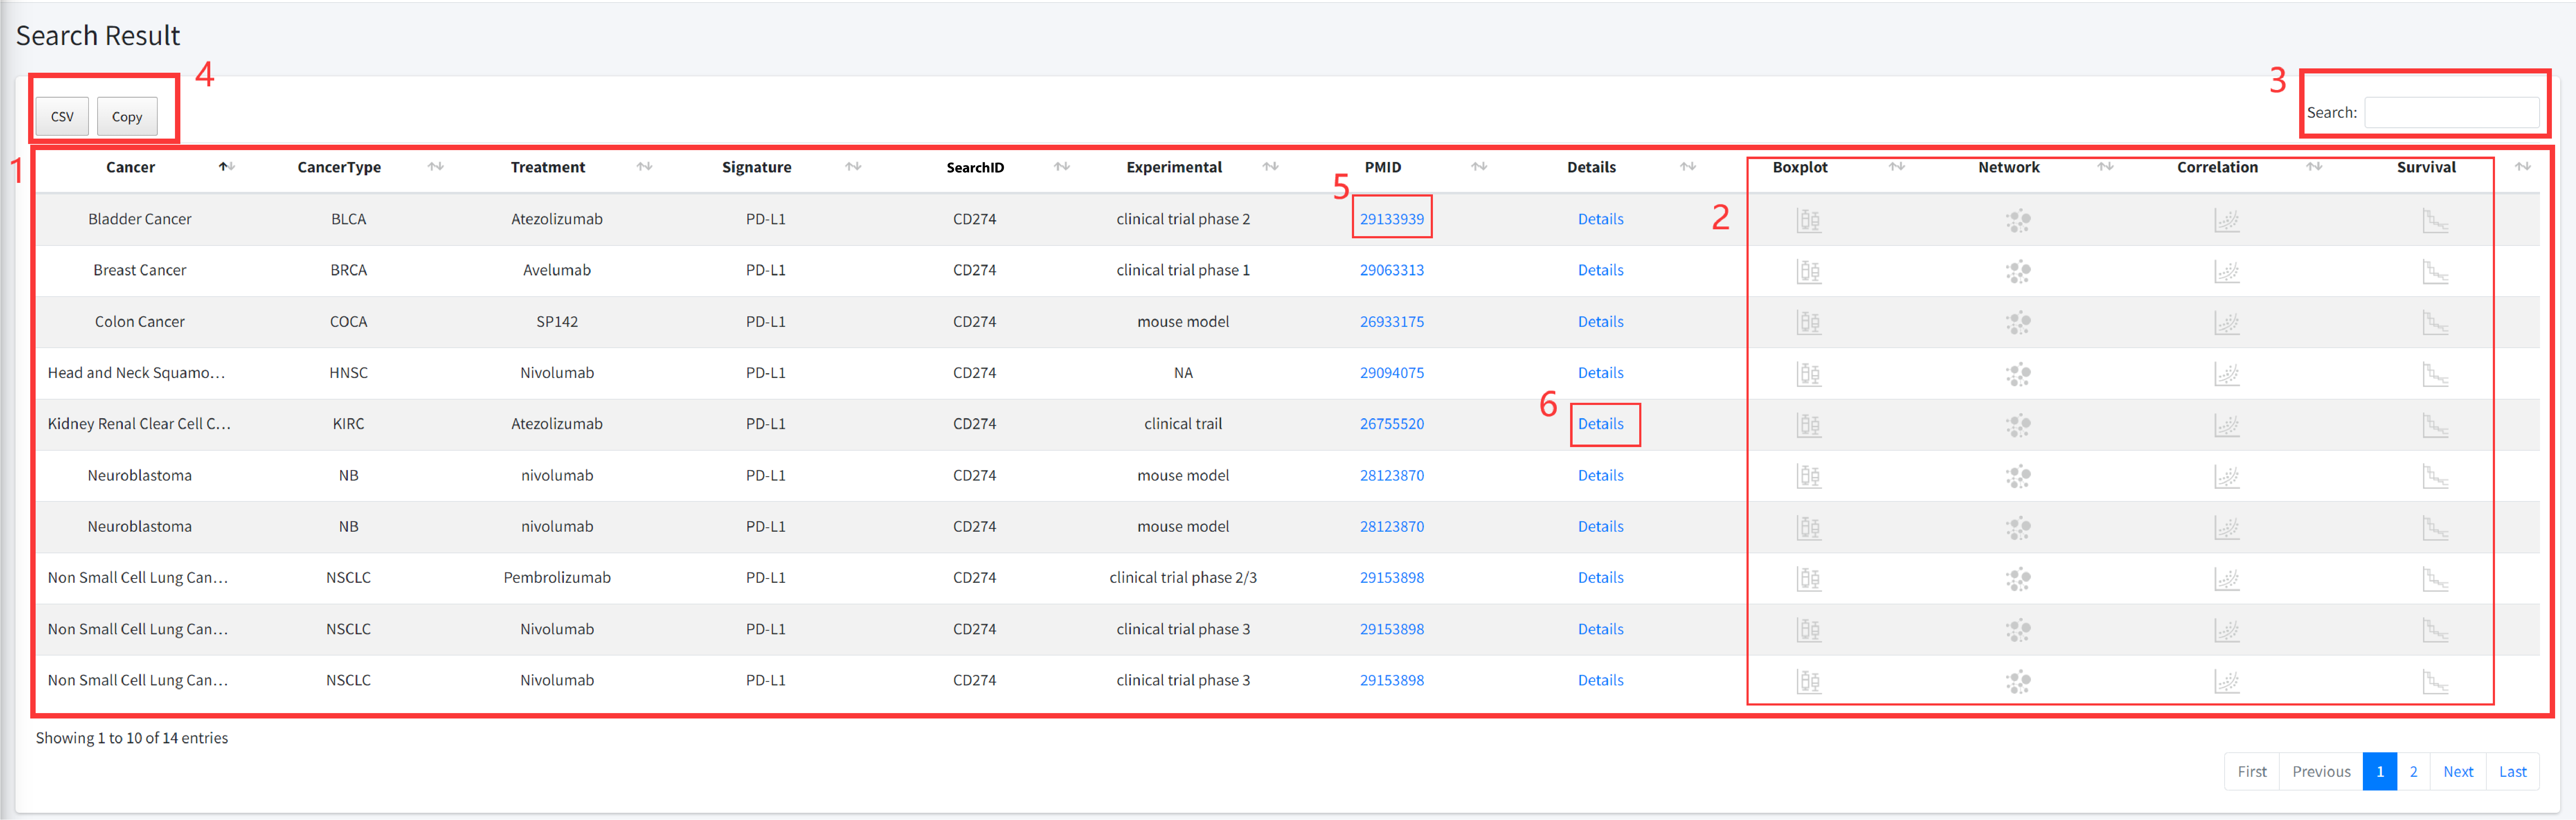
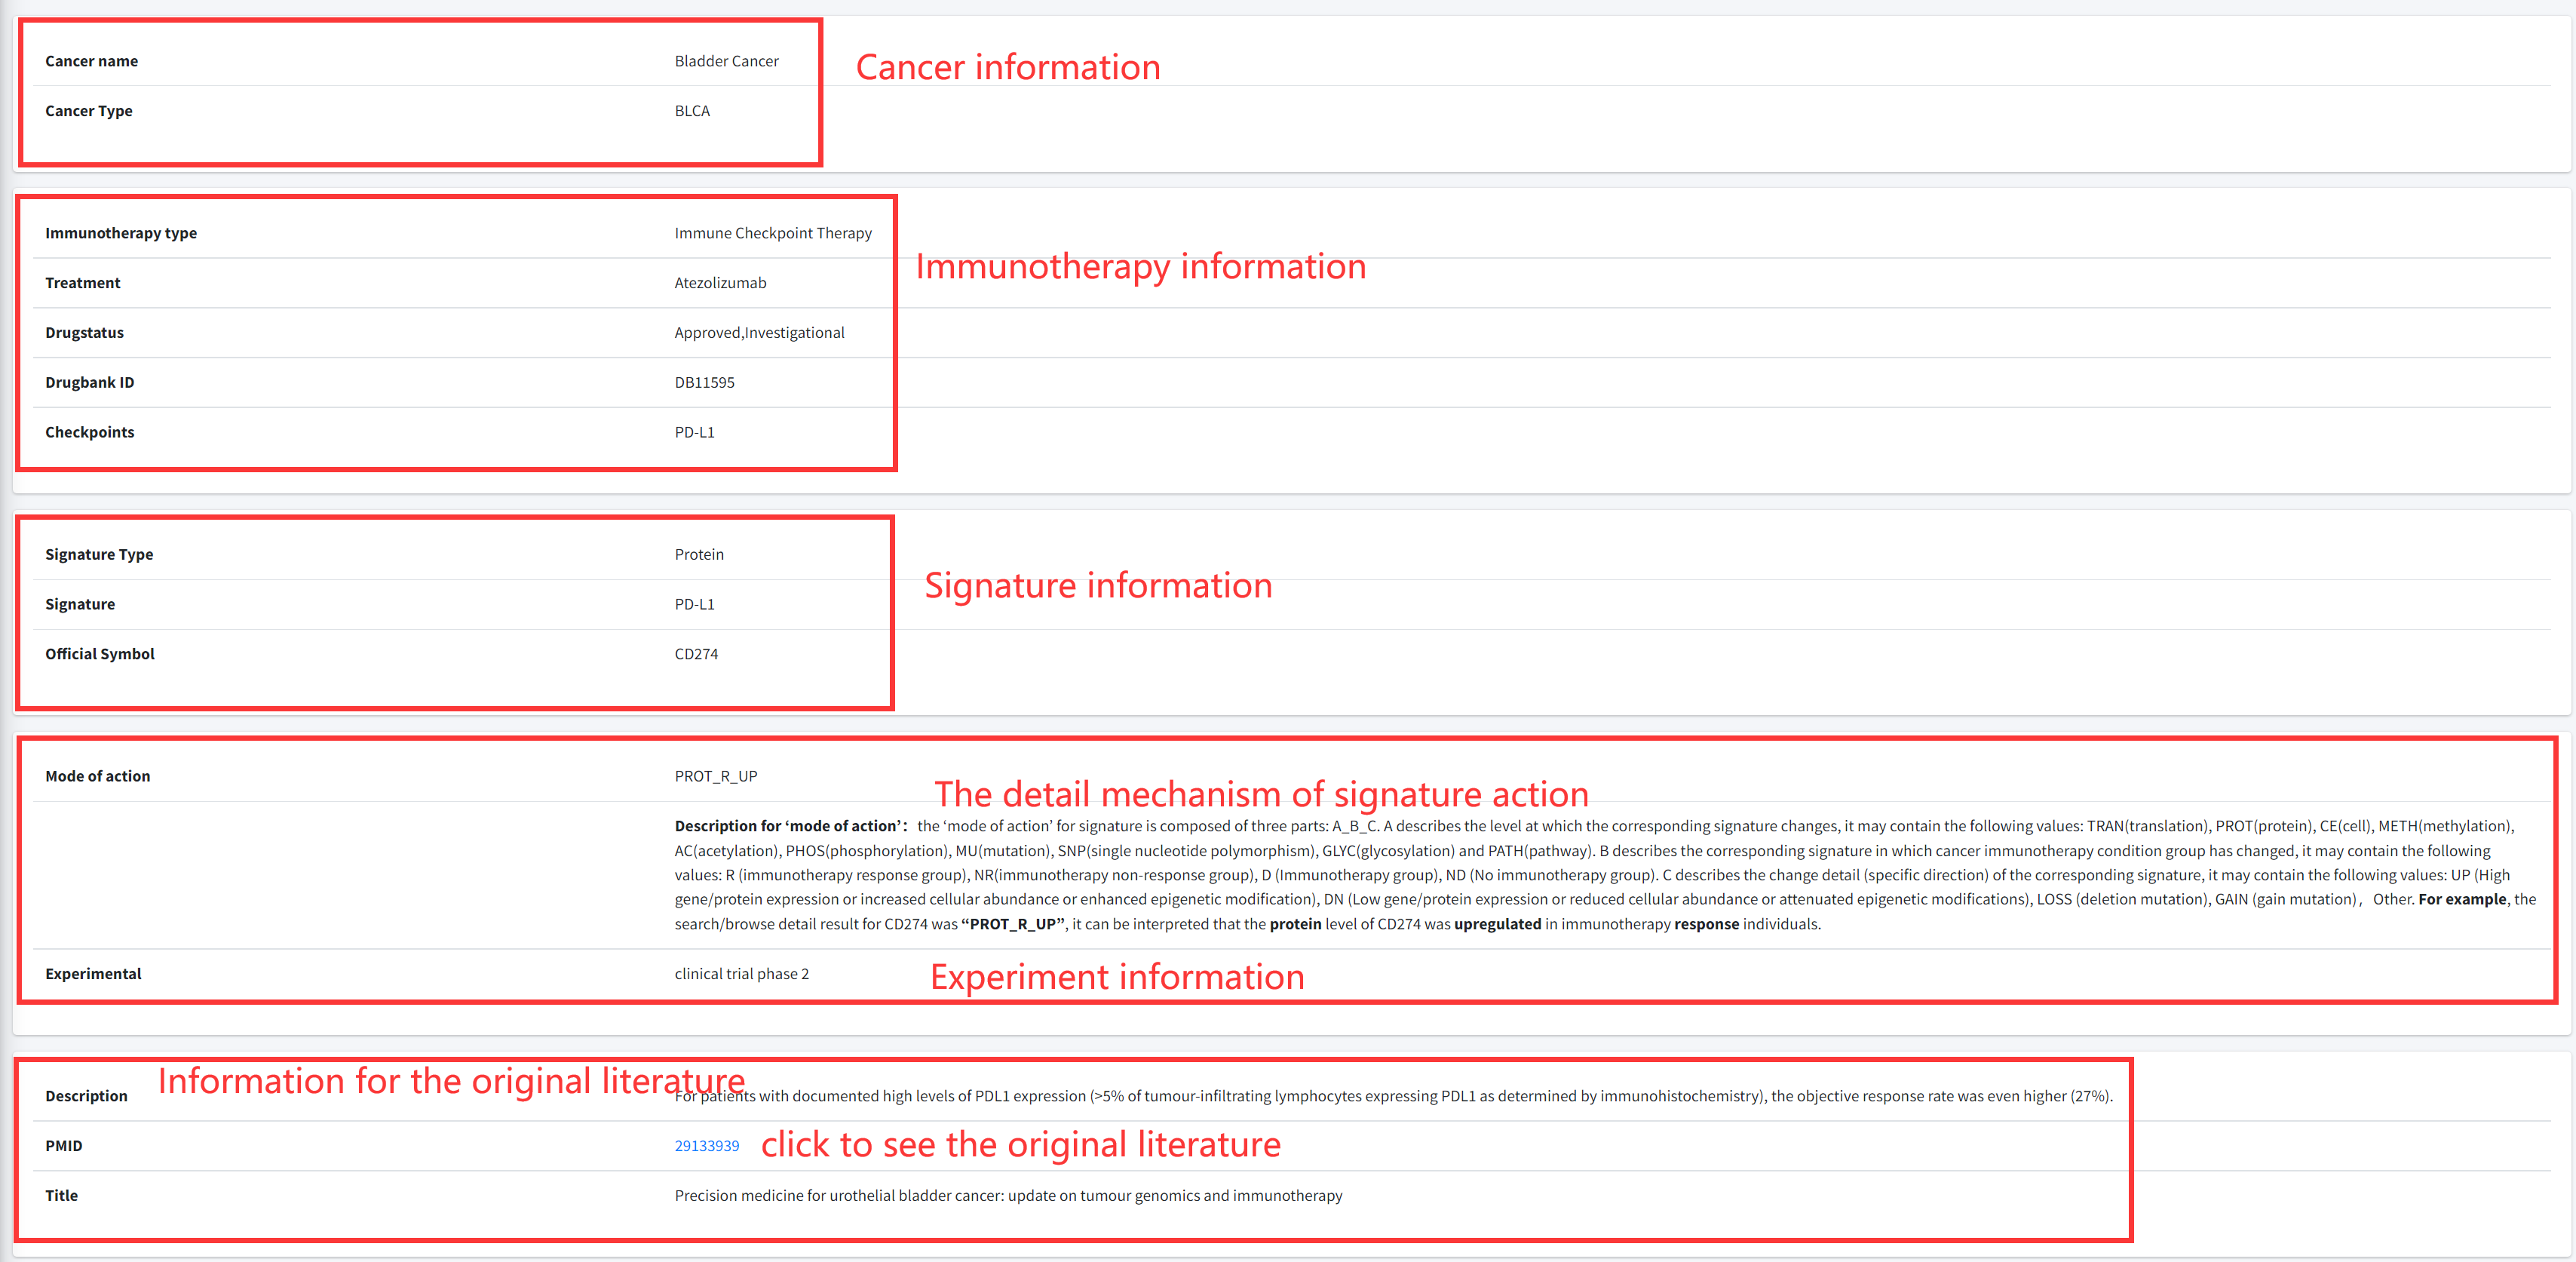
CiTSA results are organized in a data table, with a single association record on each line that
contains cancer full name, cancerType, Treatment, Influencer, Influencer ID, Experimental, PMID
and Detail (see Figure 4-1).
1. Result for your search.
Cancer: cancer full name.
CancerType: TCGA abbreviated cancer name.
Treatment: the immunotherapy drug/treatment method.
Signature: cell or biomolecule that associated with immunotherapy of the cancer.
SearchID: cell or gene entrize ID.
PMID: the PubMed ID of reference literature.
Detail: Clickable links for accessing the detail information of each association. After clicking
the links, the details of the association will be displayed (see Figure 4-2).
2. Click to perform multiple analysis functions.
3. Users can input keywords from any column to filter the results.
4. Click to download data.
5. Click to check the literature of the entry.
6. Click to check the detail information of the entry (see Figure 4-2).
Gene-Bulk data analysis tool
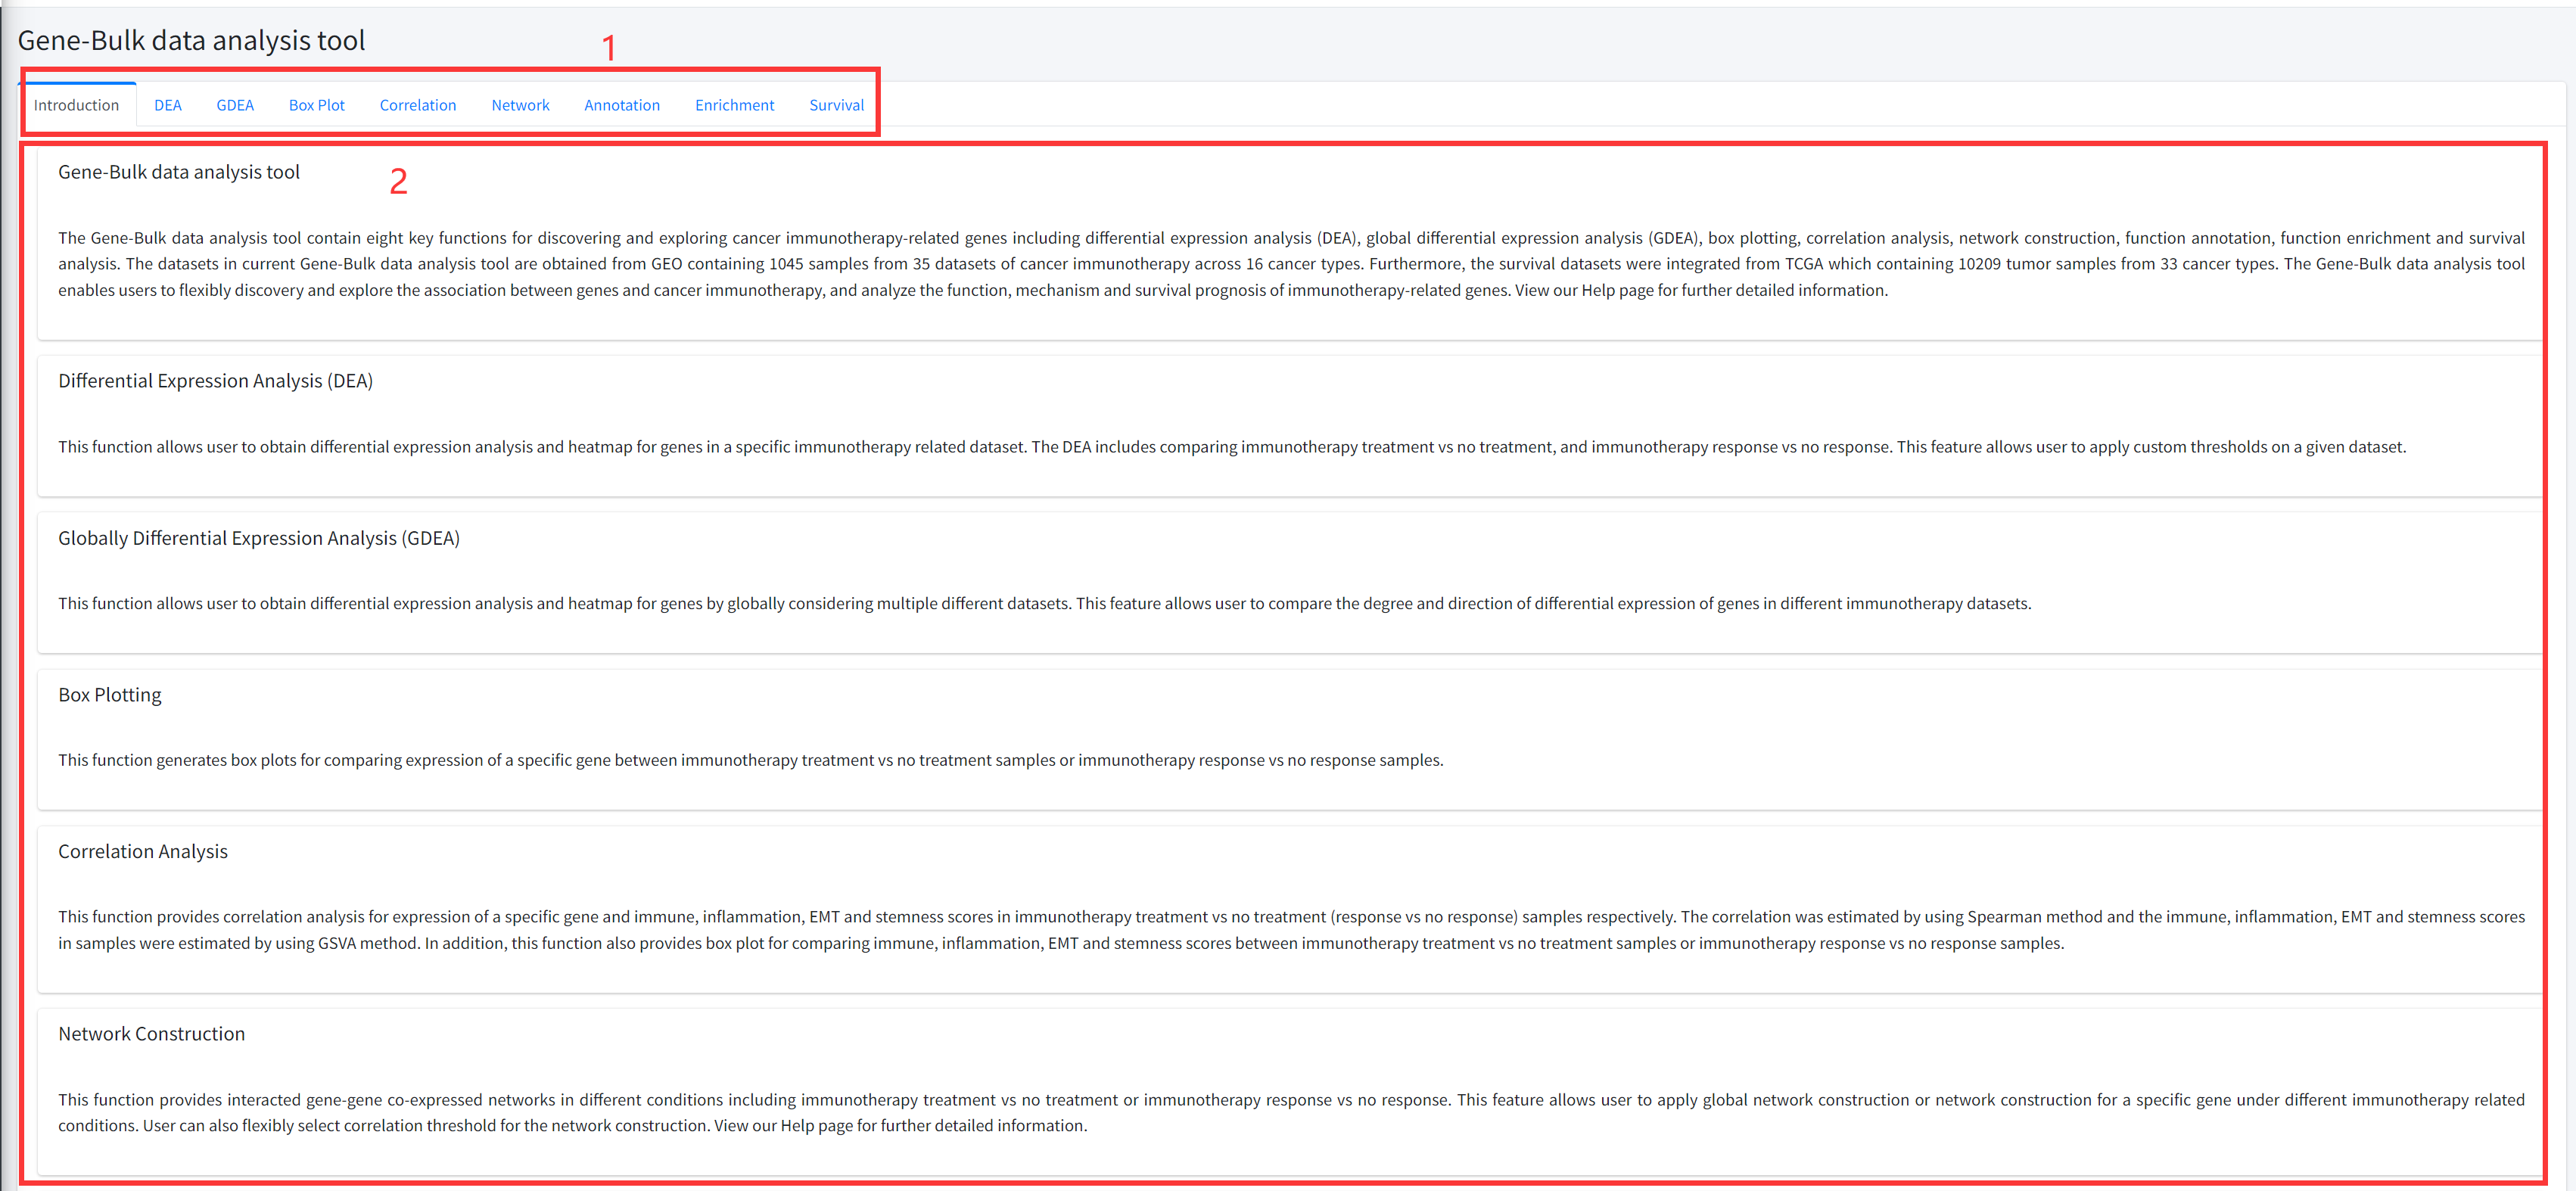
The Gene-Bulk data analysis tool contains eight key functions for discovering and exploring cancer immunotherapy-related genes including differential expression analysis (DEA), global differential expression analysis (GDEA), box plotting, correlation analysis, network construction, function annotation, function enrichment and survival analysis. The datasets in current Gene-Bulk data analysis tool are obtained from GEO containing 1045 samples from 35 datasets of cancer immunotherapy across 16 cancer types. Furthermore, the survival datasets were integrated from TCGA which containing 10209 tumor samples from 33 cancer types. The Gene-Bulk data analysis tool enables users to flexibly discovery and explore the association between genes and cancer immunotherapy, and analyze the function, mechanism and survival prognosis of immunotherapy-related genes. View our Help page for further detailed information.
Introduction
Detailed information of the Gene-Bulk data analysis tool contains eight key functions
for discovering and exploring cancer immunotherapy-related genes based on bulk datasets
is displayed in Figure 5-1:
1. Main functions of the Gene-Bulk data analysis tool are provided in menu bar form (boxed in red).
2. Detailed introduction of main functions of Gene-Bulk data analysis tool.
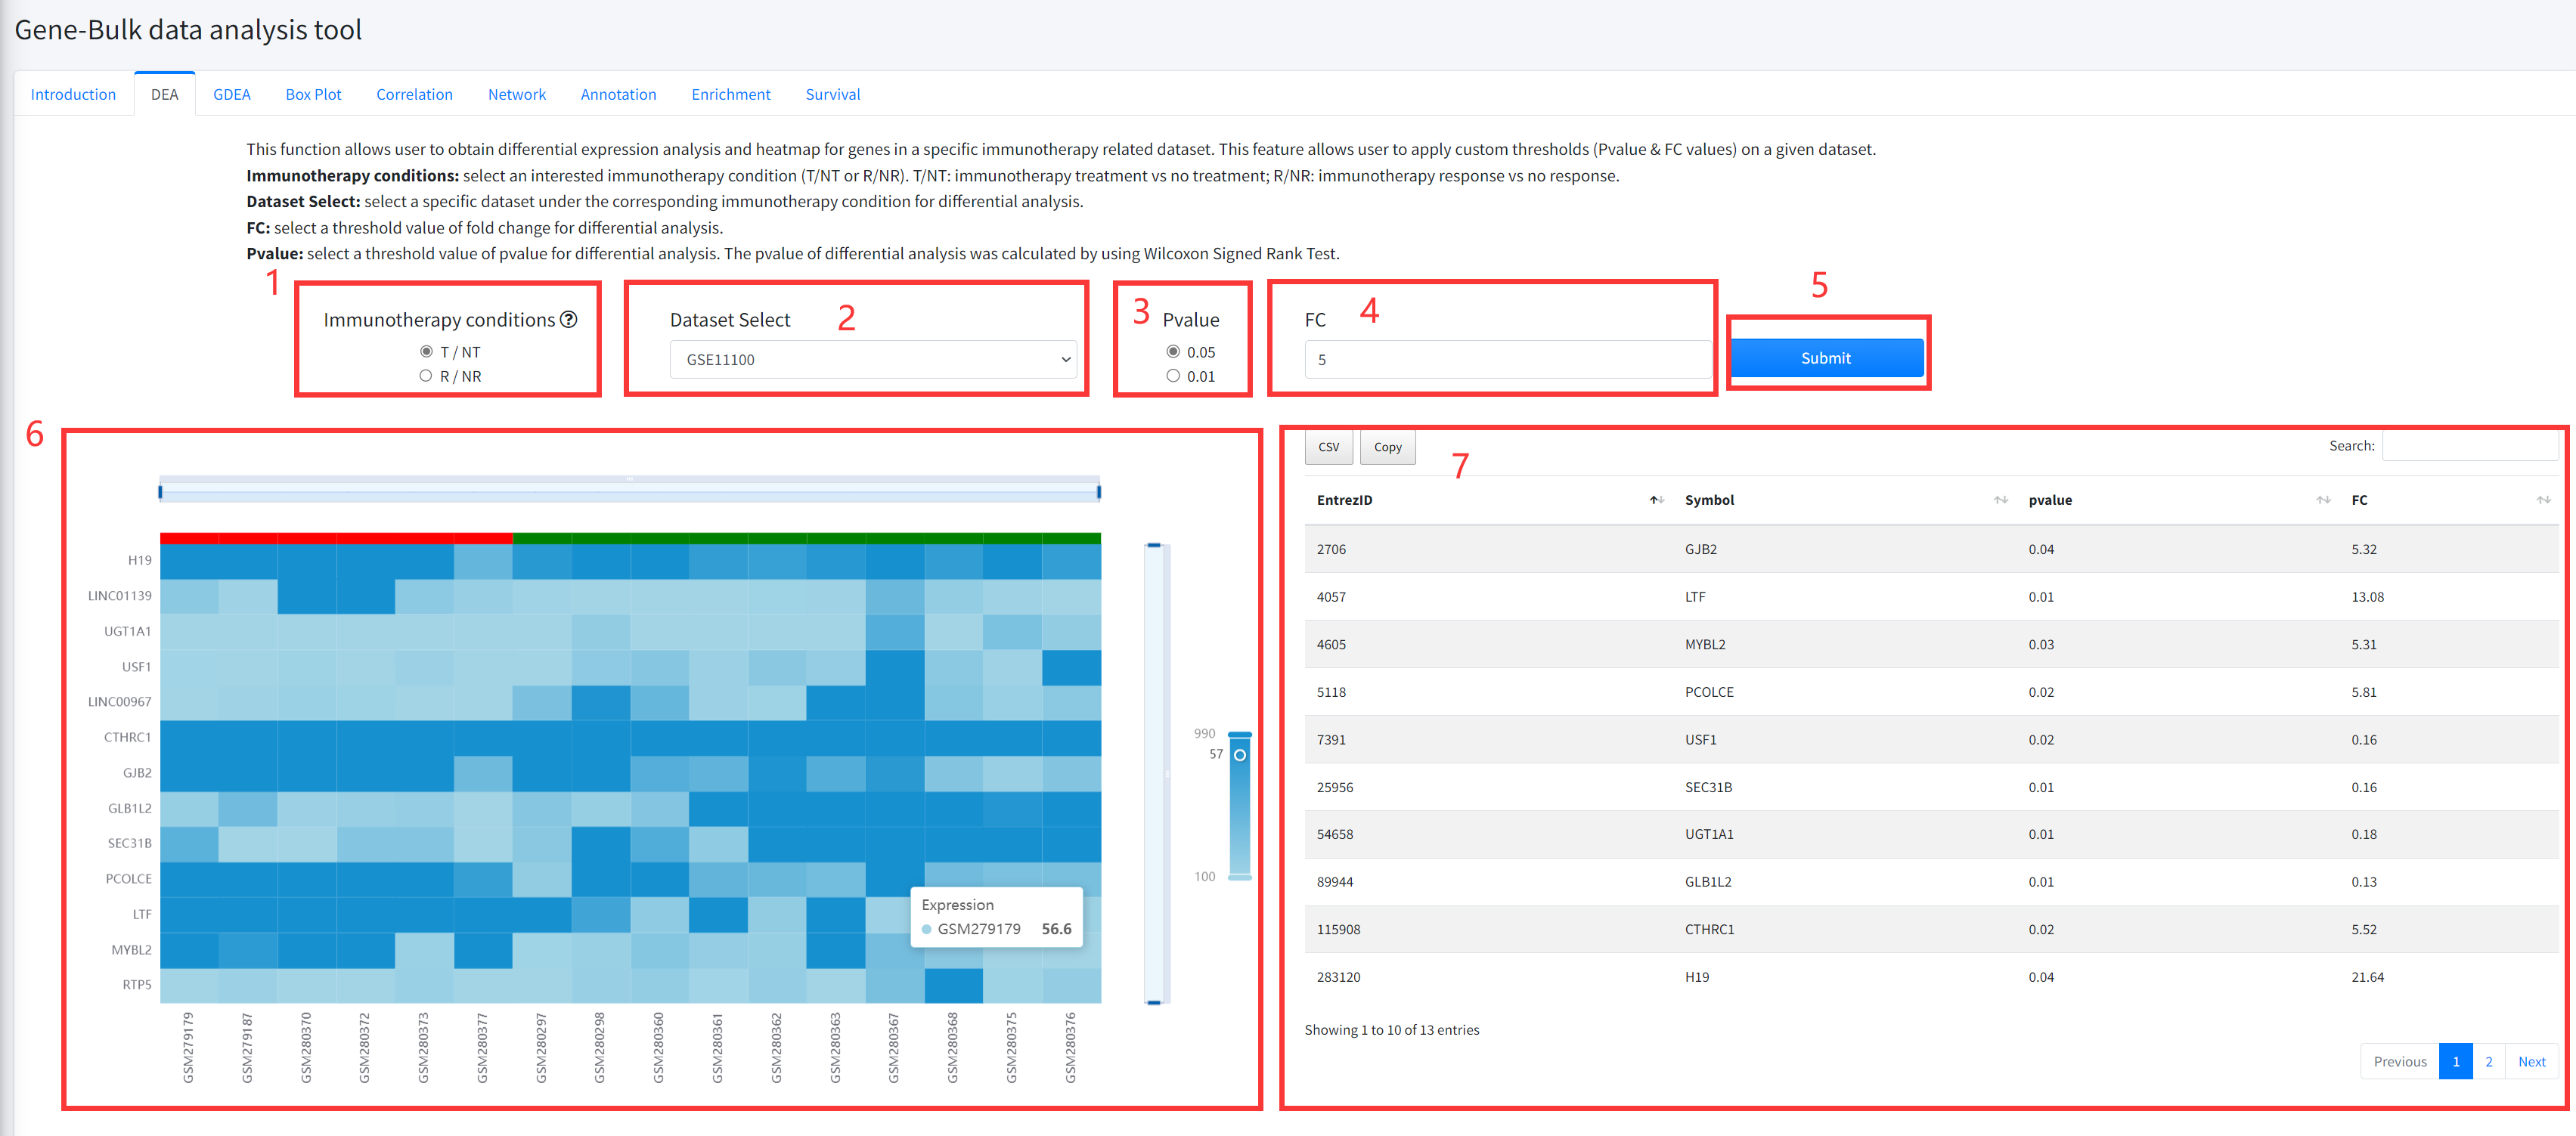
DEA
This function allows user to obtain differential expression analysis and heatmap
for genes in a specific immunotherapy related dataset of cancer is displayed in Figure 5-2.
The DEA includes comparing immunotherapy vs no treatment, and immunotherapy response
vs no response.
1. Select an interested immunotherapy condition (T/NT or R/NR). T/NT: immunotherapy treatment
vs no treatment; R/NR: immunotherapy response vs no response.
2. Select a specific dataset under the corresponding immunotherapy condition for differential analysis.
3. Select a threshold value of pvalue for differential analysis. The pvalue of differential analysis
was calculated by using Wilcoxon Signed Rank Test.
4. Select a threshold value of fold change for differential analysis.
5. Click the ‘Submit’ bottom to see results.
6. DEA function will generate a heatmap of differentially expressed genes under the corresponding
immunotherapy condition based on input parameters.
7. DEA function will generate a list of differentially expressed genes under the corresponding
immunotherapy condition based on input parameters.
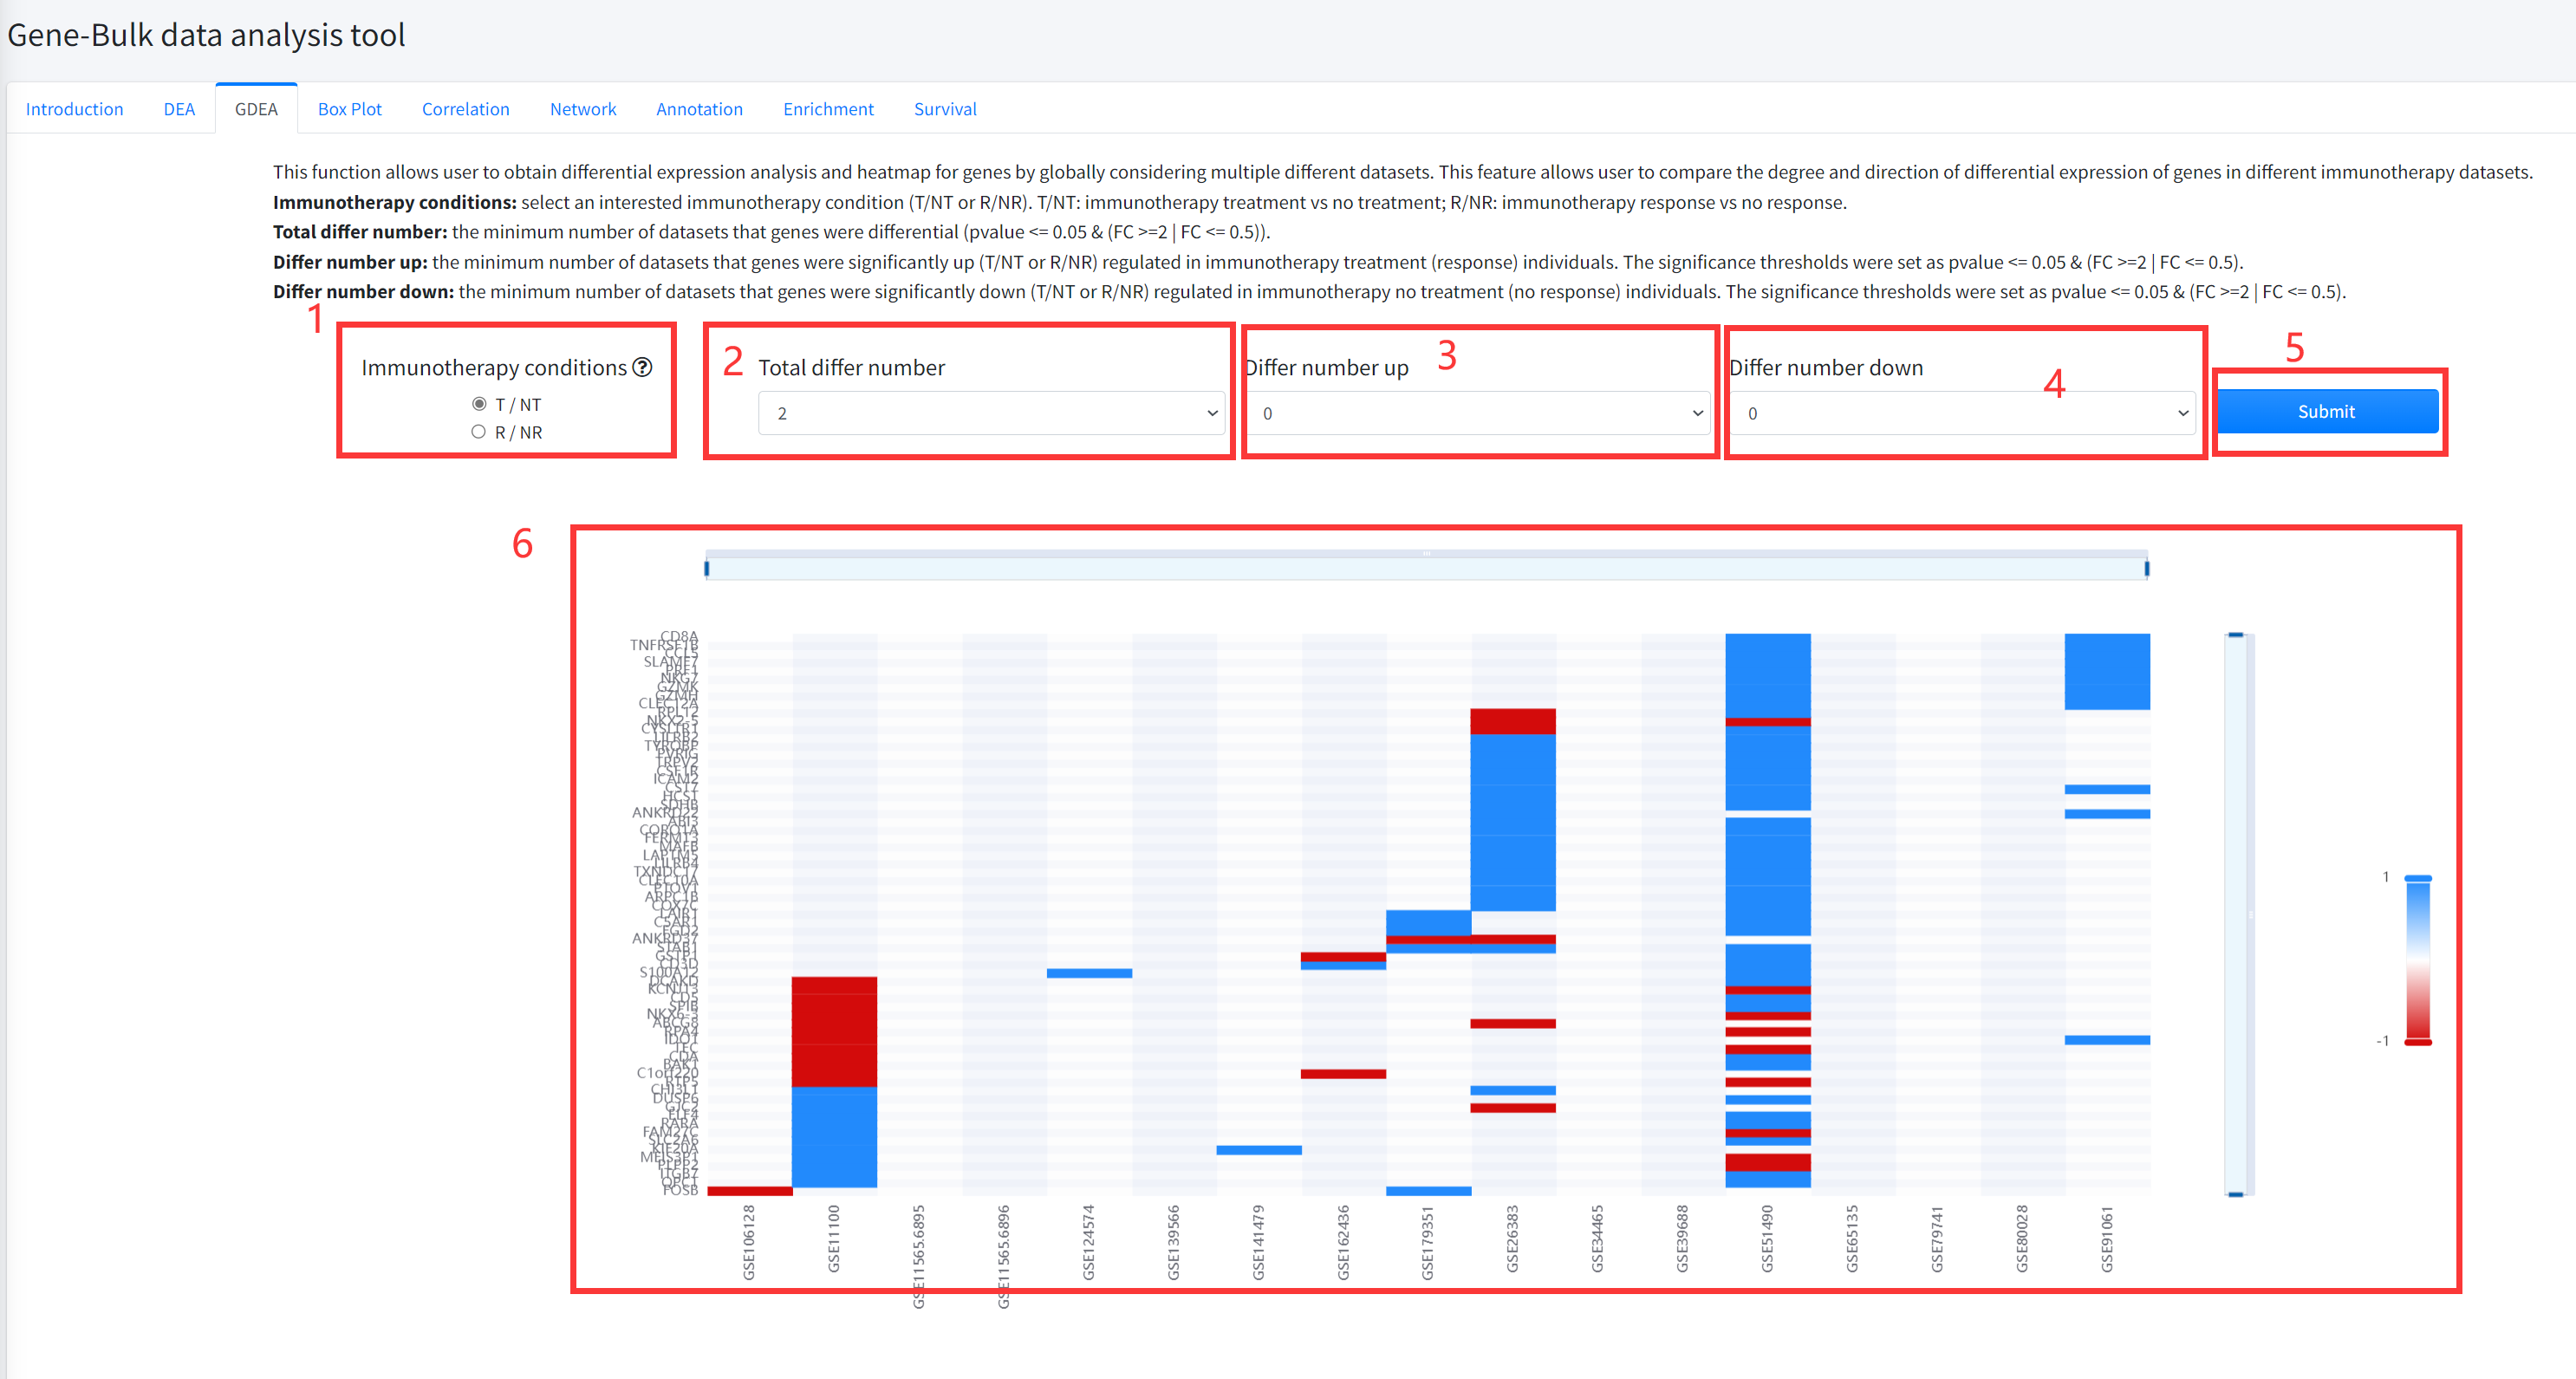
GDEA
This function allows user to obtain differential expression analysis and heatmap for genes by
globally considering multiple different datasets of cancer immunotherapy is displayed in Figure 5-3.
This feature allows user to compare the degree and direction of differential expression of genes in
different immunotherapy datasets. The pvalue of differential analysis was calculated by using Wilcoxon
Signed Rank Test.
1.Select an interested immunotherapy condition (T/NT or R/NR). T/NT: immunotherapy treatment vs no treatment;
R/NR: immunotherapy response vs no response.
2. Select the total number of datasets that genes were differential (pvalue <= 0.05 & (FC >=2 | FC <= 0.5)).
3. Select the minimum number of datasets that genes were significantly up (T/NT or R/NR) regulated in
immunotherapy treatment (response) individuals. The significance thresholds were set as pvalue <= 0.05 & (FC >=2 | FC <= 0.5).
4. Select the minimum number of datasets that genes were significantly down (T/NT or R/NR) regulated in
immunotherapy no treatment (no response) individuals. The significance thresholds were set as pvalue <= 0.05 & (FC >=2 | FC <= 0.5).
5. Click the ‘Submit’ bottom to see results.
6. GDEA function will generate a heatmap of differentially expressed genes across different datasets under
the corresponding immunotherapy condition based on input parameters. ‘red’ color in the heatmap represents
significantly up (T/NT or R/NR) regulated and ‘bule’ color in the heatmap represents significantly down (T/NT or R/NR) regulated.
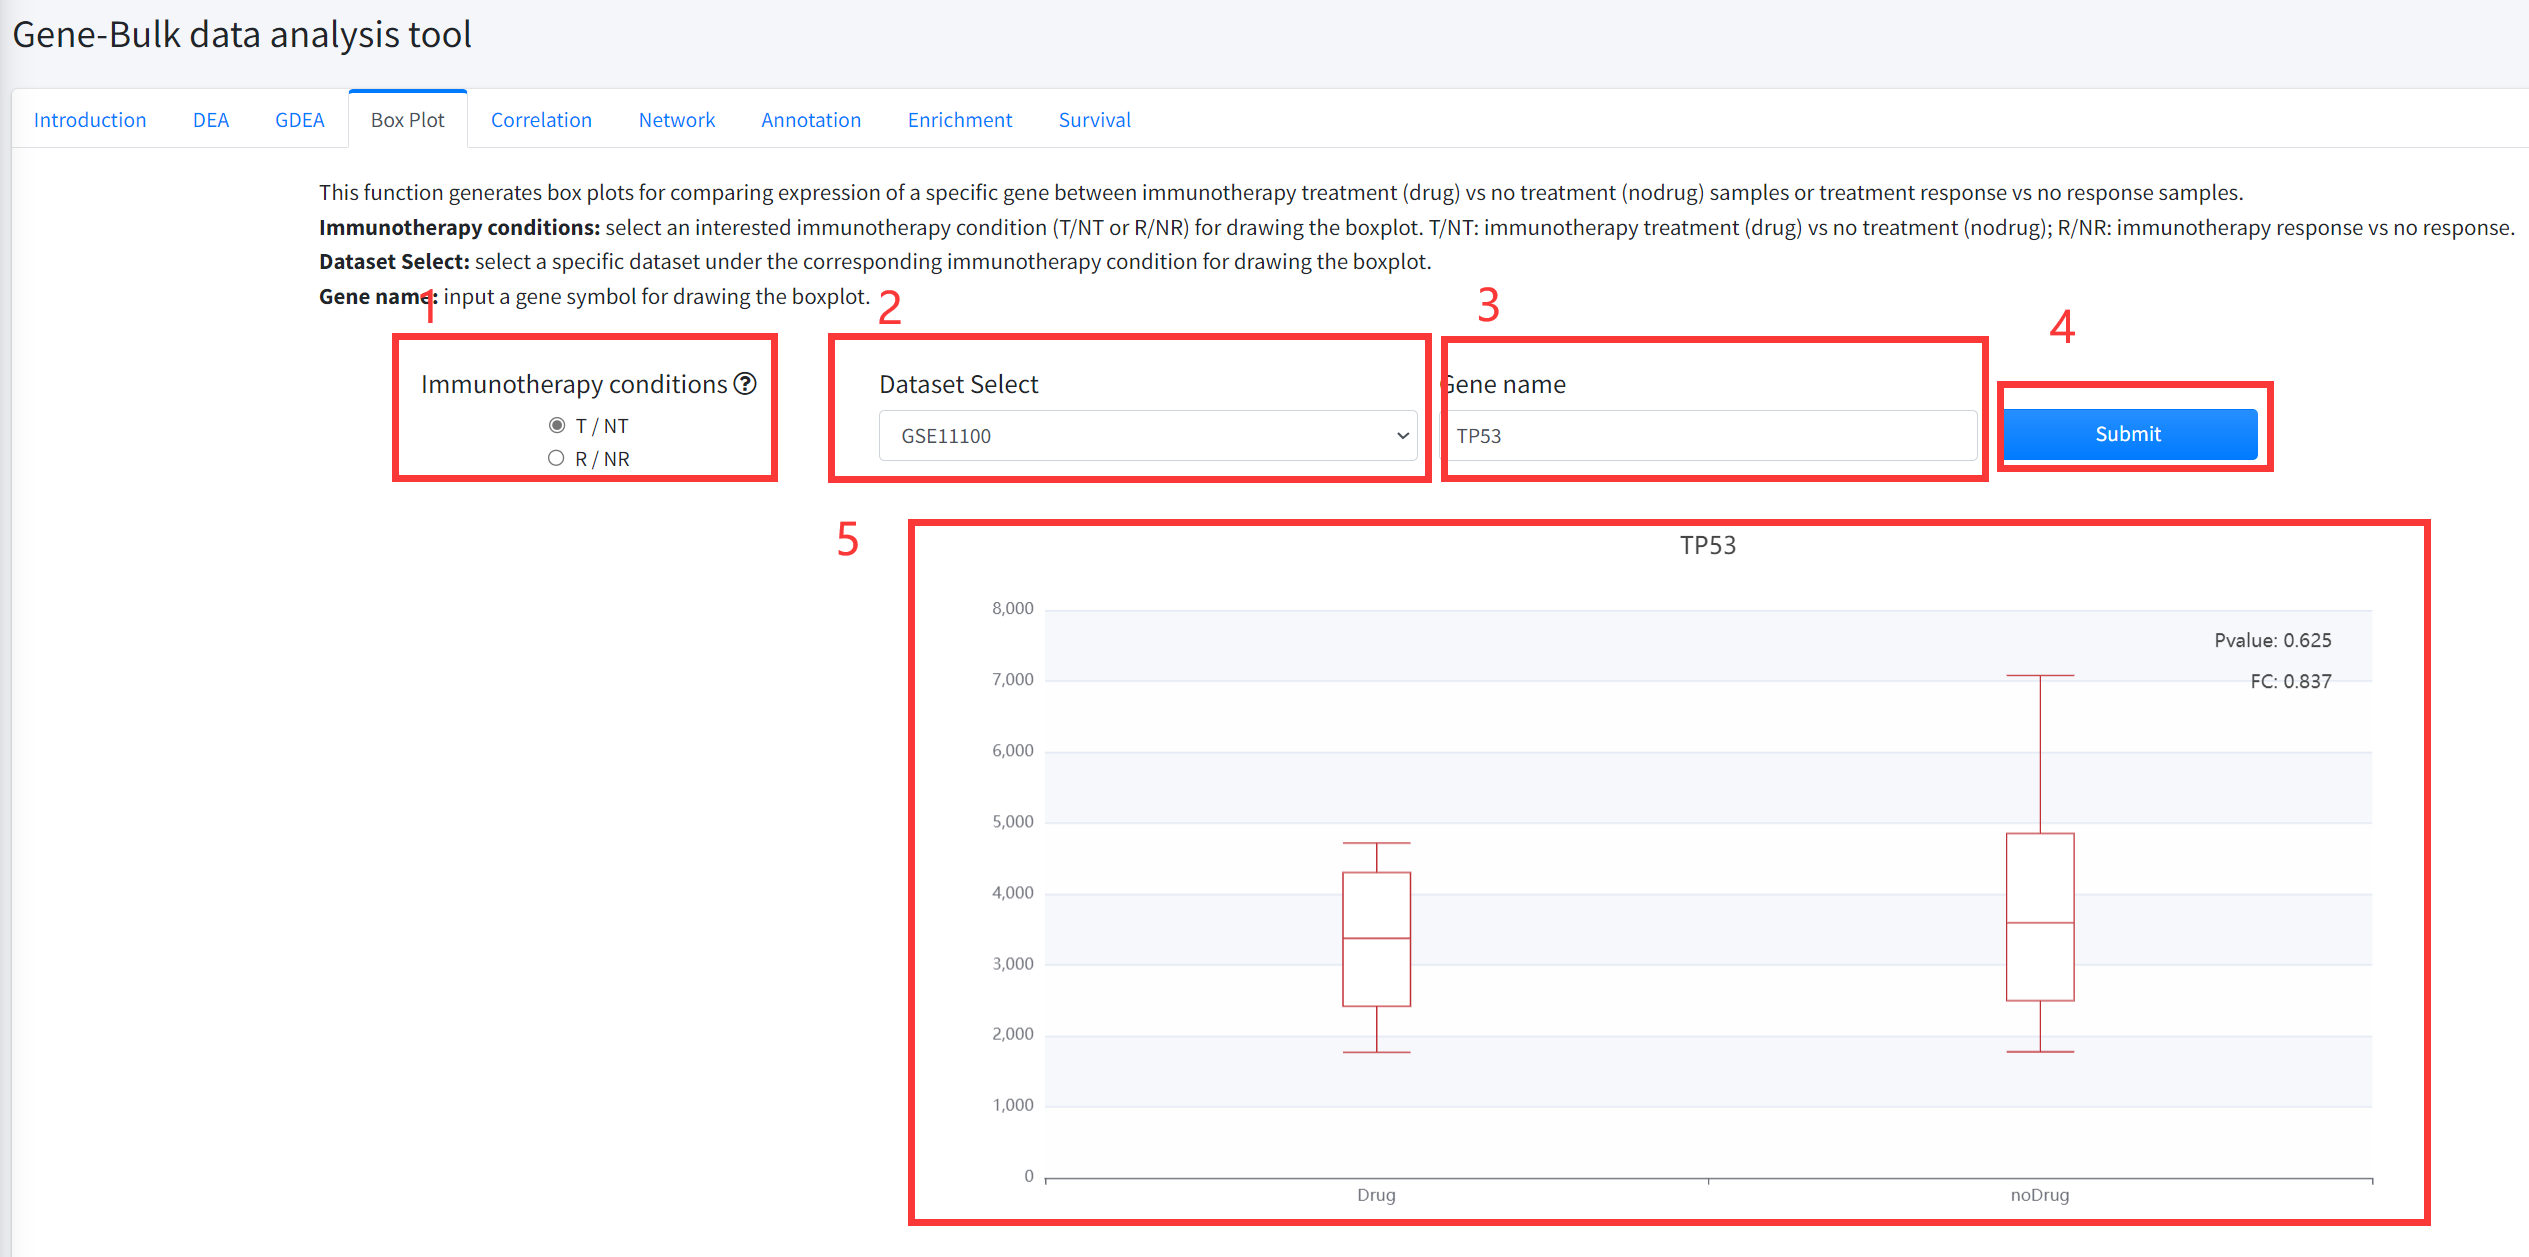
Box Plot
This function generates box plots for comparing expression of a specific gene between cancer immunotherapy treatment
(Drug) vs no treatment (noDrug) samples or immunotherapy response vs no response samples is displayed in Figure 5-4.
1.Select an interested immunotherapy condition (T/NT or R/NR) for drawing the boxplot. T/NT: immunotherapy treatment vs no treatment;
R/NR: immunotherapy response vs no response.
2. Select a specific dataset under the corresponding immunotherapy condition for drawing the boxplot.
3. Input a gene symbol for drawing the boxplot.
4. Click the ‘Submit’ bottom to see results.
5. Boxplot function will generate a boxplot for comparing expression of gene under the corresponding immunotherapy
condition based on input parameters. The pvalue in boxplot was calculated by using Wilcoxon Signed Rank Test.
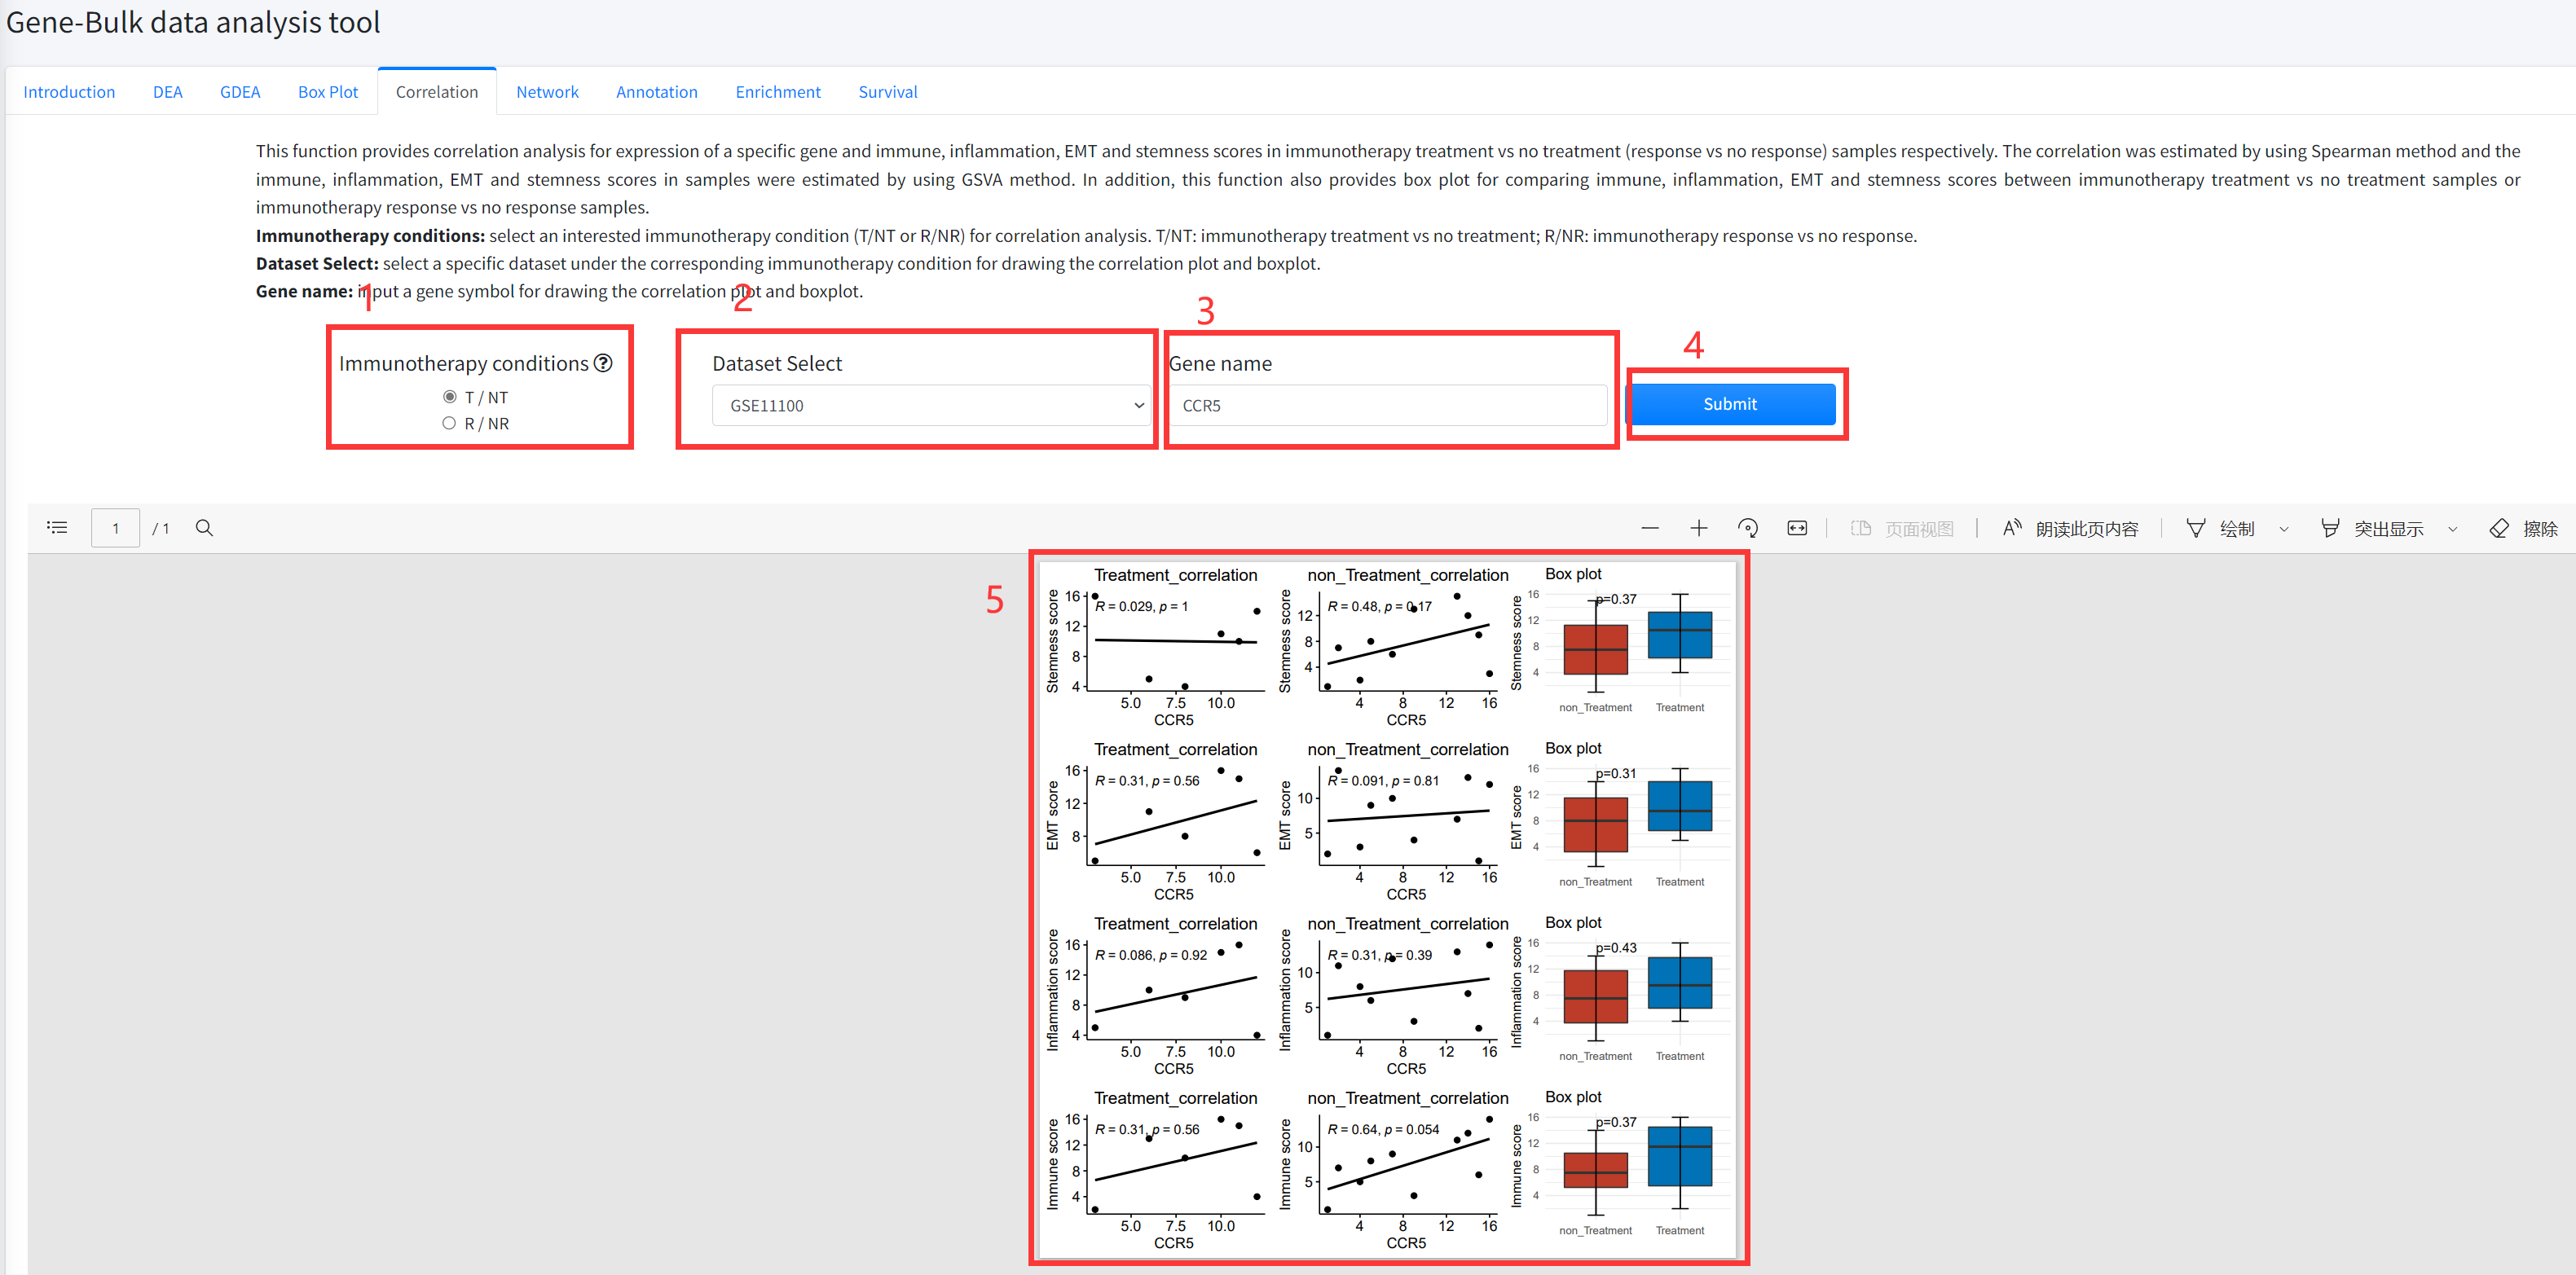
Correlation
This function provides correlation analysis for expression of a specific gene and immune, inflammation, EMT and
stemness scores in cancer immunotherapy treatment vs no treatment (response vs no response) samples respectively.
The correlation was estimated by using Spearman method and the immune, inflammation, EMT and stemness scores in
samples were estimated by using GSVA method. In addition, this function also provides box plot for comparing immune,
inflammation, EMT and stemness scores between immunotherapy treatment vs no treatment samples or immunotherapy
response vs no response samples. This function is displayed in Figure 5-5.
1. Select an interested immunotherapy condition (T/NT or R/NR) for correlation analysis. T/NT: immunotherapy treatment
vs no treatment; R/NR: immunotherapy response vs no response.
2. Select a specific dataset under the corresponding immunotherapy condition for drawing the correlation plot and boxplot.
3. Input a gene symbol for drawing the correlation plot and boxplot.
4. Click the ‘Submit’ bottom to see results.
5. Correlation function will generate scatter diagrams of a specific gene and immune, inflammation, EMT and stemness
scores in cancer immunotherapy treatment vs no treatment (response vs no response) samples respectively using
correlation analysis based on input parameters. Correlation function will also generate boxplots for comparing immune,
inflammation, EMT and stemness scores under the corresponding immunotherapy condition based on input parameters.
The pvalue in boxplot was calculated by using Wilcoxon Signed Rank Test.
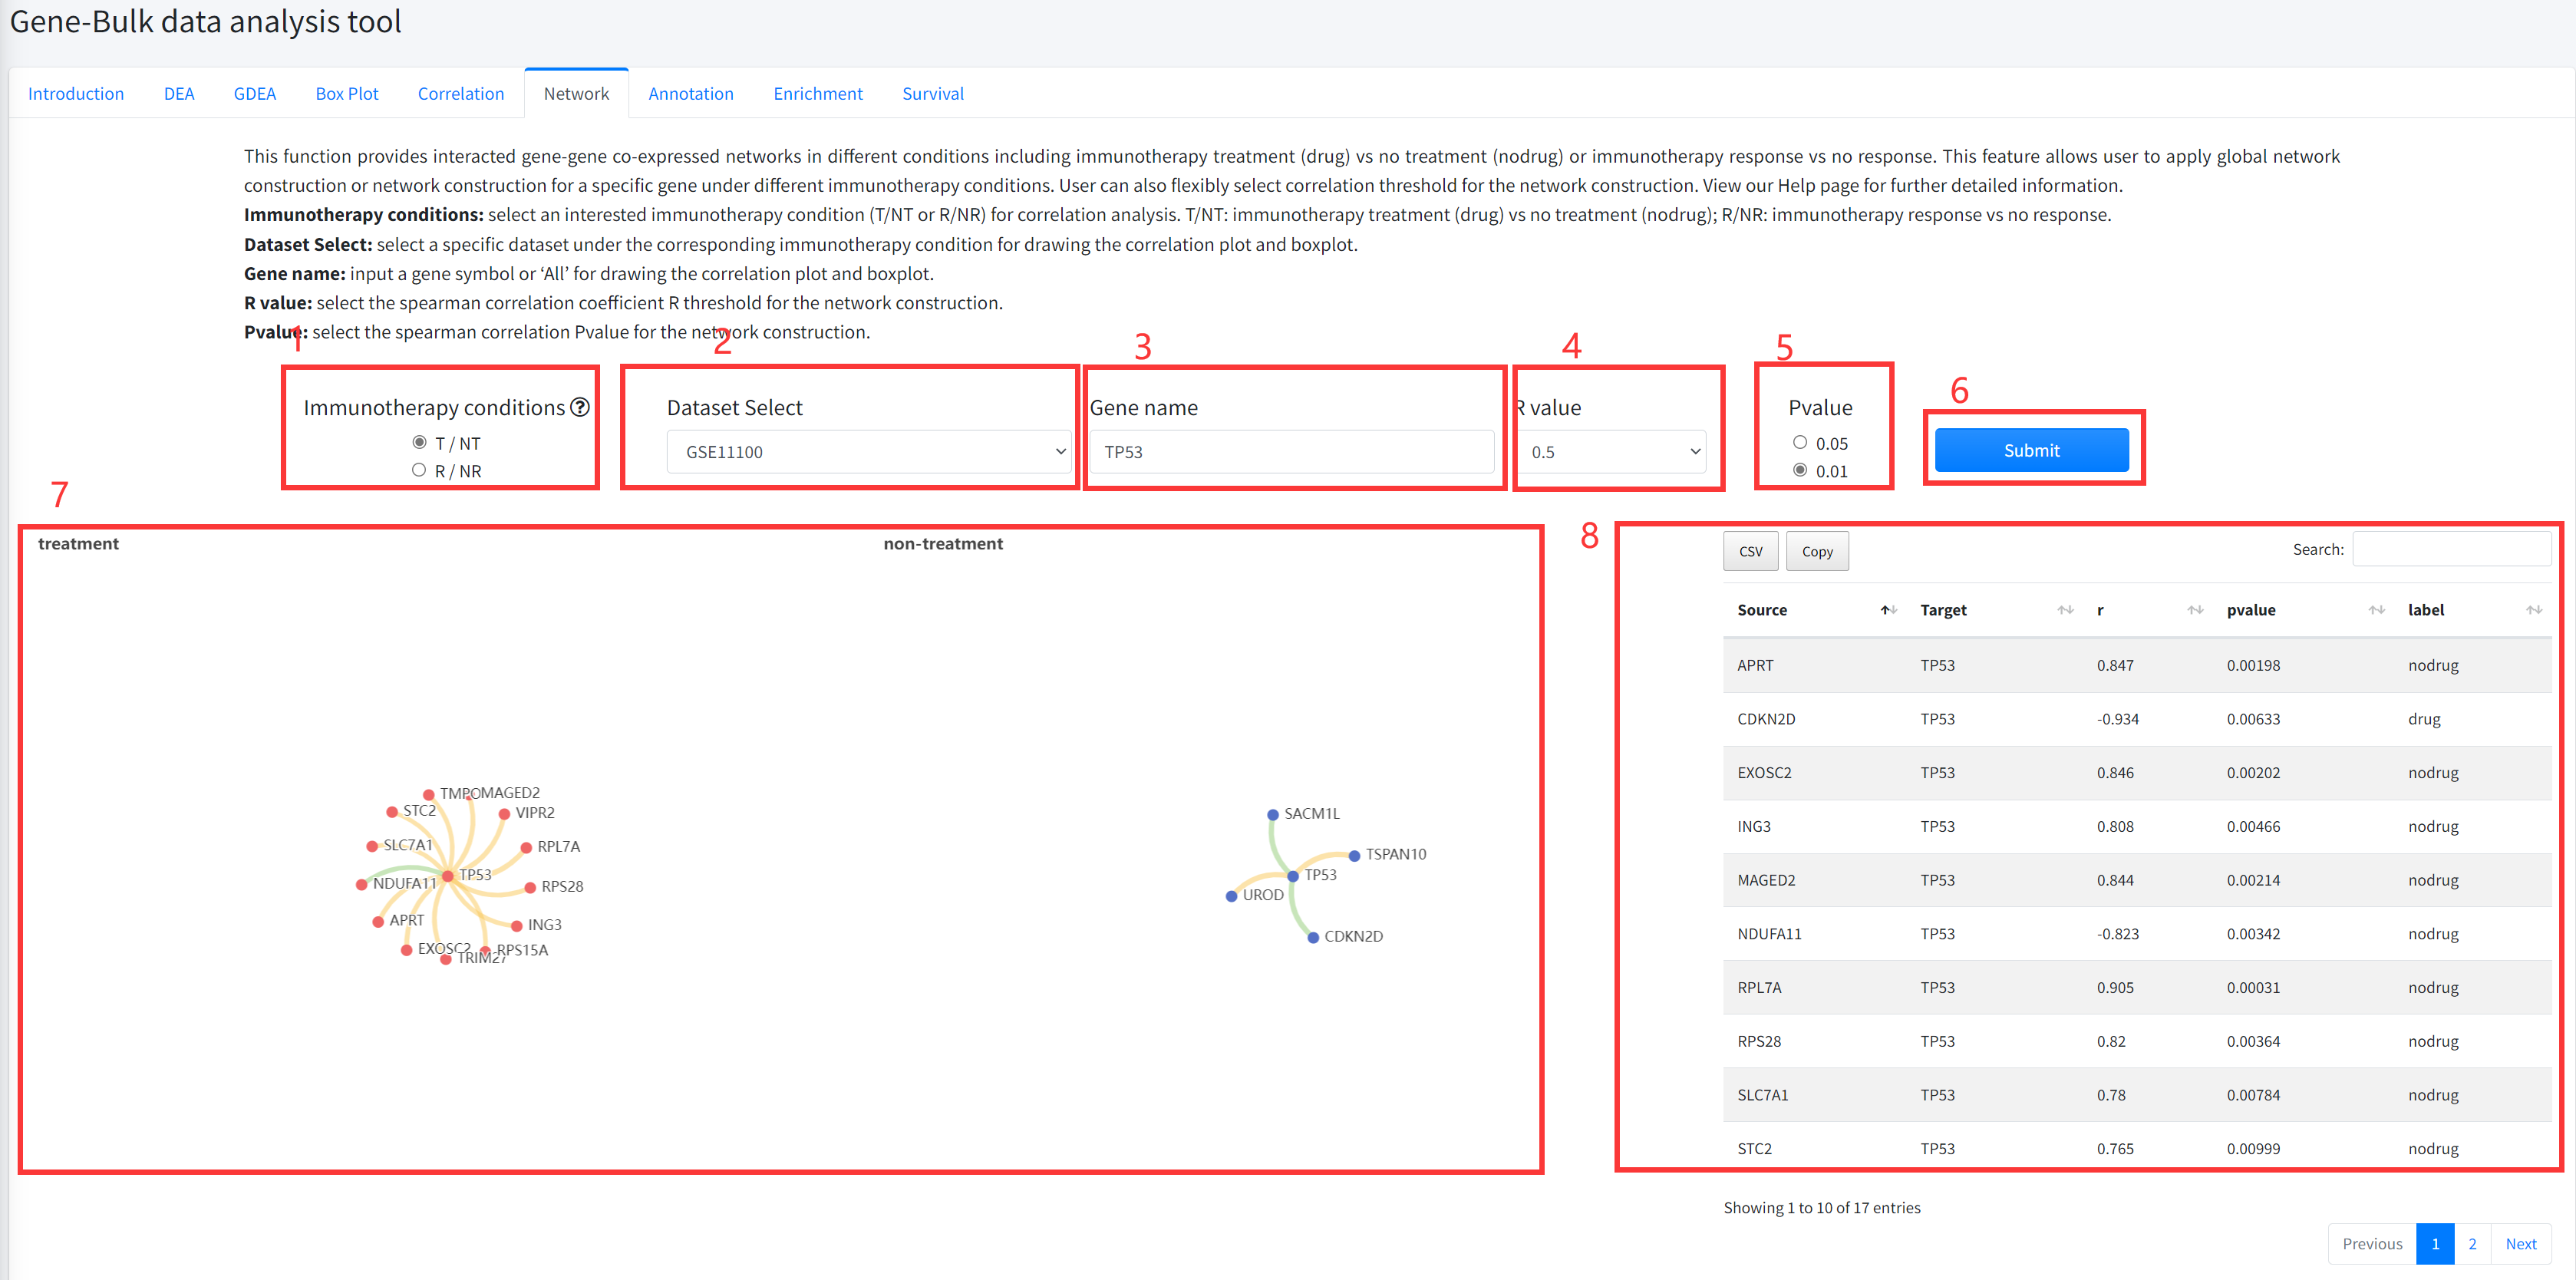
Network
This function provides interacted gene-gene co-expressed networks in different
conditions including cancer immunotherapy treatment vs no treatment or immunotherapy treatment
response vs no response. This feature allows user to apply global network
construction or network construction for a specific gene under different
immunotherapy conditions. User can also flexibly select correlation threshold
for the network construction. This function is displayed in Figure 5-6.
1. Select an interested immunotherapy condition (T/NT or R/NR) for correlation analysis.
T/NT: immunotherapy treatment vs no treatment; R/NR: immunotherapy response vs no response.
2. Select a specific dataset under the corresponding immunotherapy condition for drawing
the correlation plot and boxplot.
3. Input a gene symbol or ‘All’ for network construction.
4. Select the spearman correlation coefficient R threshold for the network construction.
5. Select the spearman correlation Pvalue for the network construction.
6. Click the ‘Submit’ bottom to see results.
7. Network function will generate two interacted gene-gene co-expressed networks in different
conditions including immunotherapy treatment (drug) vs no treatment (nodrug) or treatment response
vs no response. Yellow edge represents correlation coefficient R>0 and green correlation coefficient R<0.
8. Network function will generate a list of interacted gene-gene co-expressed associations under
the corresponding immunotherapy condition based on input parameters.
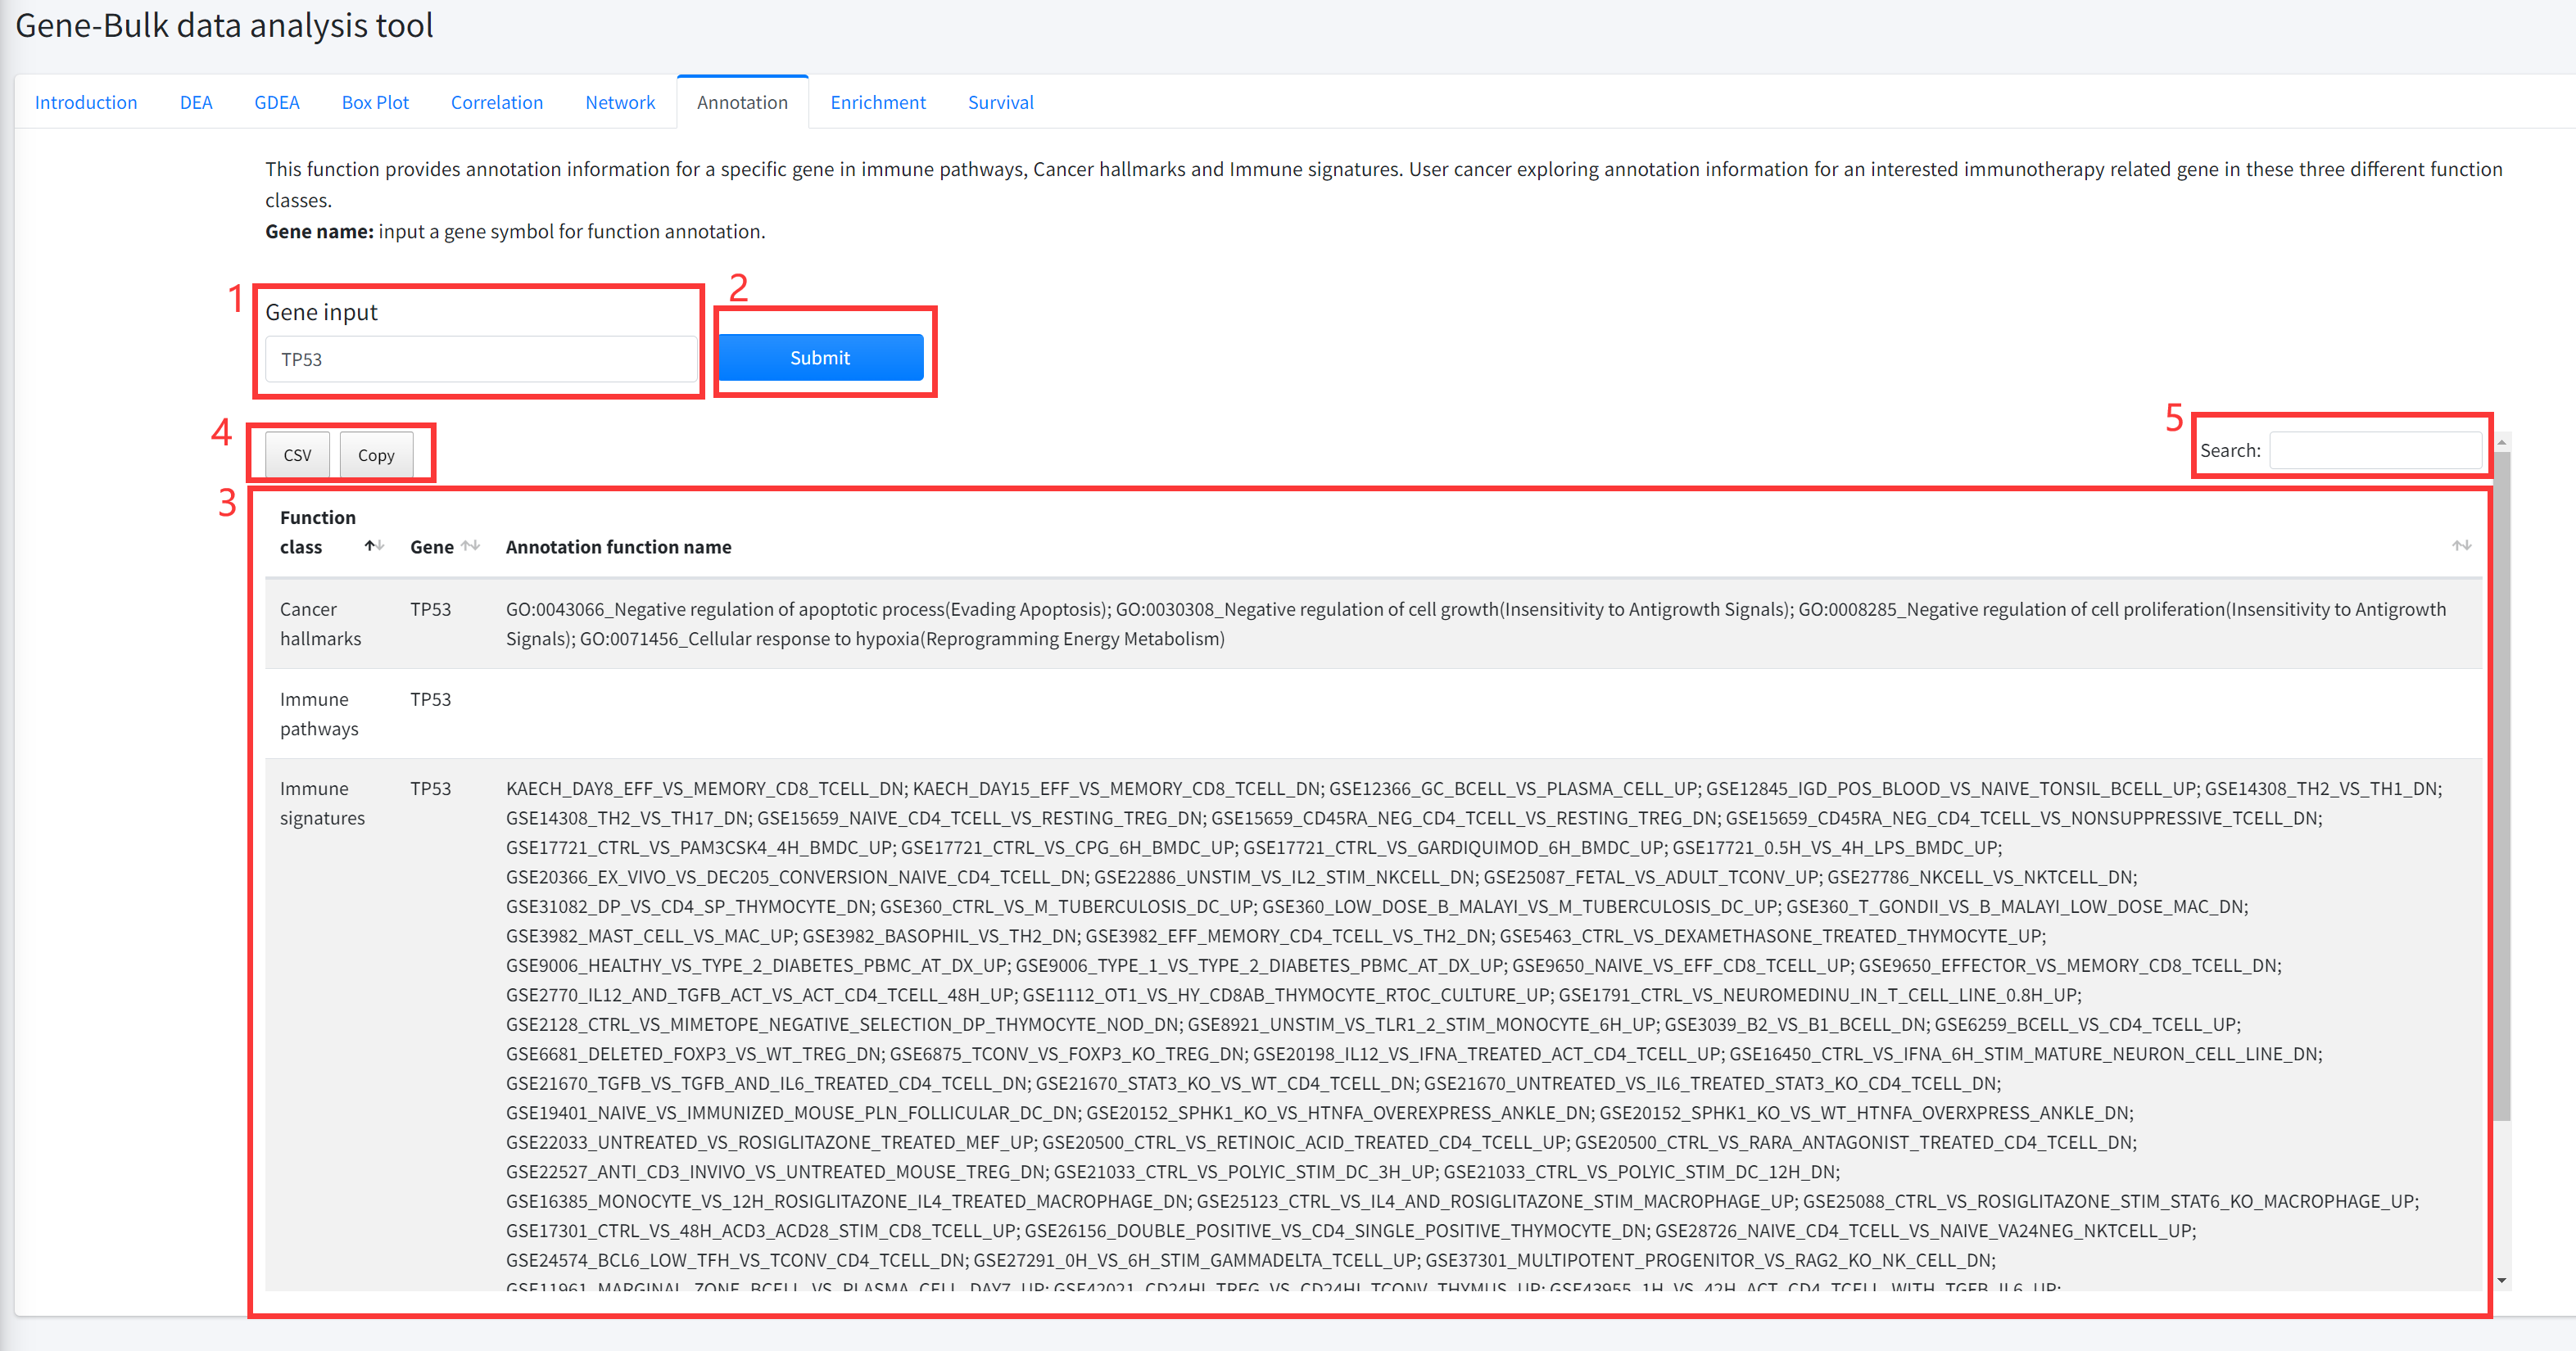
Annotation
This function provides annotation information for a specific gene in immune
pathways, Cancer hallmarks and Immune signature sets is displayed in Figure 5-7.
User cancer exploring annotation information for an interested immunotherapy
related gene in these three different function classes.
1. Input a gene symbol for function annotation.
2. Click the ‘Submit’ bottom to see results.
3. Annotation function will generate a table of annotation information for a specific gene in immune
pathways, Cancer hallmarks and Immune signature sets.
4. Click to download result table.
5. Search for items that contain keywords
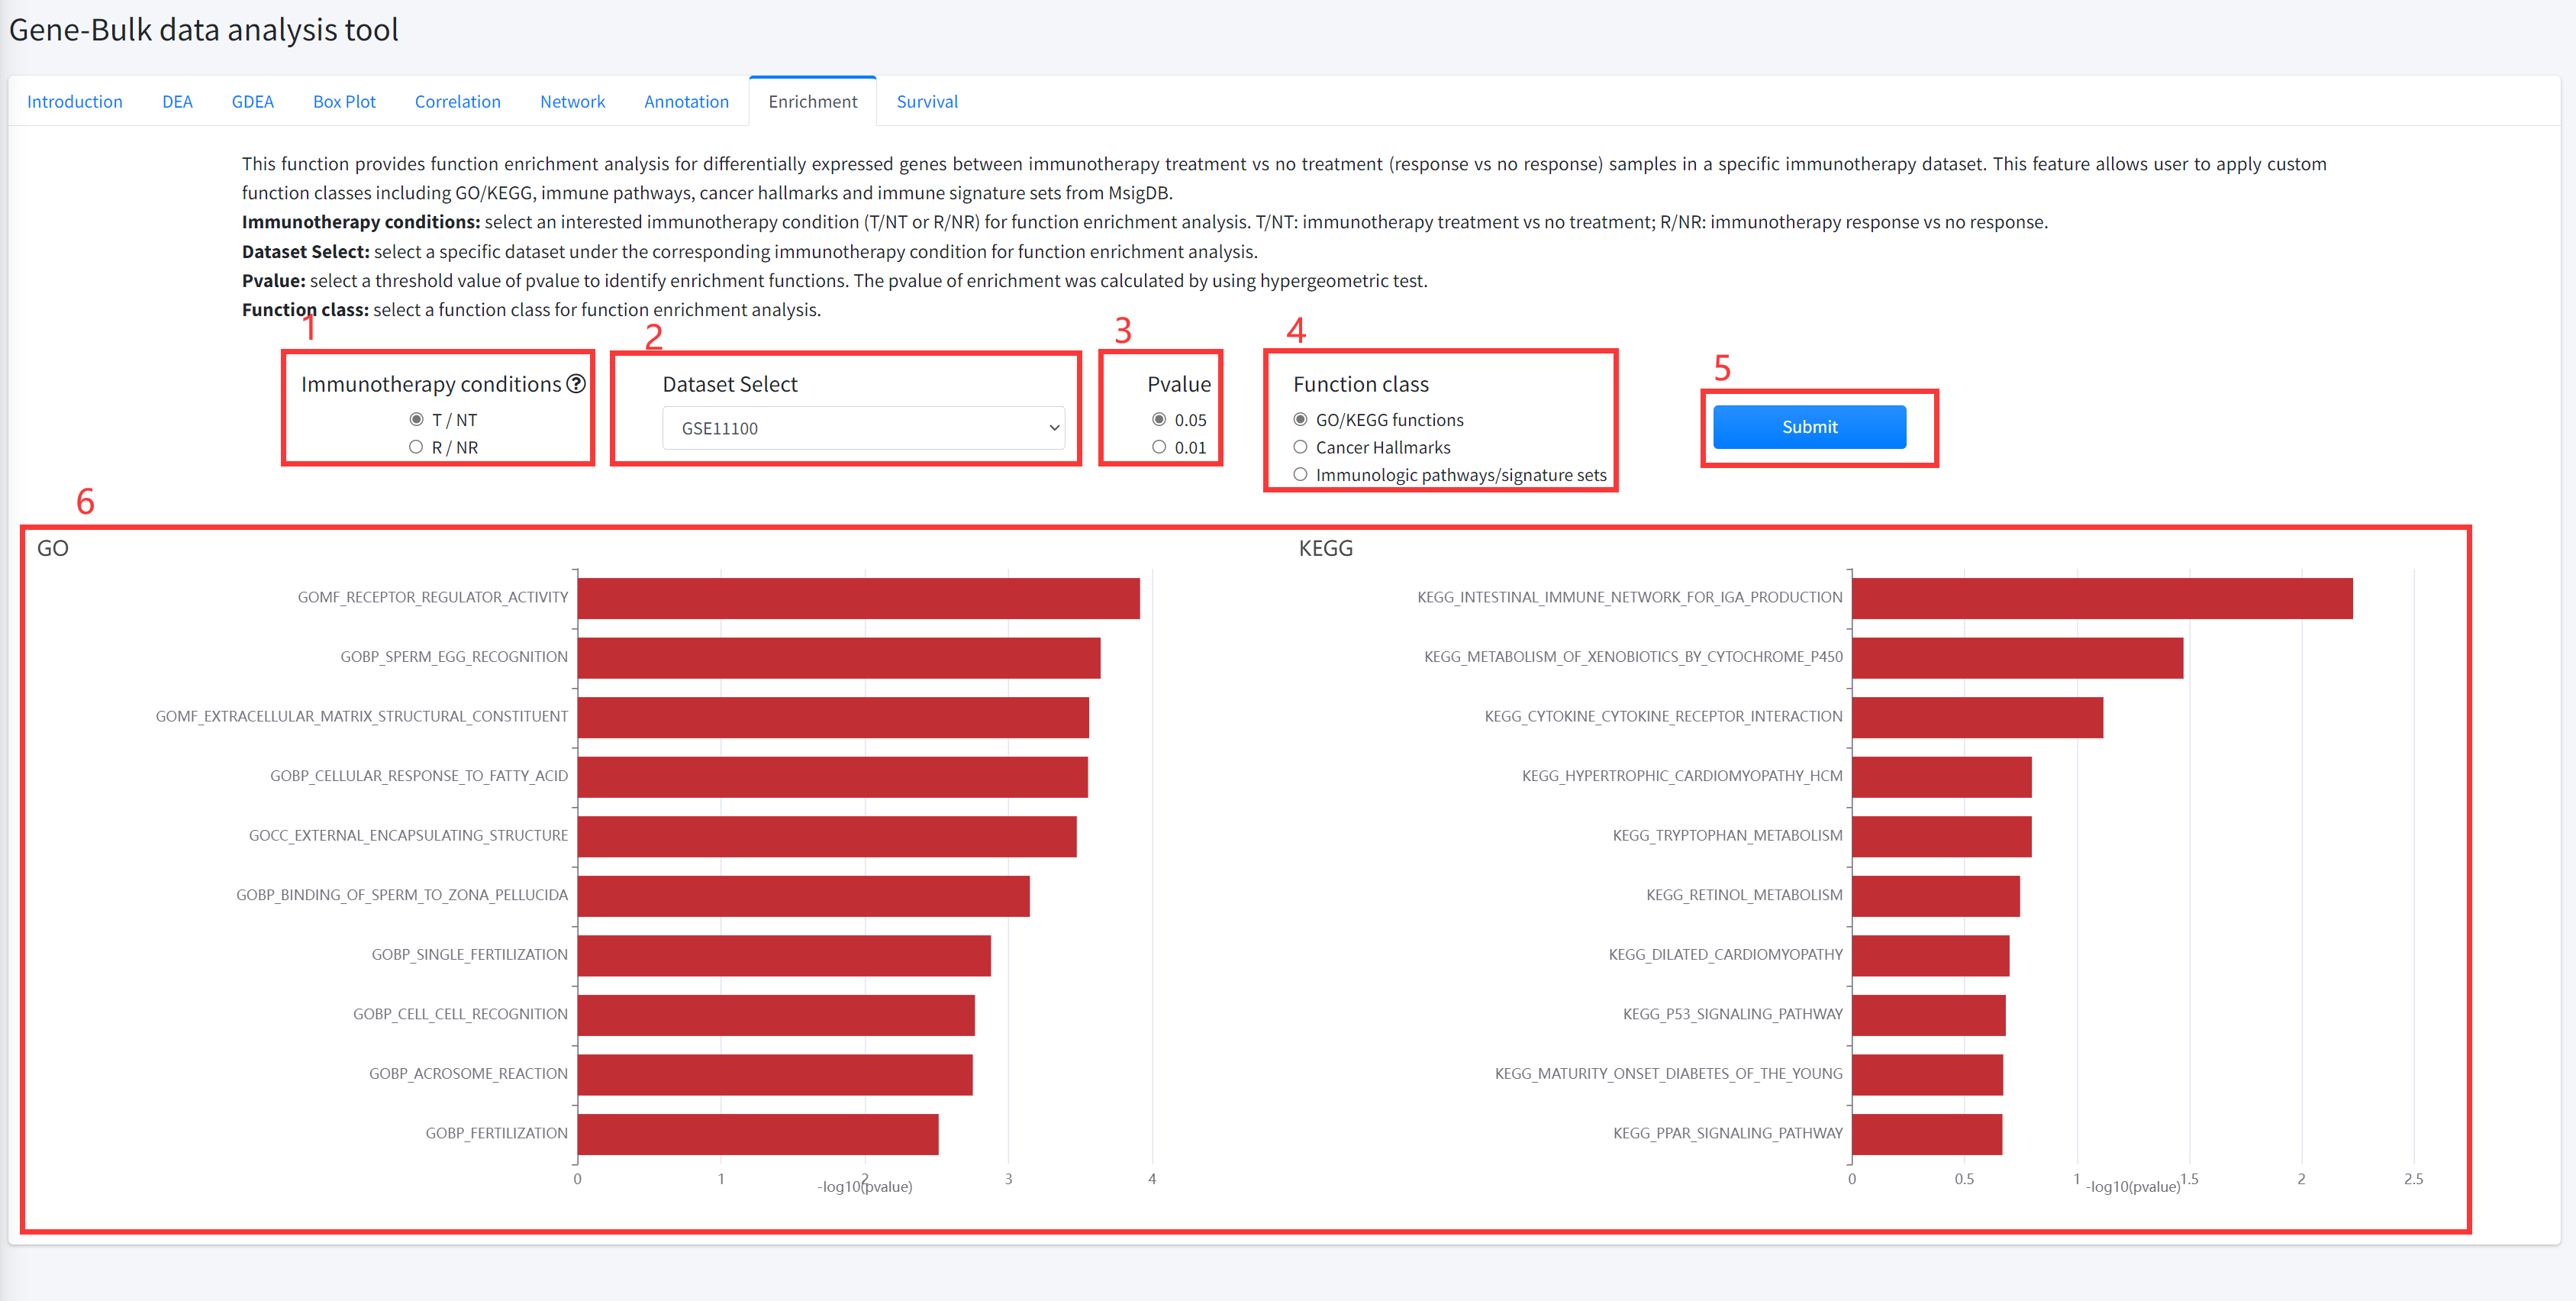
Enrichment
This function provides function enrichment analysis for differentially
expressed genes between cancer immunotherapy treatment vs no treatment
(response vs no response) samples in a specific immunotherapy dataset is
displayed in Figure 5-8. This feature allows user to apply custom function
classes including GO/KEGG, immune pathways, cancer hallmarks and immune
signature sets from MsigDB.
1. Select an interested immunotherapy condition (T/NT or R/NR) for function enrichment analysis.
T/NT: immunotherapy treatment vs no treatment; R/NR: immunotherapy response vs no response.
2. Select a specific dataset under the corresponding immunotherapy condition for function enrichment analysis.
3. Select a threshold value of pvalue to identify enrichment functions. The pvalue of enrichment was calculated by using hypergeometric test.
4. Select a function class for function enrichment analysis.
5. Click the ‘Submit’ bottom to see results.
6.Enrichment function will generate barplot for GO/KEGG and immune pathways/ signature sets or radar map for
cancer hallmarks. If the number of functions that satisfy selected significant cutoff greater than 10, 10 functions were shown.
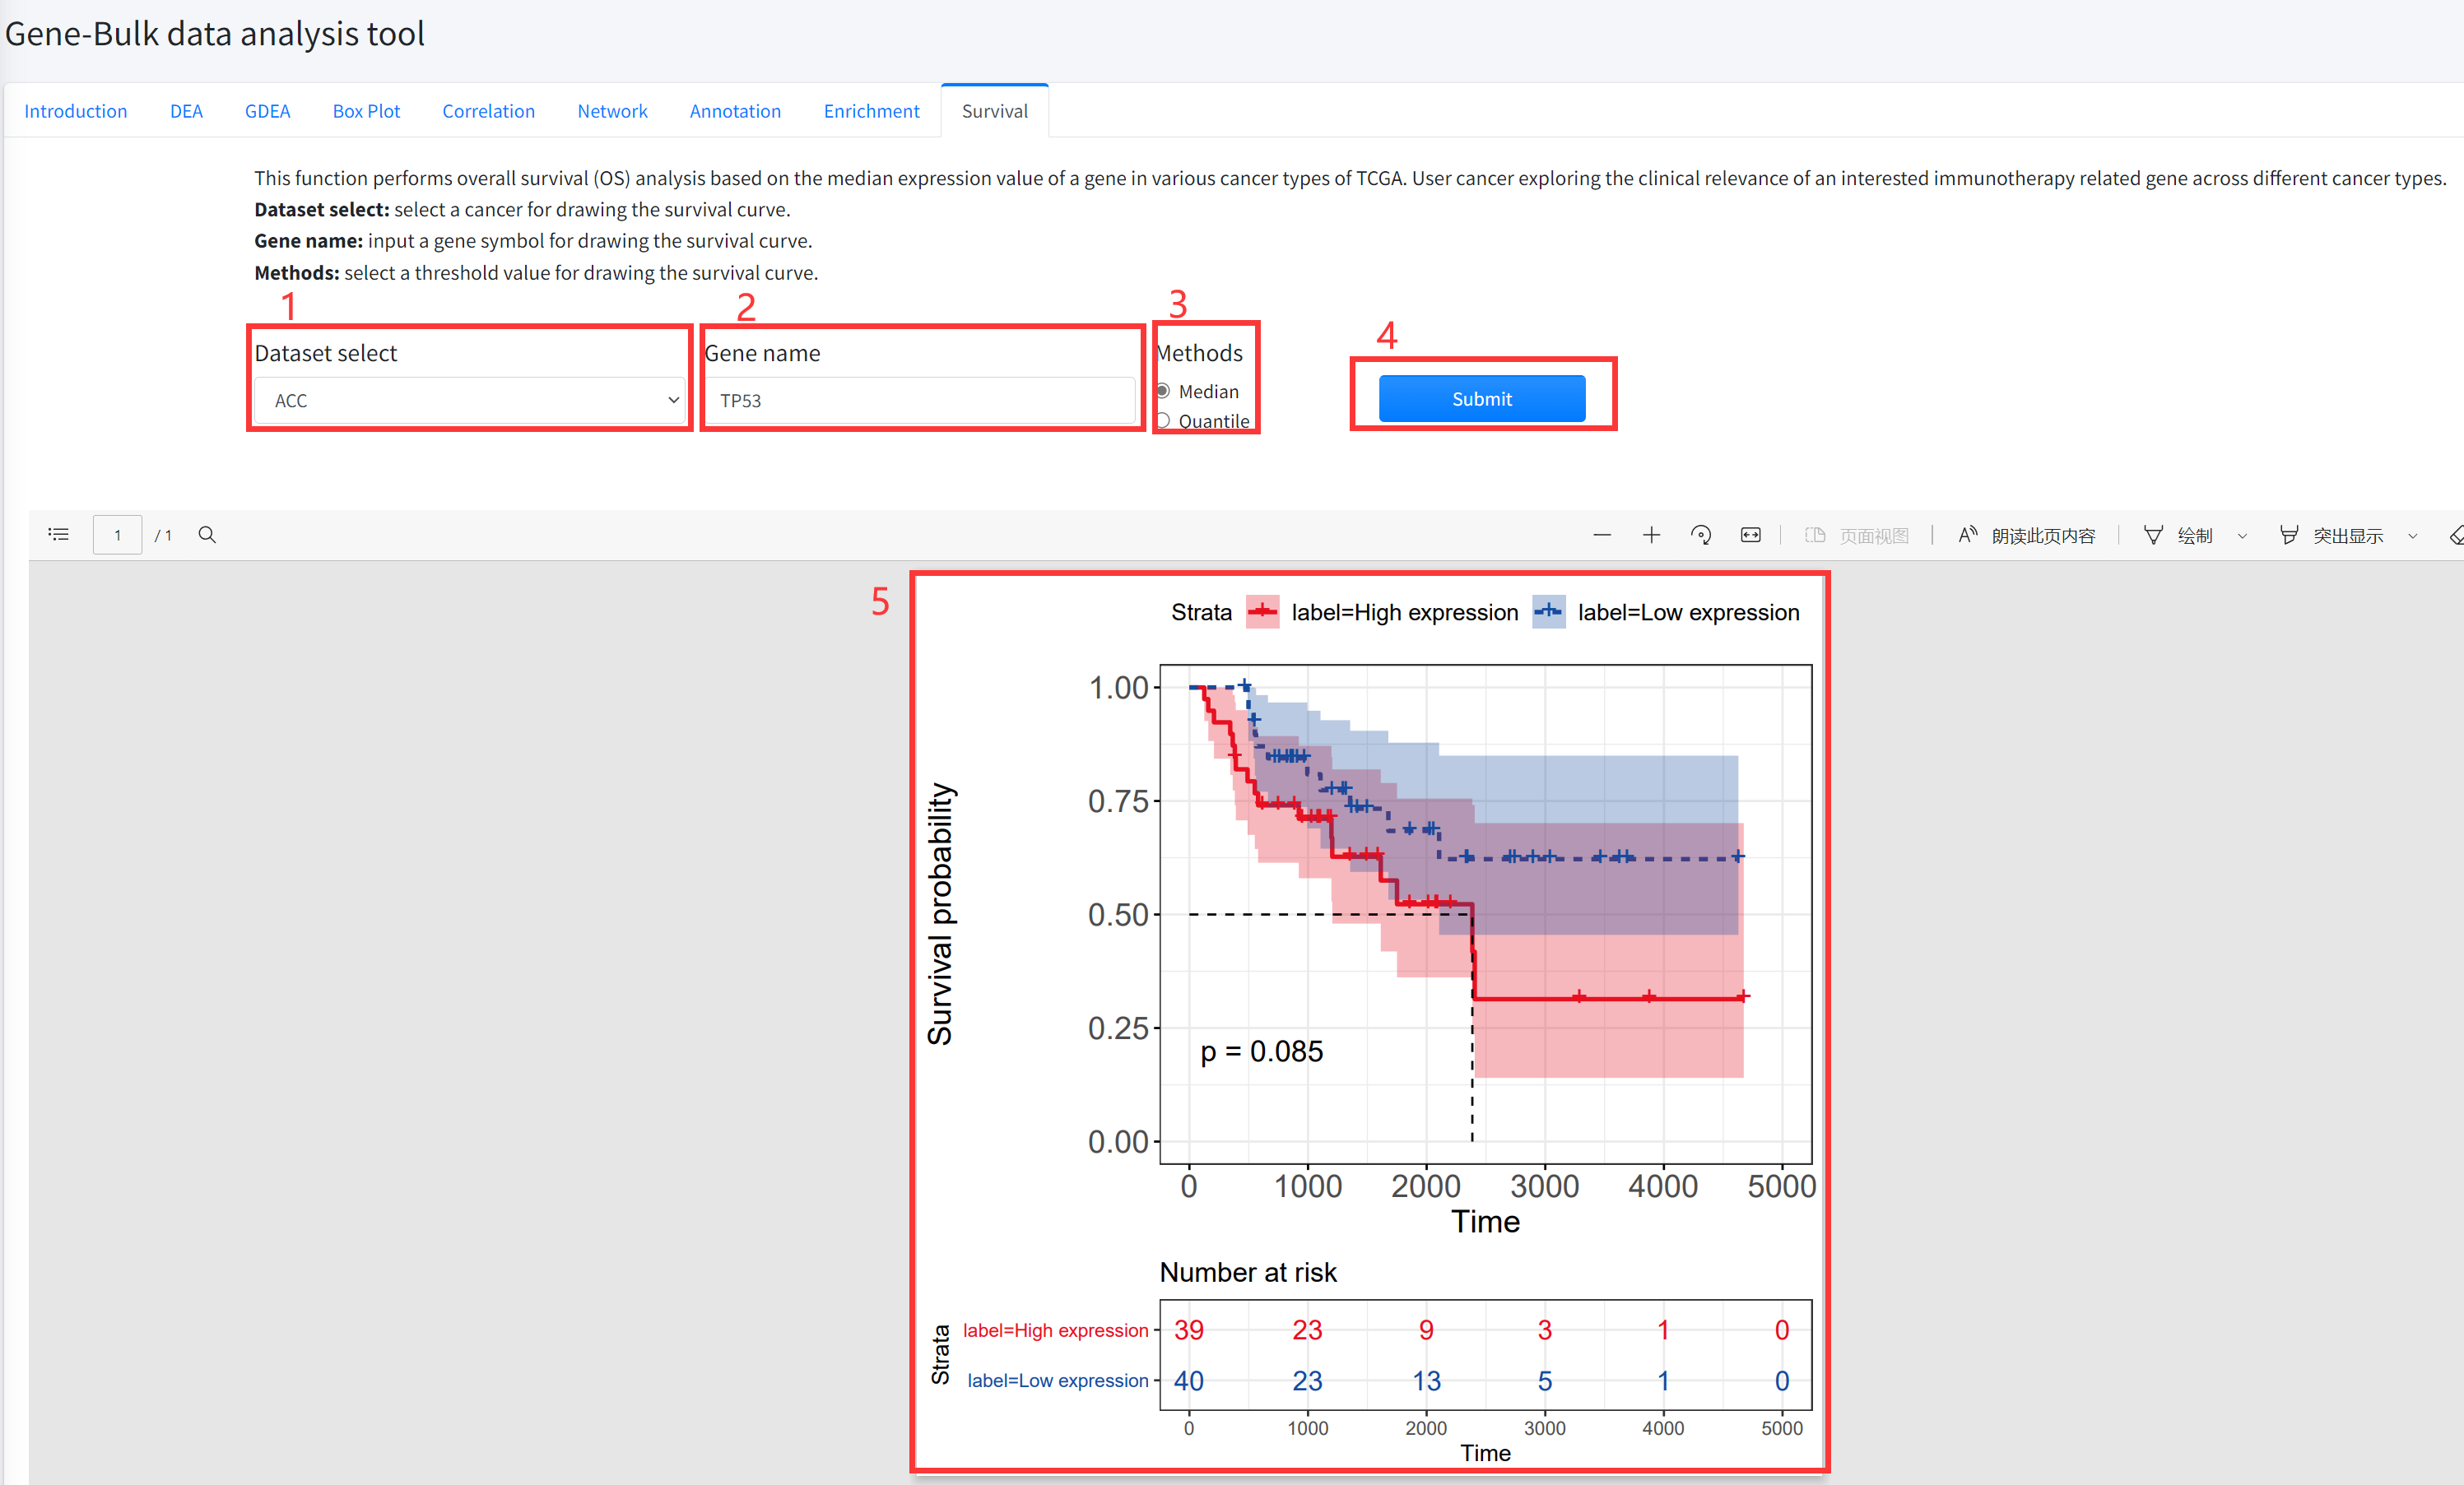
Survival
This function performs overall survival (OS) analysis based on the median
(quantile) expression value of a gene in various cancer types of TCGA is
displayed in Figure 5-9. User cancer exploring the clinical relevance of
an interested immunotherapy related gene across different cancer types.
1. Select a cancer for drawing the survival curve.
2. Input a gene symbol for drawing the survival curve.
3. Select a threshold value for drawing the survival curve.
4. Click the ‘Submit’ bottom to see results.
5. Survival function will generate a survival curve for overall survival based on input parameters.
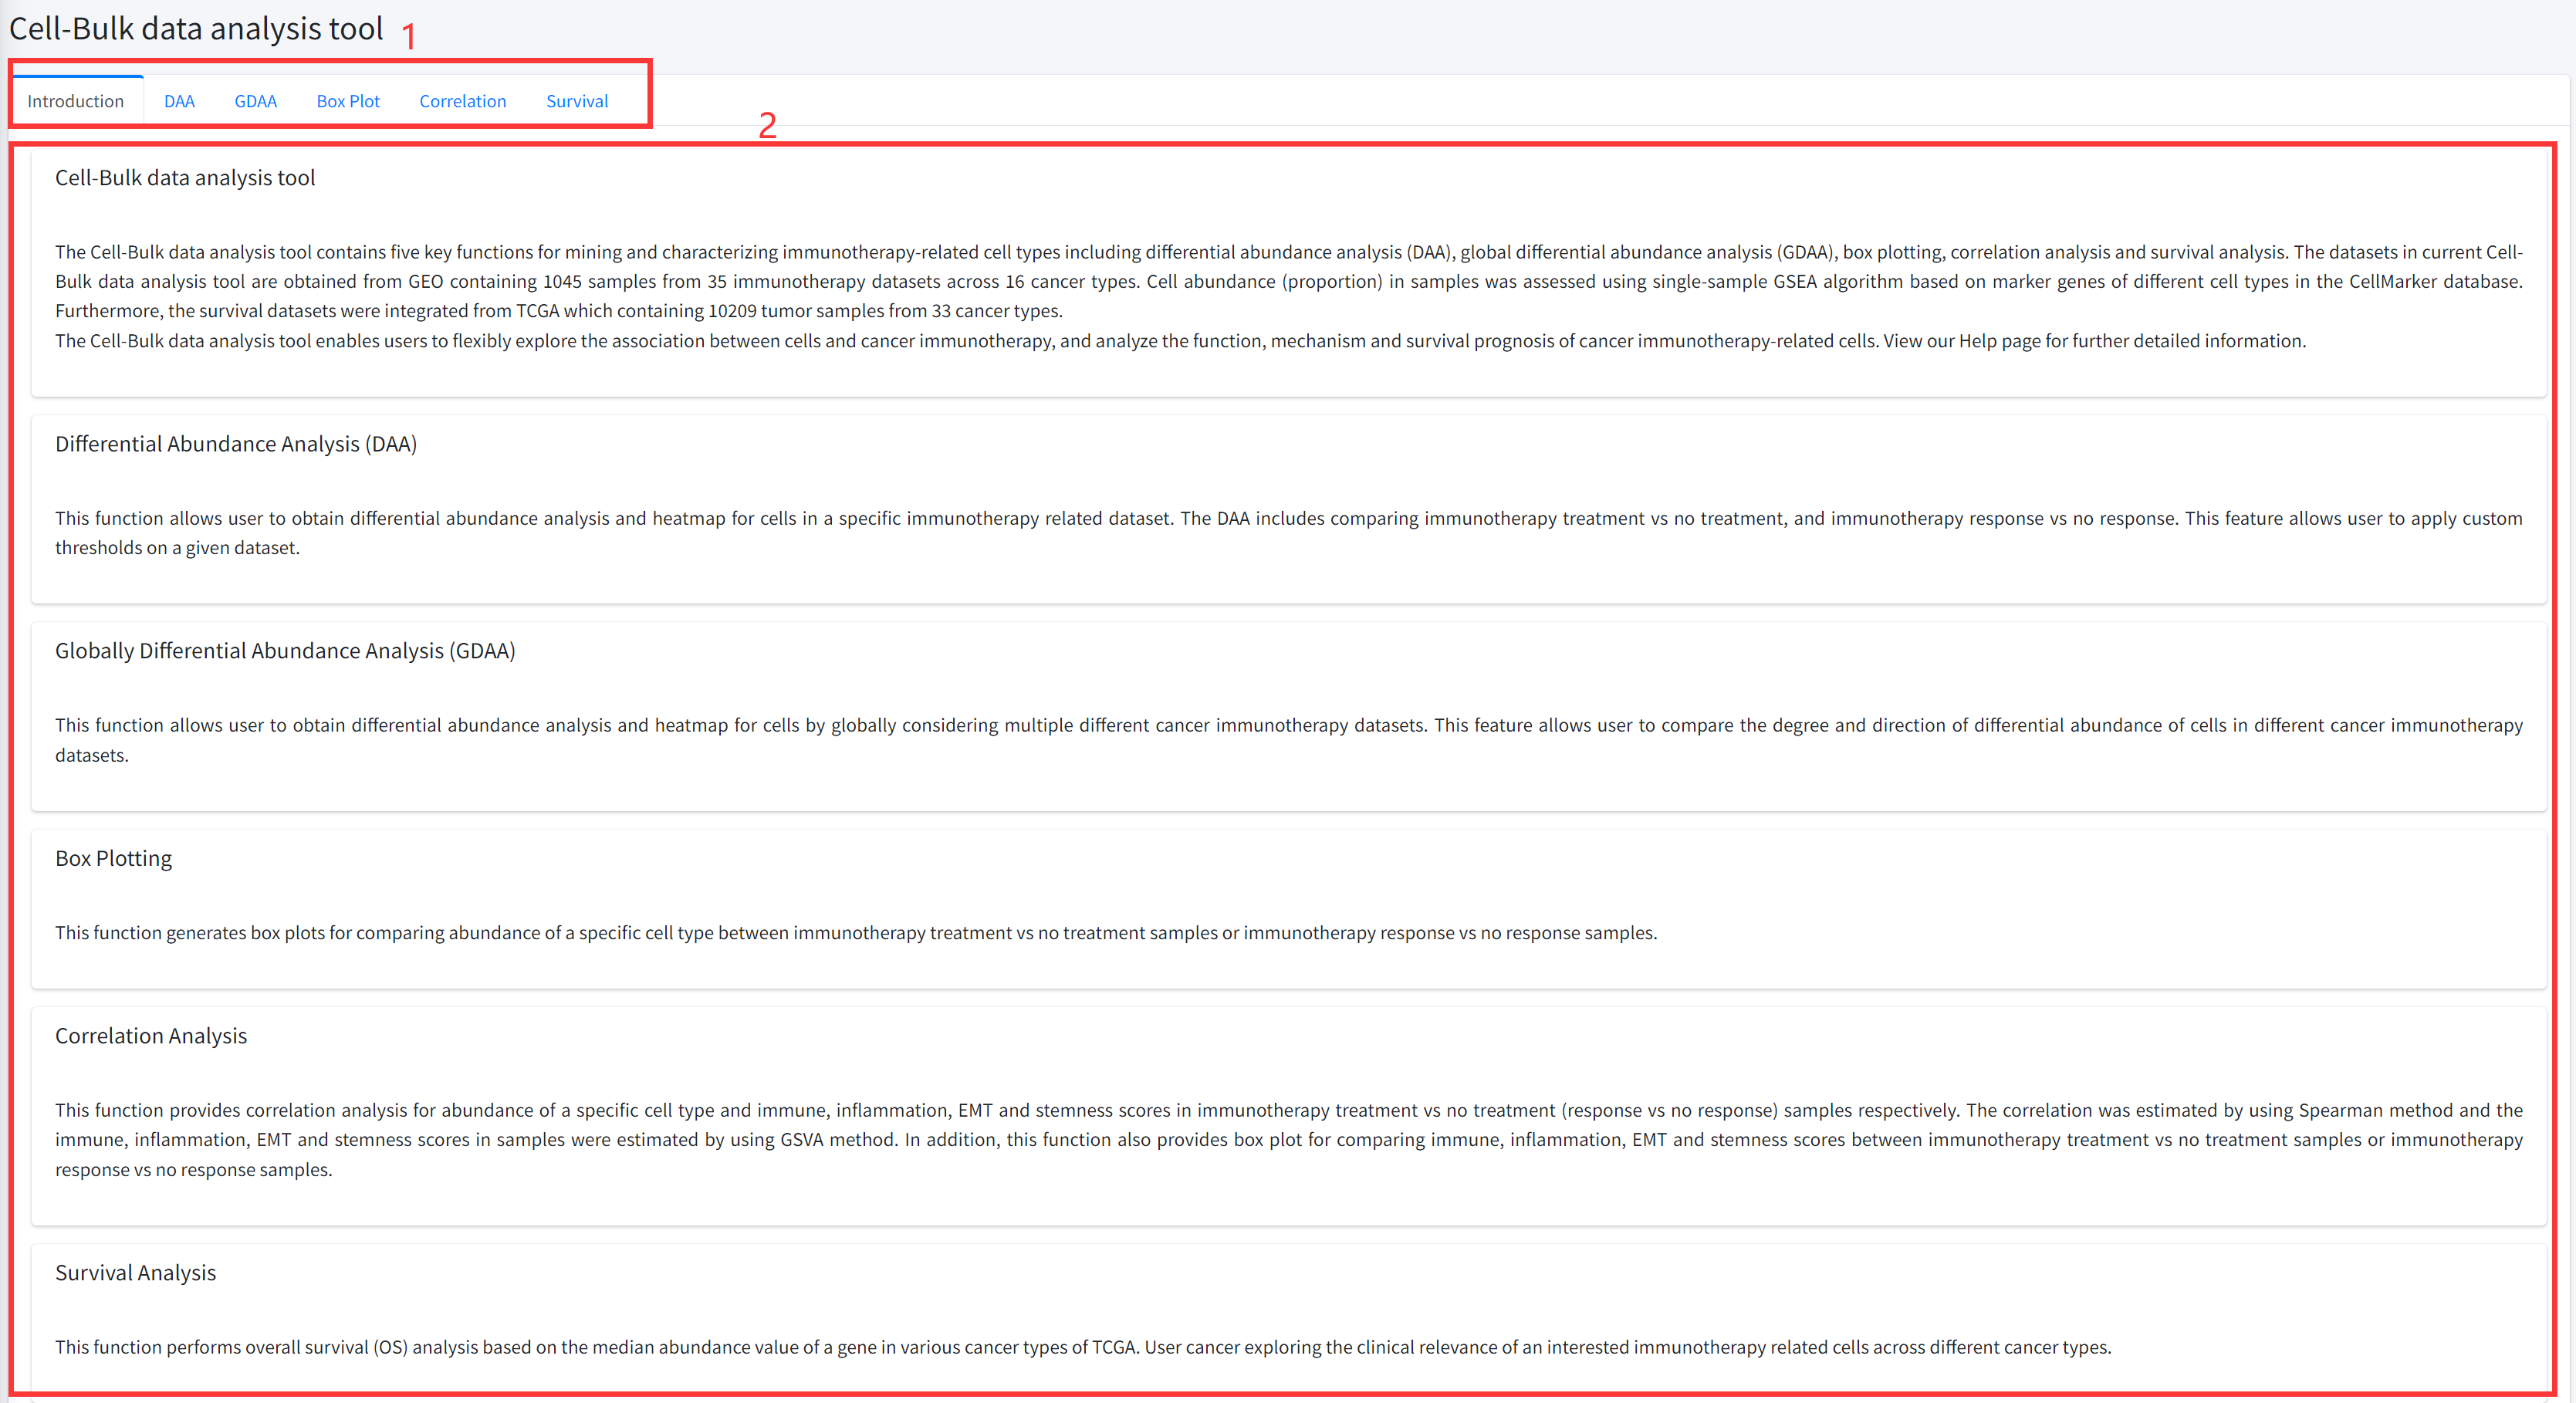
Cell-Bulk data analysis tool
The Cell-Bulk data analysis tool contains five key functions for mining and characterizing cancer
immunotherapy-related cell types including differential abundance analysis (DAA), global differential
abundance analysis (GDAA), box plotting, correlation analysis and survival analysis. The datasets in
current Cell-Bulk data analysis tool are obtained from GEO containing 1045 samples from 35 immunotherapy
datasets across 16 cancer types. Cell abundance (proportion) in samples was assessed using single-sample
GSEA algorithm based on marker genes of different cell types in the CellMarker database. Furthermore,
the survival datasets were integrated from TCGA which containing 10209 tumor samples from 33 cancer types.
The Cell-Bulk data analysis tool enables users to flexibly explore the association between cells and cancer
immunotherapy, and analyze the function, mechanism and survival prognosis of cancer immunotherapy-related cells.
Introduction
Detailed information of the Cell-Bulk data analysis tool contains five key functions for discovering
and characterizing immunotherapy-related cell types based on bulk datasets of cancer immunotherapy is displayed in Figure 7-1:
1. Main functions of the Cell-Bulk data analysis tool are provided in menu bar form (boxed in red).
2. Detailed introduction of main functions of Cell-Bulk data analysis tool.
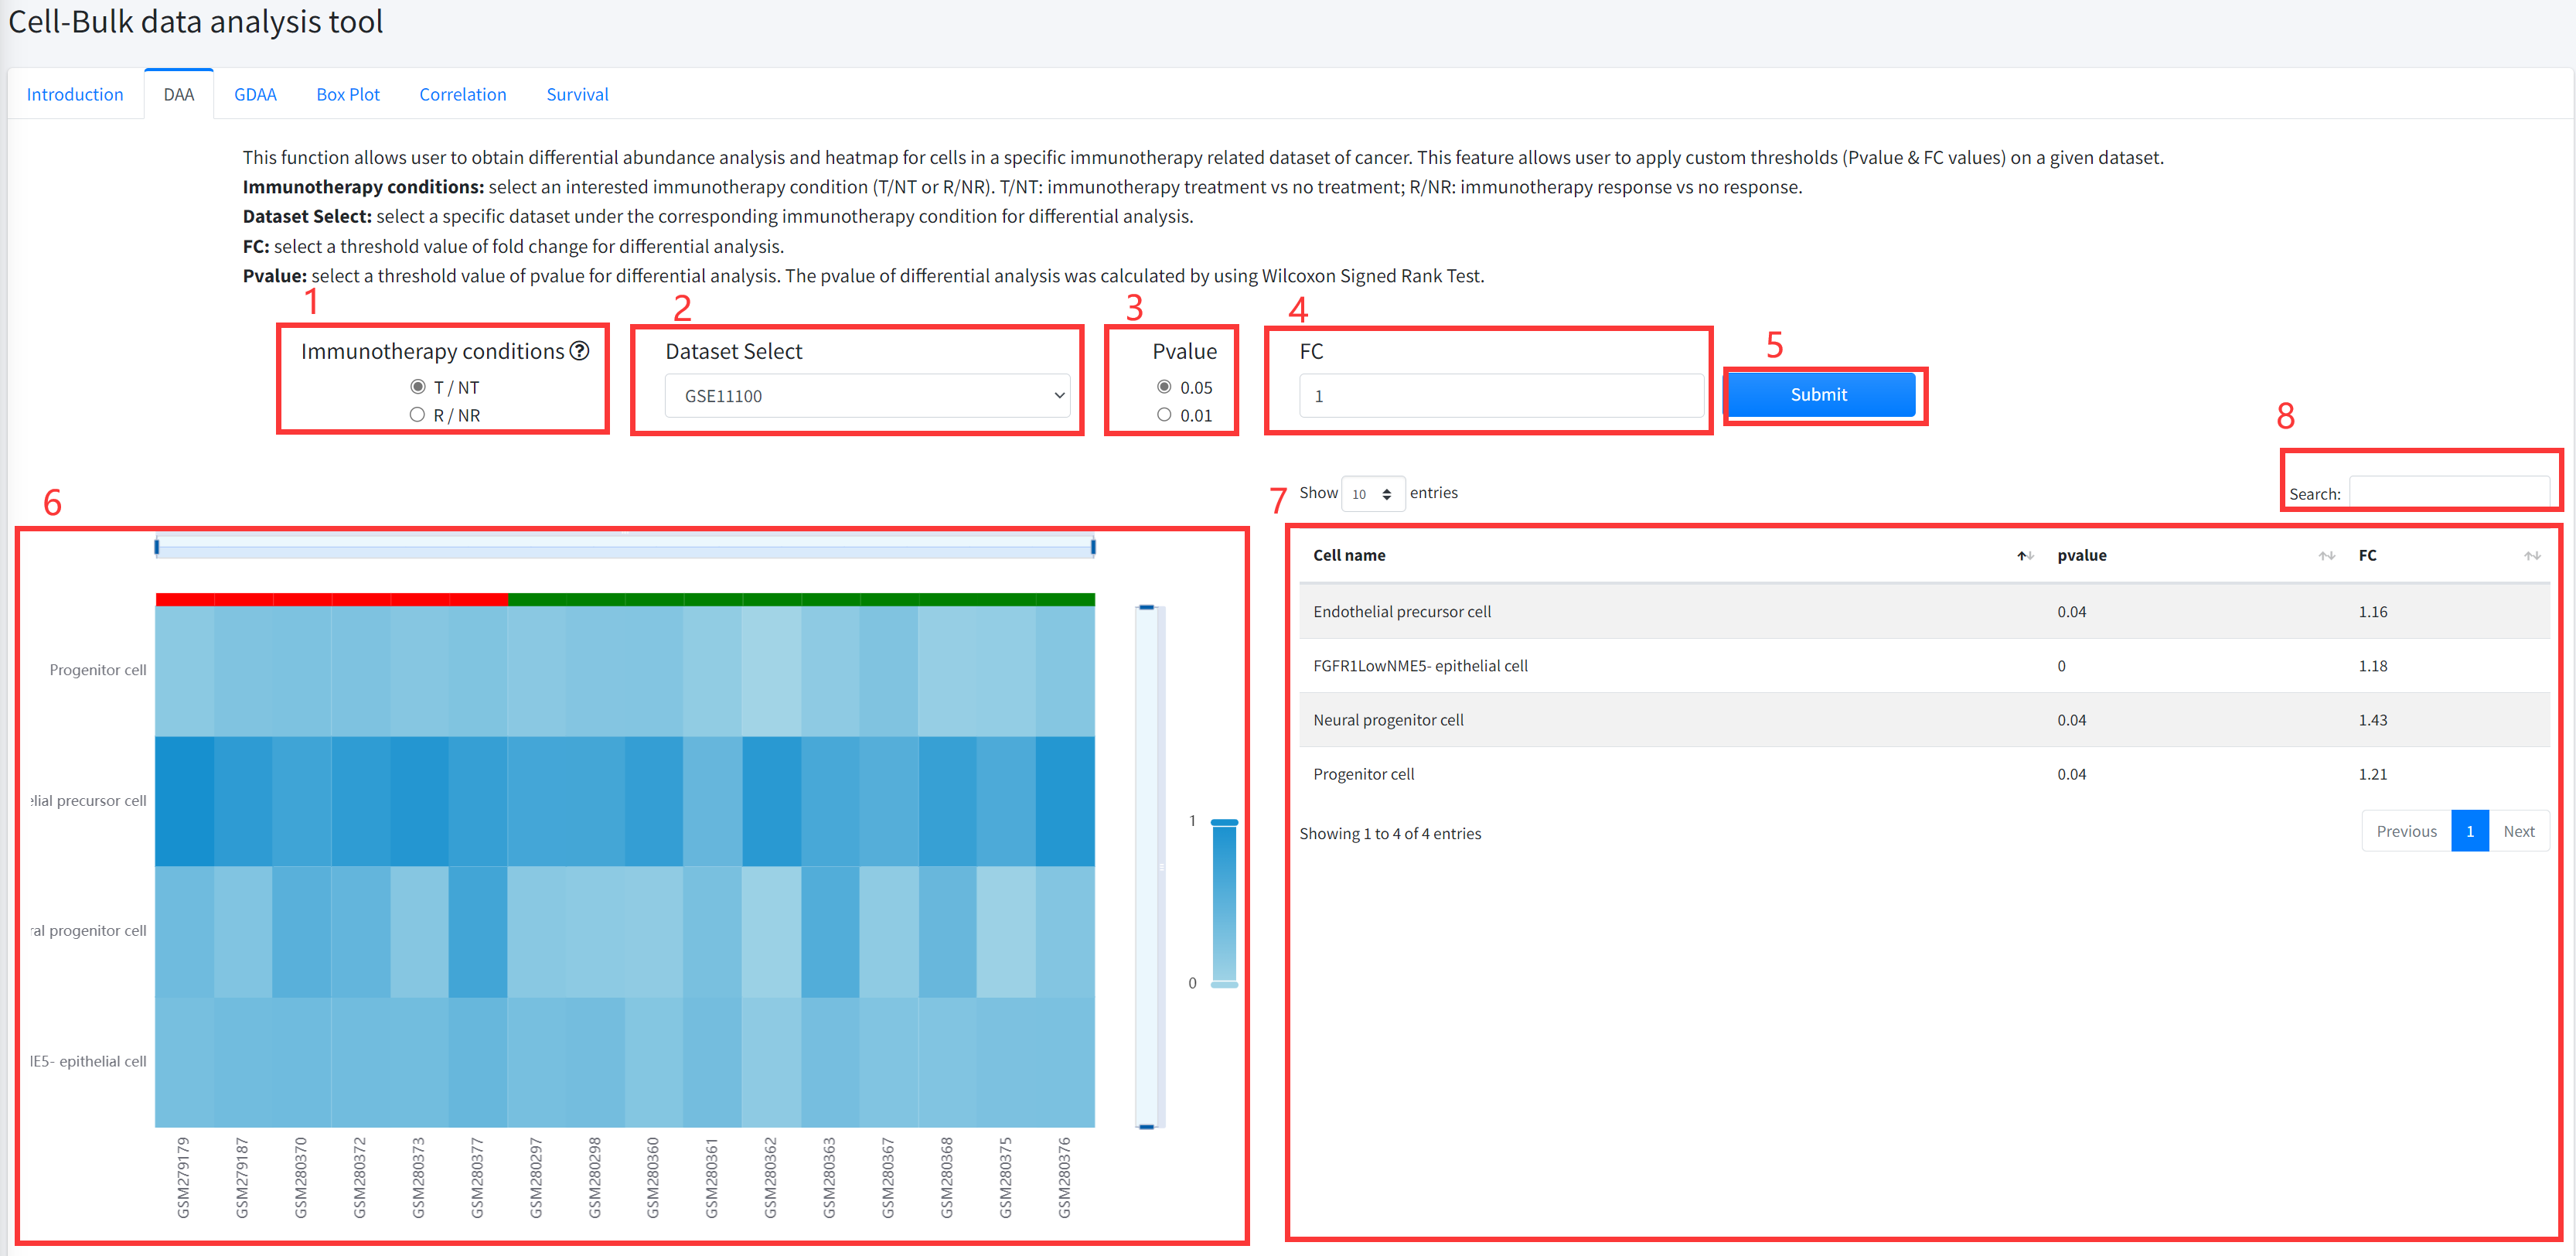
DAA
This function allows user to obtain differential abundance analysis and
heatmap for cell types in a specific immunotherapy related dataset of cancer is
displayed in Figure 7-2. The DAA includes comparing cancer immunotherapy treatment
vs no treatment, and immunotherapy response vs no response.
1. Select an interested immunotherapy condition (T/NT or R/NR). T/NT: immunotherapy treatment vs no treatment; R/NR: immunotherapy response vs no response.
2. Select a specific dataset under the corresponding immunotherapy condition for differential analysis.
3. Select a threshold value of pvalue for differential analysis. The pvalue of differential analysis was calculated by using Wilcoxon Signed Rank Test.
4. Select a threshold value of fold change for differential analysis.
5. Click the ‘Submit’ bottom to see results.
6. DAA function will generate a heatmap of differential cell types under the corresponding immunotherapy condition based on input parameters.
7. DAA function will generate a list of differential cell types under the corresponding immunotherapy condition based on input parameters.
8. Users can search for interesting cell type name from the result list. Fuzzy matching is supported.
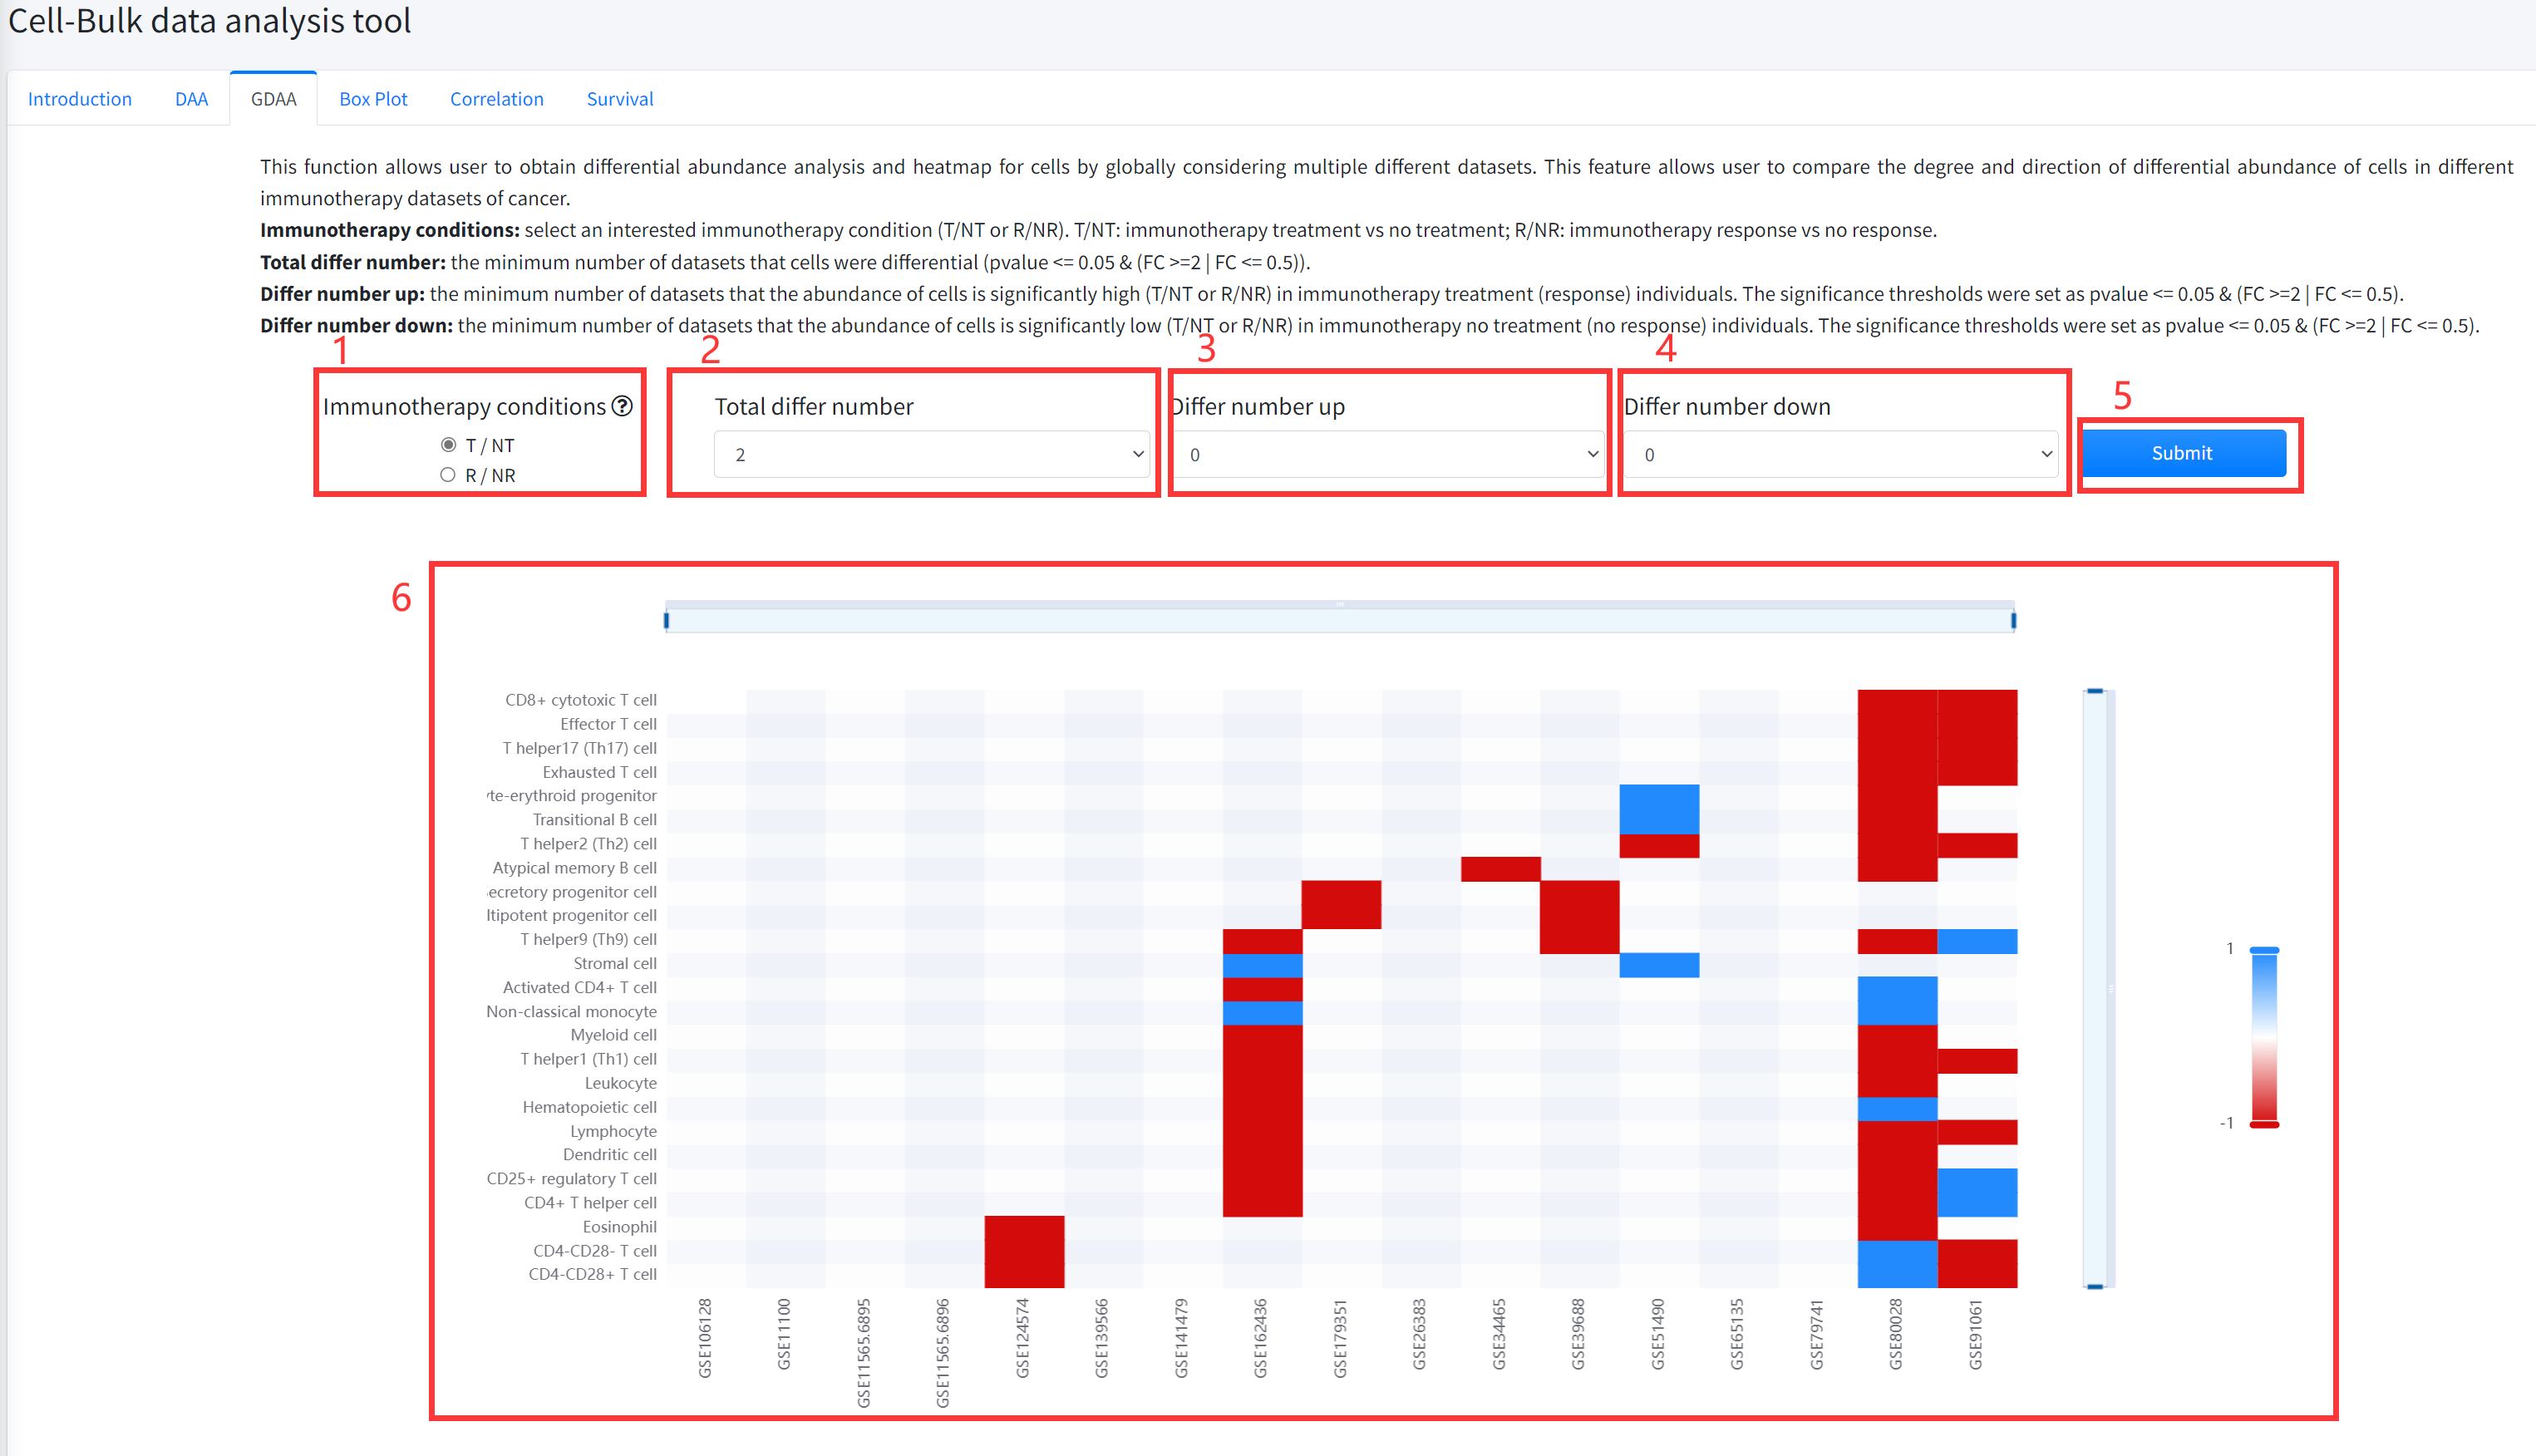
GDAA
This function allows user to obtain differential abundance analysis and heatmap for cell types by globally
considering multiple different datasets of cancer immunotherapy is displayed in Figure 7-3. This feature
allows user to compare the degree and direction of differential abundance of cells in different immunotherapy
datasets of cancer. The pvalue of differential analysis was calculated by using Wilcoxon Signed Rank Test.
1.Select an interested immunotherapy condition (T/NT or R/NR). T/NT: immunotherapy treatment vs no treatment; R/NR: immunotherapy response vs no response.
2. Select the minimum number of datasets that the abundance of cell types is differential (pvalue <= 0.05 & (FC >=2 | FC <= 0.5)).
3. Select the minimum number of datasets that the abundance of cells is significantly high (T/NT or R/NR) in immunotherapy treatment (response) individuals. The significance
thresholds were set as pvalue <= 0.05 & (FC >=2 | FC <= 0.5).
4. Select the minimum number of datasets that the abundance of cells is significantly low (T/NT or R/NR) in immunotherapy no treatment (no response) individuals.
The significance thresholds were set as pvalue <= 0.05 & (FC >=2 | FC <= 0.5).
5. Click the ‘Submit’ bottom to see results.
6. GDEA function will generate a heatmap of differential cell types across different datasets under the corresponding immunotherapy condition based on input parameters. ‘red’ color in the heatmap represents the abundance is significantly high (T/NT or R/NR) in immunotherapy treatment (response) individuals and ‘bule’ color in the heatmap represents the abundance is significantly low (T/NT or R/NR) in immunotherapy no treatment (no response) individuals.
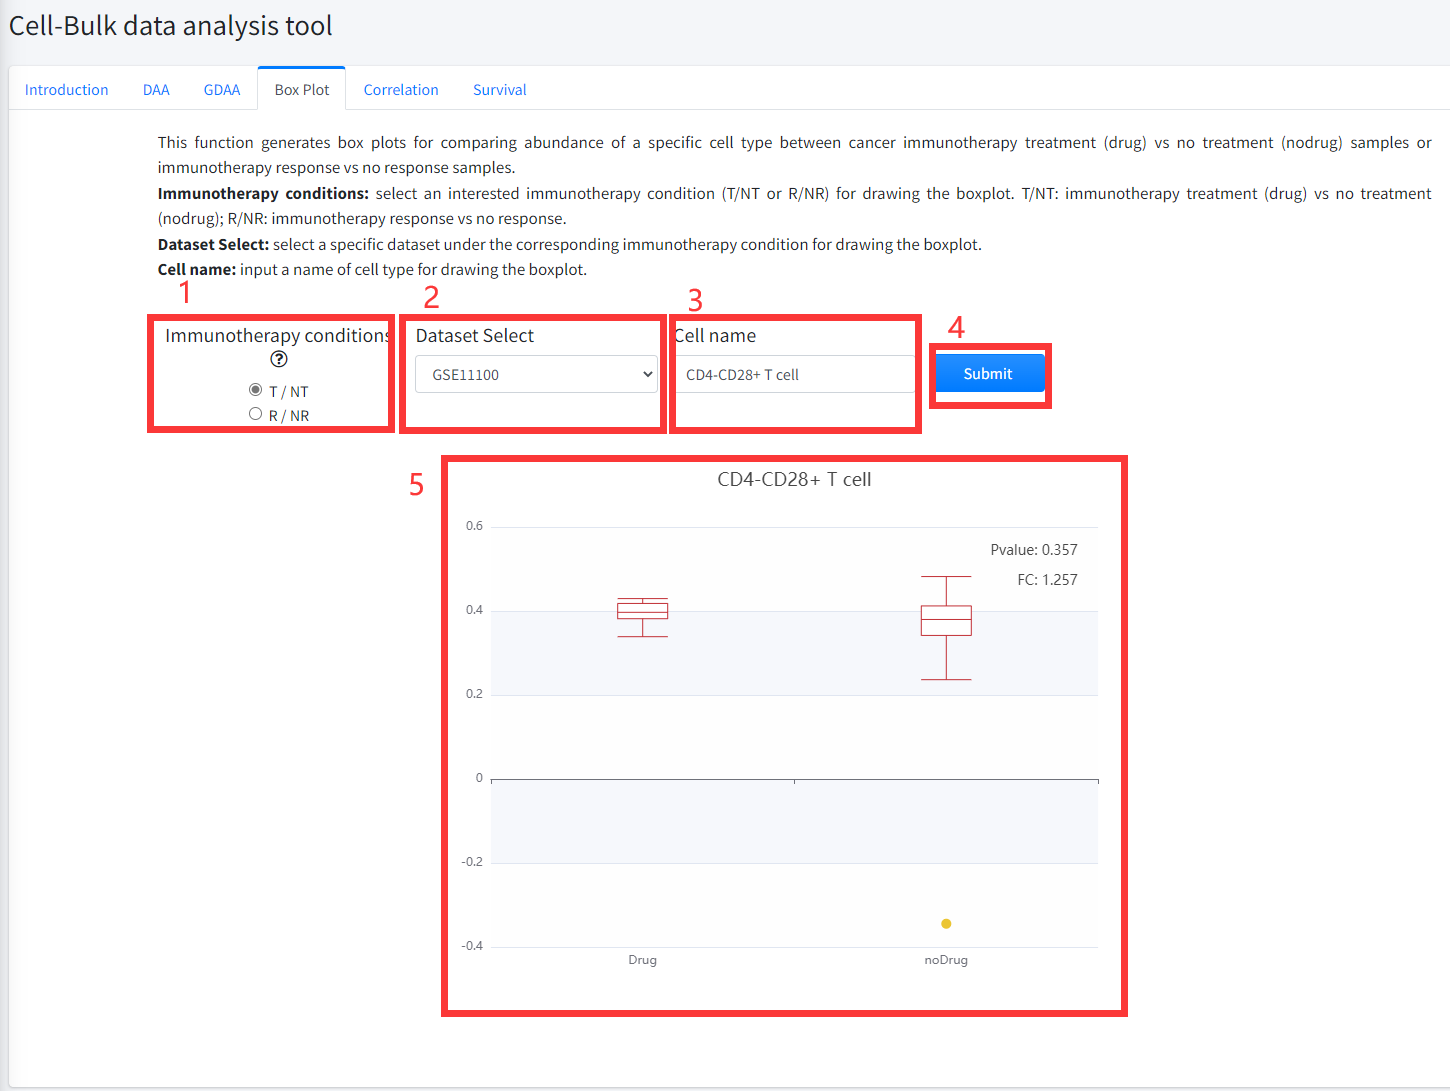
Box Plot
This function generates box plots for comparing abundance of a specific cell type between cancer immunotherapy treatment
(Drug) vs no treatment (noDrug) samples or immunotherapy response vs no response samples is displayed in Figure 7-4.
1.Select an interested immunotherapy condition (T/NT or R/NR) for drawing the boxplot. T/NT: immunotherapy treatment vs no treatment;
R/NR: immunotherapy response vs no response.
2. Select a specific dataset under the corresponding immunotherapy condition for drawing the boxplot.
3. Input a cell type name for drawing the boxplot.
4. Click the ‘Submit’ bottom to see results.
5. Boxplot function will generate a boxplot for comparing abundance of cell type under the corresponding immunotherapy condition based on input parameters. The pvalue in boxplot was calculated by using Wilcoxon Signed Rank Test.
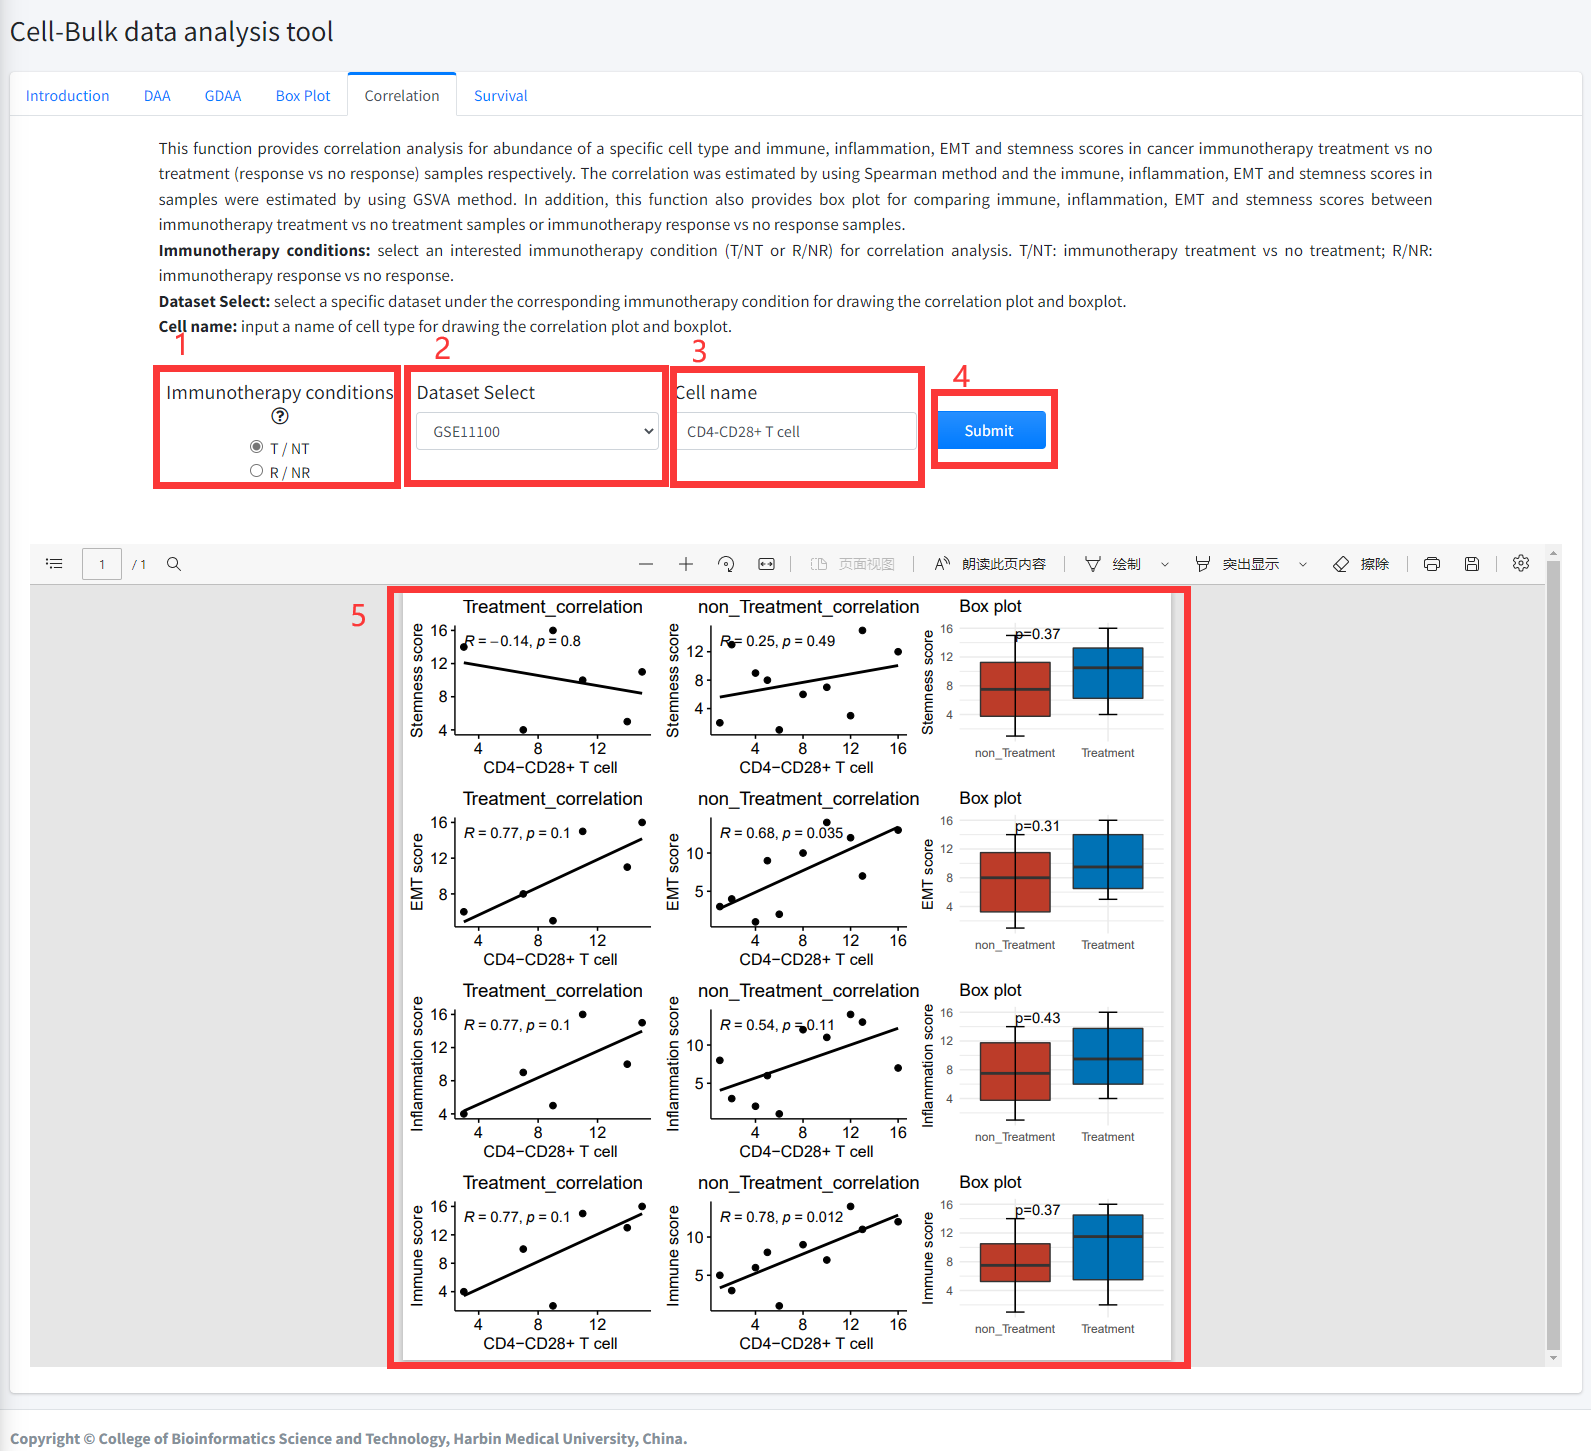
Correlation
This function provides correlation analysis for abundance of a specific
cell type and immune, inflammation, EMT and stemness scores in
cancer immunotherapy treatment vs no treatment (response vs
no response) samples respectively. The correlation was estimated
by using Spearman method and the immune, inflammation, EMT and
stemness scores in samples were estimated by using GSVA method.
In addition, this function also provides box plot for comparing
immune, inflammation, EMT and stemness scores between cancer immunotherapy
treatment vs no treatment samples or immunotherapy response vs no
response samples. This function is displayed in Figure 6-5.
1. Select an interested immunotherapy condition (T/NT or R/NR) for correlation analysis. T/NT: immunotherapy treatment vs no
treatment; R/NR: immunotherapy response vs no response.
2. Select a specific dataset under the corresponding immunotherapy condition for drawing the correlation plot and boxplot.
3. Input a cell type name for drawing the correlation plot and boxplot.
4. Click the ‘Submit’ bottom to see results.
5. Correlation function will generate scatter diagrams of a specific cell type and immune, inflammation, EMT and stemness scores in cancer immunotherapy treatment
vs no treatment (response vs no response) samples respectively using correlation analysis based on input parameters. Correlation function will also generate boxplots for comparing immune, inflammation, EMT and stemness scores under the corresponding immunotherapy condition based on input parameters. The pvalue in boxplot was calculated by using Wilcoxon Signed Rank Test
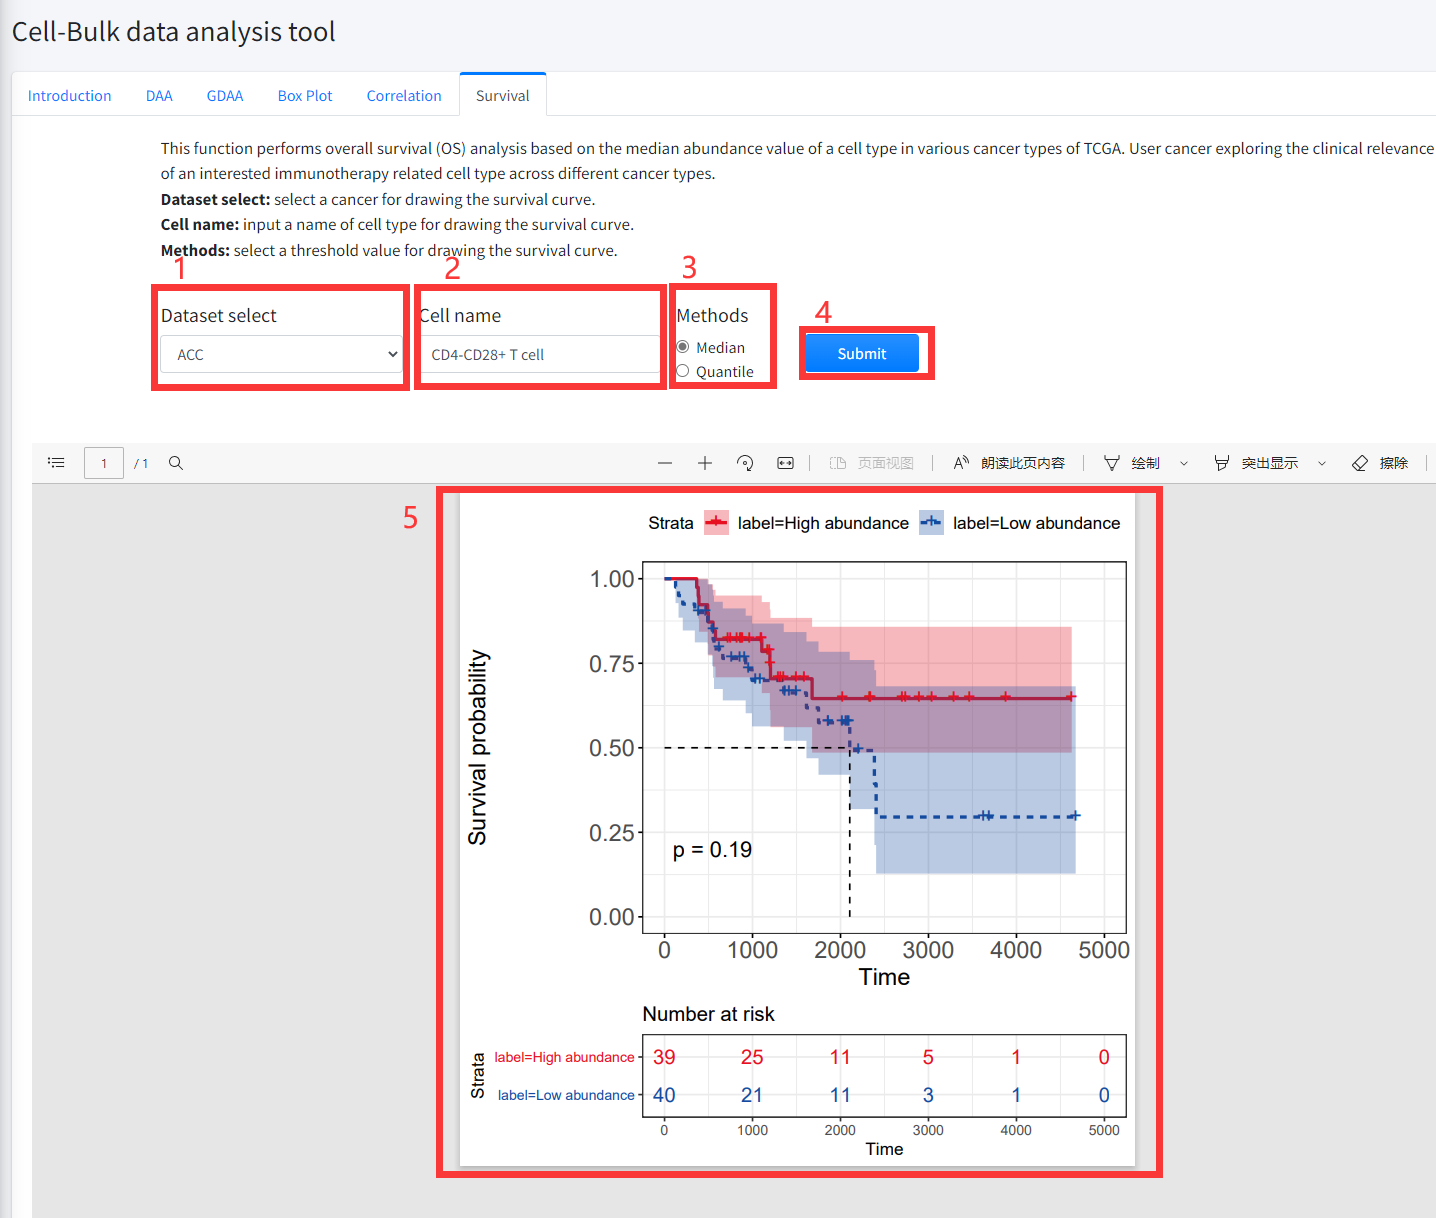
Survival
This function performs overall survival (OS) analysis based on the median
(quantile) abundance value of a cell type in various cancer types of TCGA
is displayed in Figure 7-6. User cancer exploring the clinical relevance of
an interested immunotherapy related cell type across different cancer types.
1. Select a cancer for drawing the survival curve.
2. Input a cell type name for drawing the survival curve.
3. Select a threshold value for drawing the survival curve.
4. Click the ‘Submit’ bottom to see results.
5. Survival function will generate a survival curve for overall survival based on input parameters.
Gene-Single cell data analysis tool
The Gene-Single cell data analysis tool provides key interactive and customizable
functions including differential expression analysis (DEA), global differential expression
analysis (GDEA), box plotting, clustering, Cluster Activity and function enrichment based
on 13 single cell datasets of cancer immunotherapy including 307485 cells from 7 cancer types.
The Gene-Single cell data analysis tool enables users to flexibly discovery and explore the association
between genes and cancer immunotherapy, analyze the function and mechanism of immunotherapy-related genes
base on single cell datasets of cancer immunotherapy. In addition, user can explore gene expression in
tumor microenvironment cells of immunotherapy-related samples.
Introduction
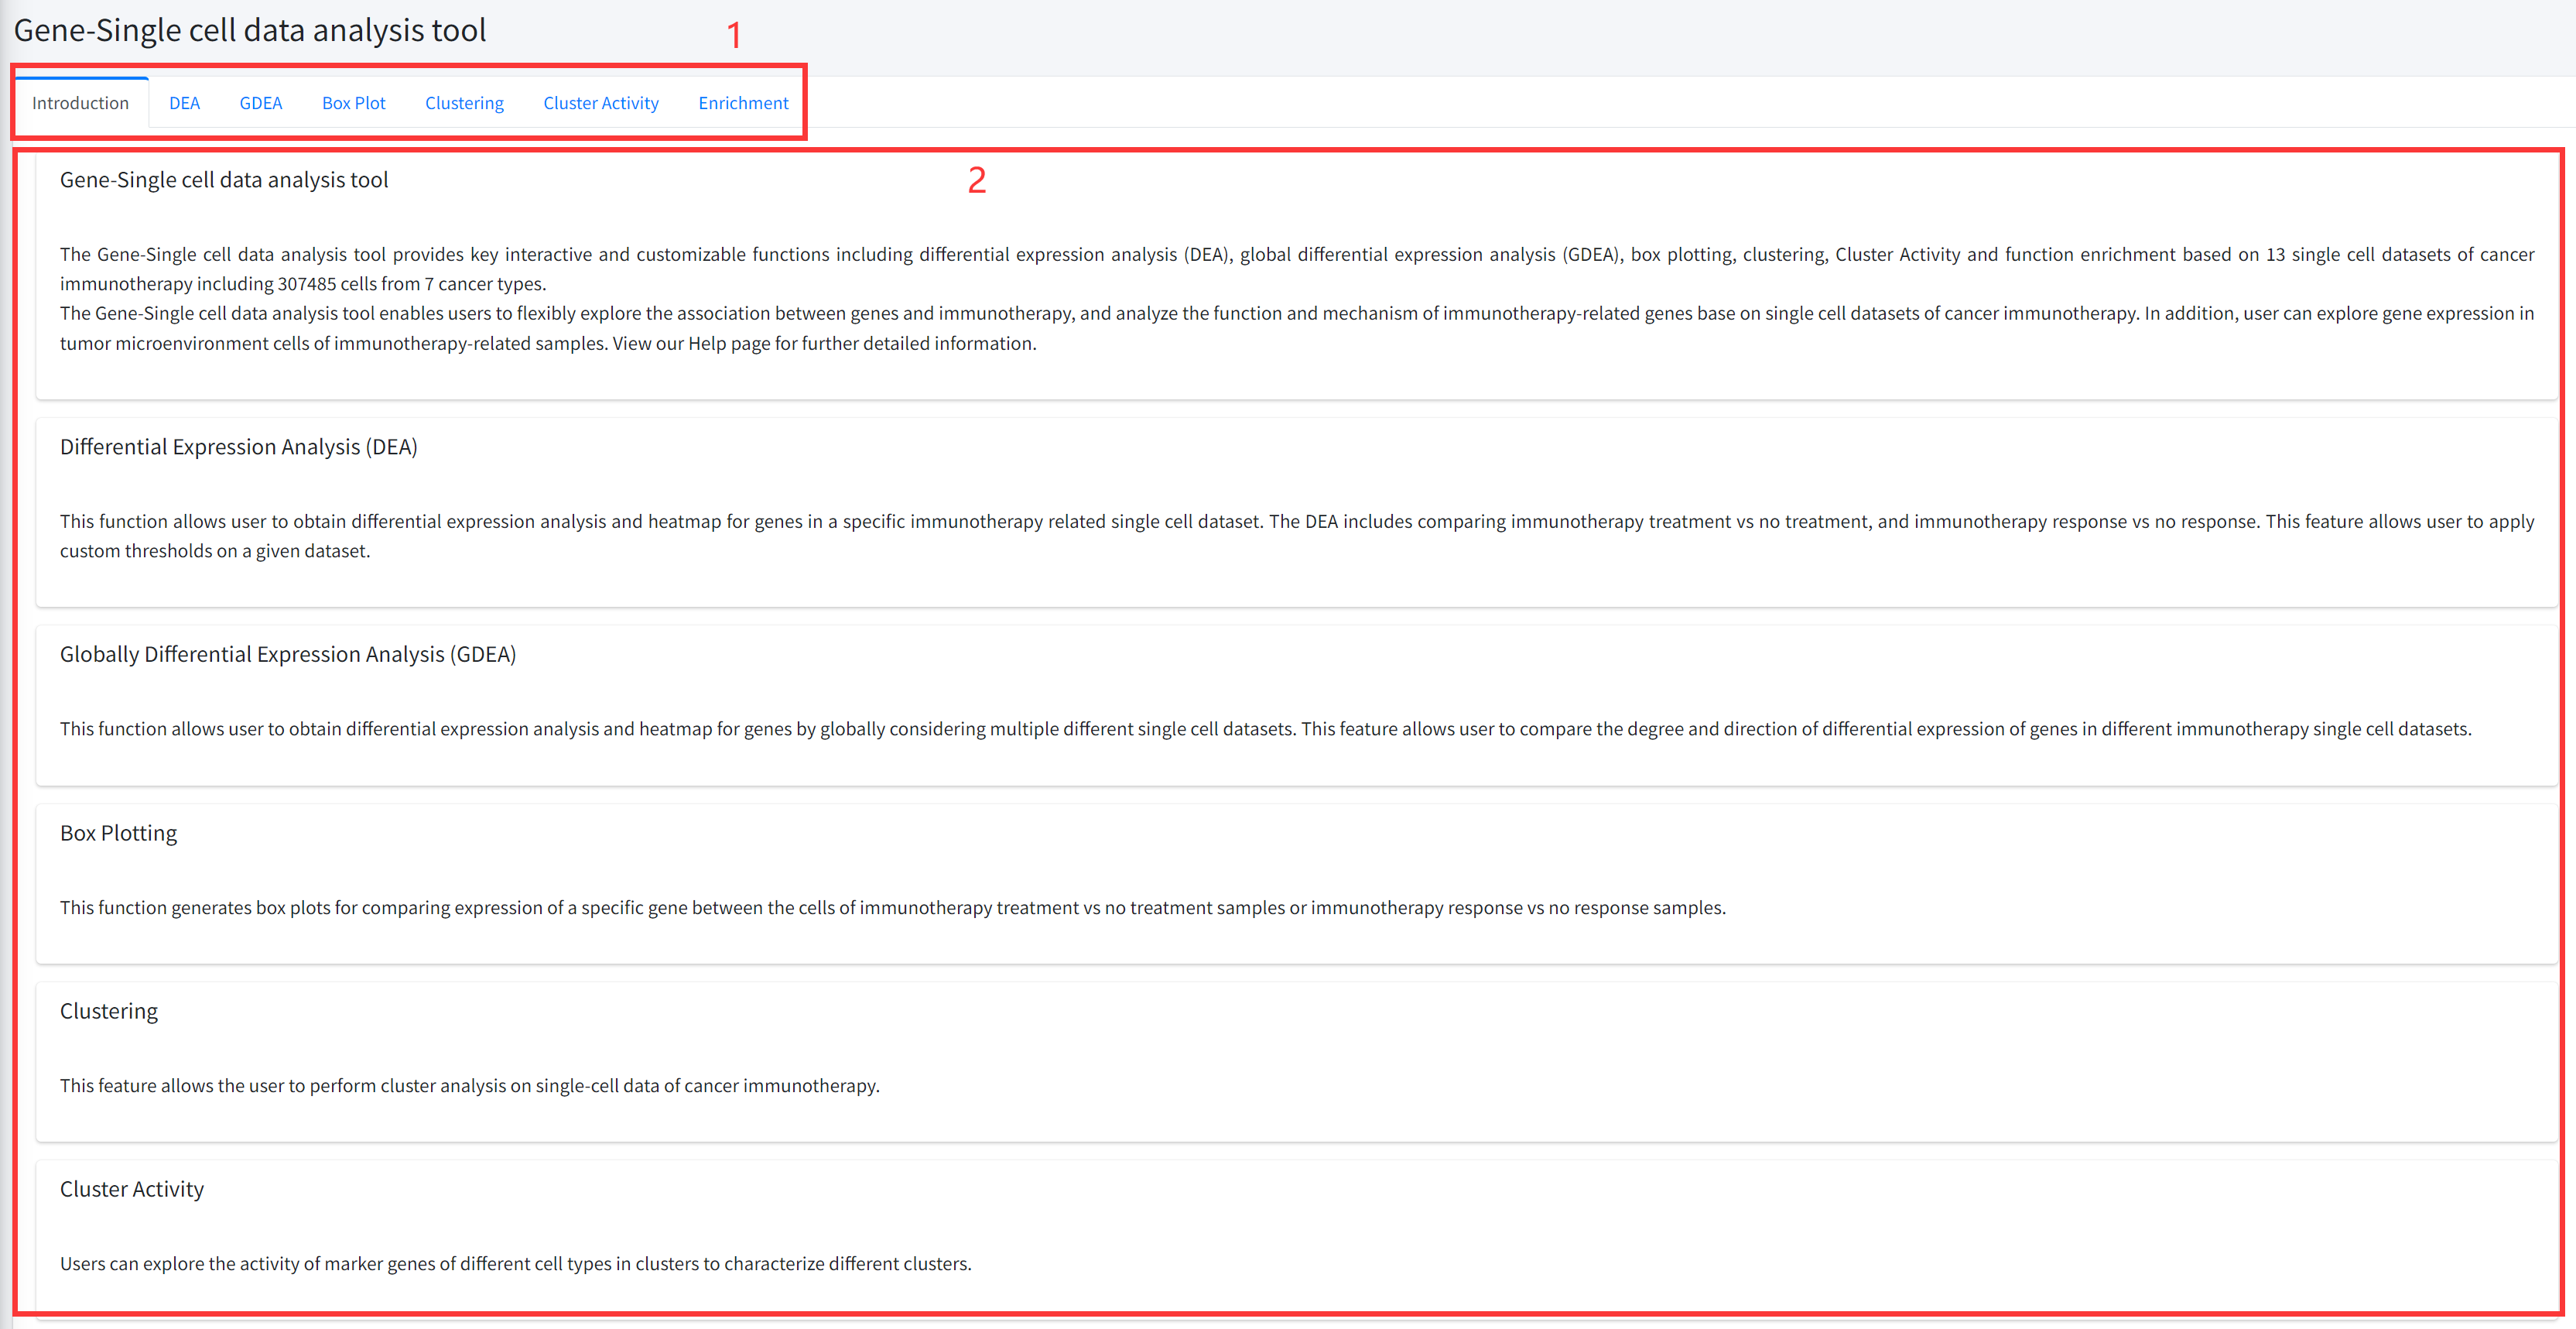
Detailed information of the Gene-Single cell data analysis tool contains six key functions
for discovering and characterizing immunotherapy-related genes based on single cell datasets
of cancer immunotherapy is displayed in Figure 6-1:
1. Main functions of the Gene-Single cell data analysis tool are provided in menu bar form (boxed in red).
2. Detailed introduction of main functions of Gene-Single cell data analysis tool.
DEA
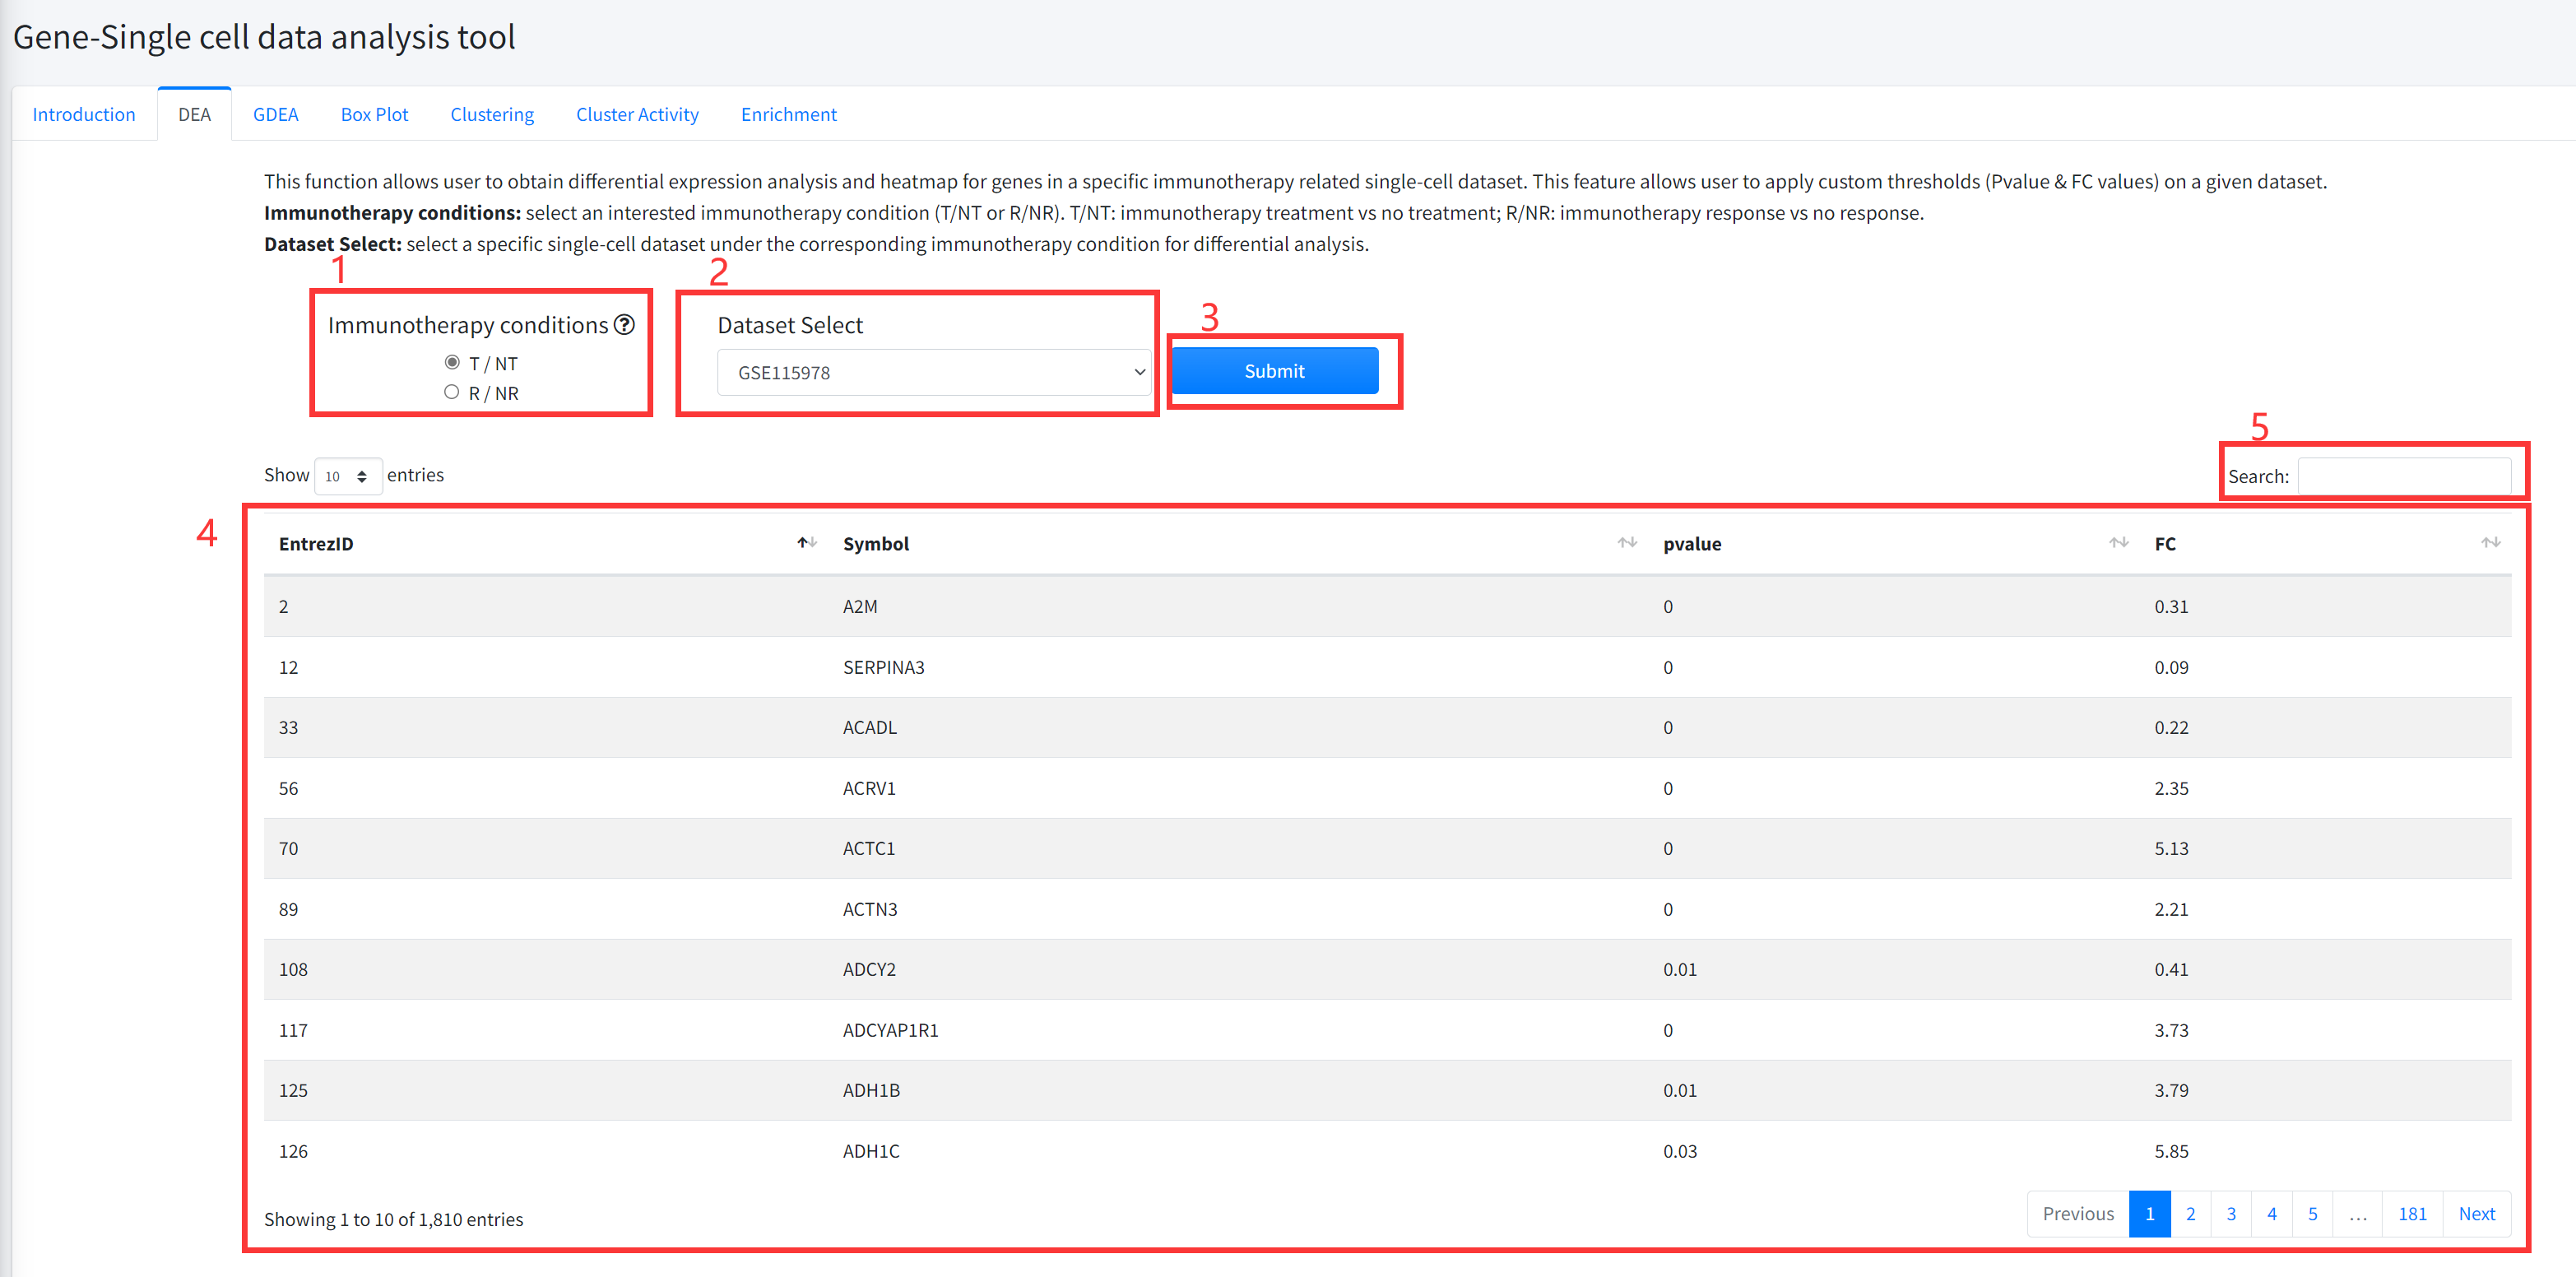
This function allows user to obtain differential expression analysis for
genes in a specific immunotherapy related single cell dataset is displayed in
Figure 6-2. The DEA includes comparing cancer immunotherapy vs no treatment,
and immunotherapy response vs no response.
1. Select an interested immunotherapy condition (T/NT or R/NR). T/NT: immunotherapy treatment
vs no treatment; R/NR: immunotherapy response vs no response.
2. Select a specific dataset under the corresponding immunotherapy condition for differential analysis.
3. Click the ‘Submit’ bottom to see results.
4. DEA function will generate a list of differentially expressed genes (Wilcoxon rank test pvalue <= 0.05 &
(FC >=2 | FC <= 0.5)) under the corresponding immunotherapy condition based on input parameters.
GDEA
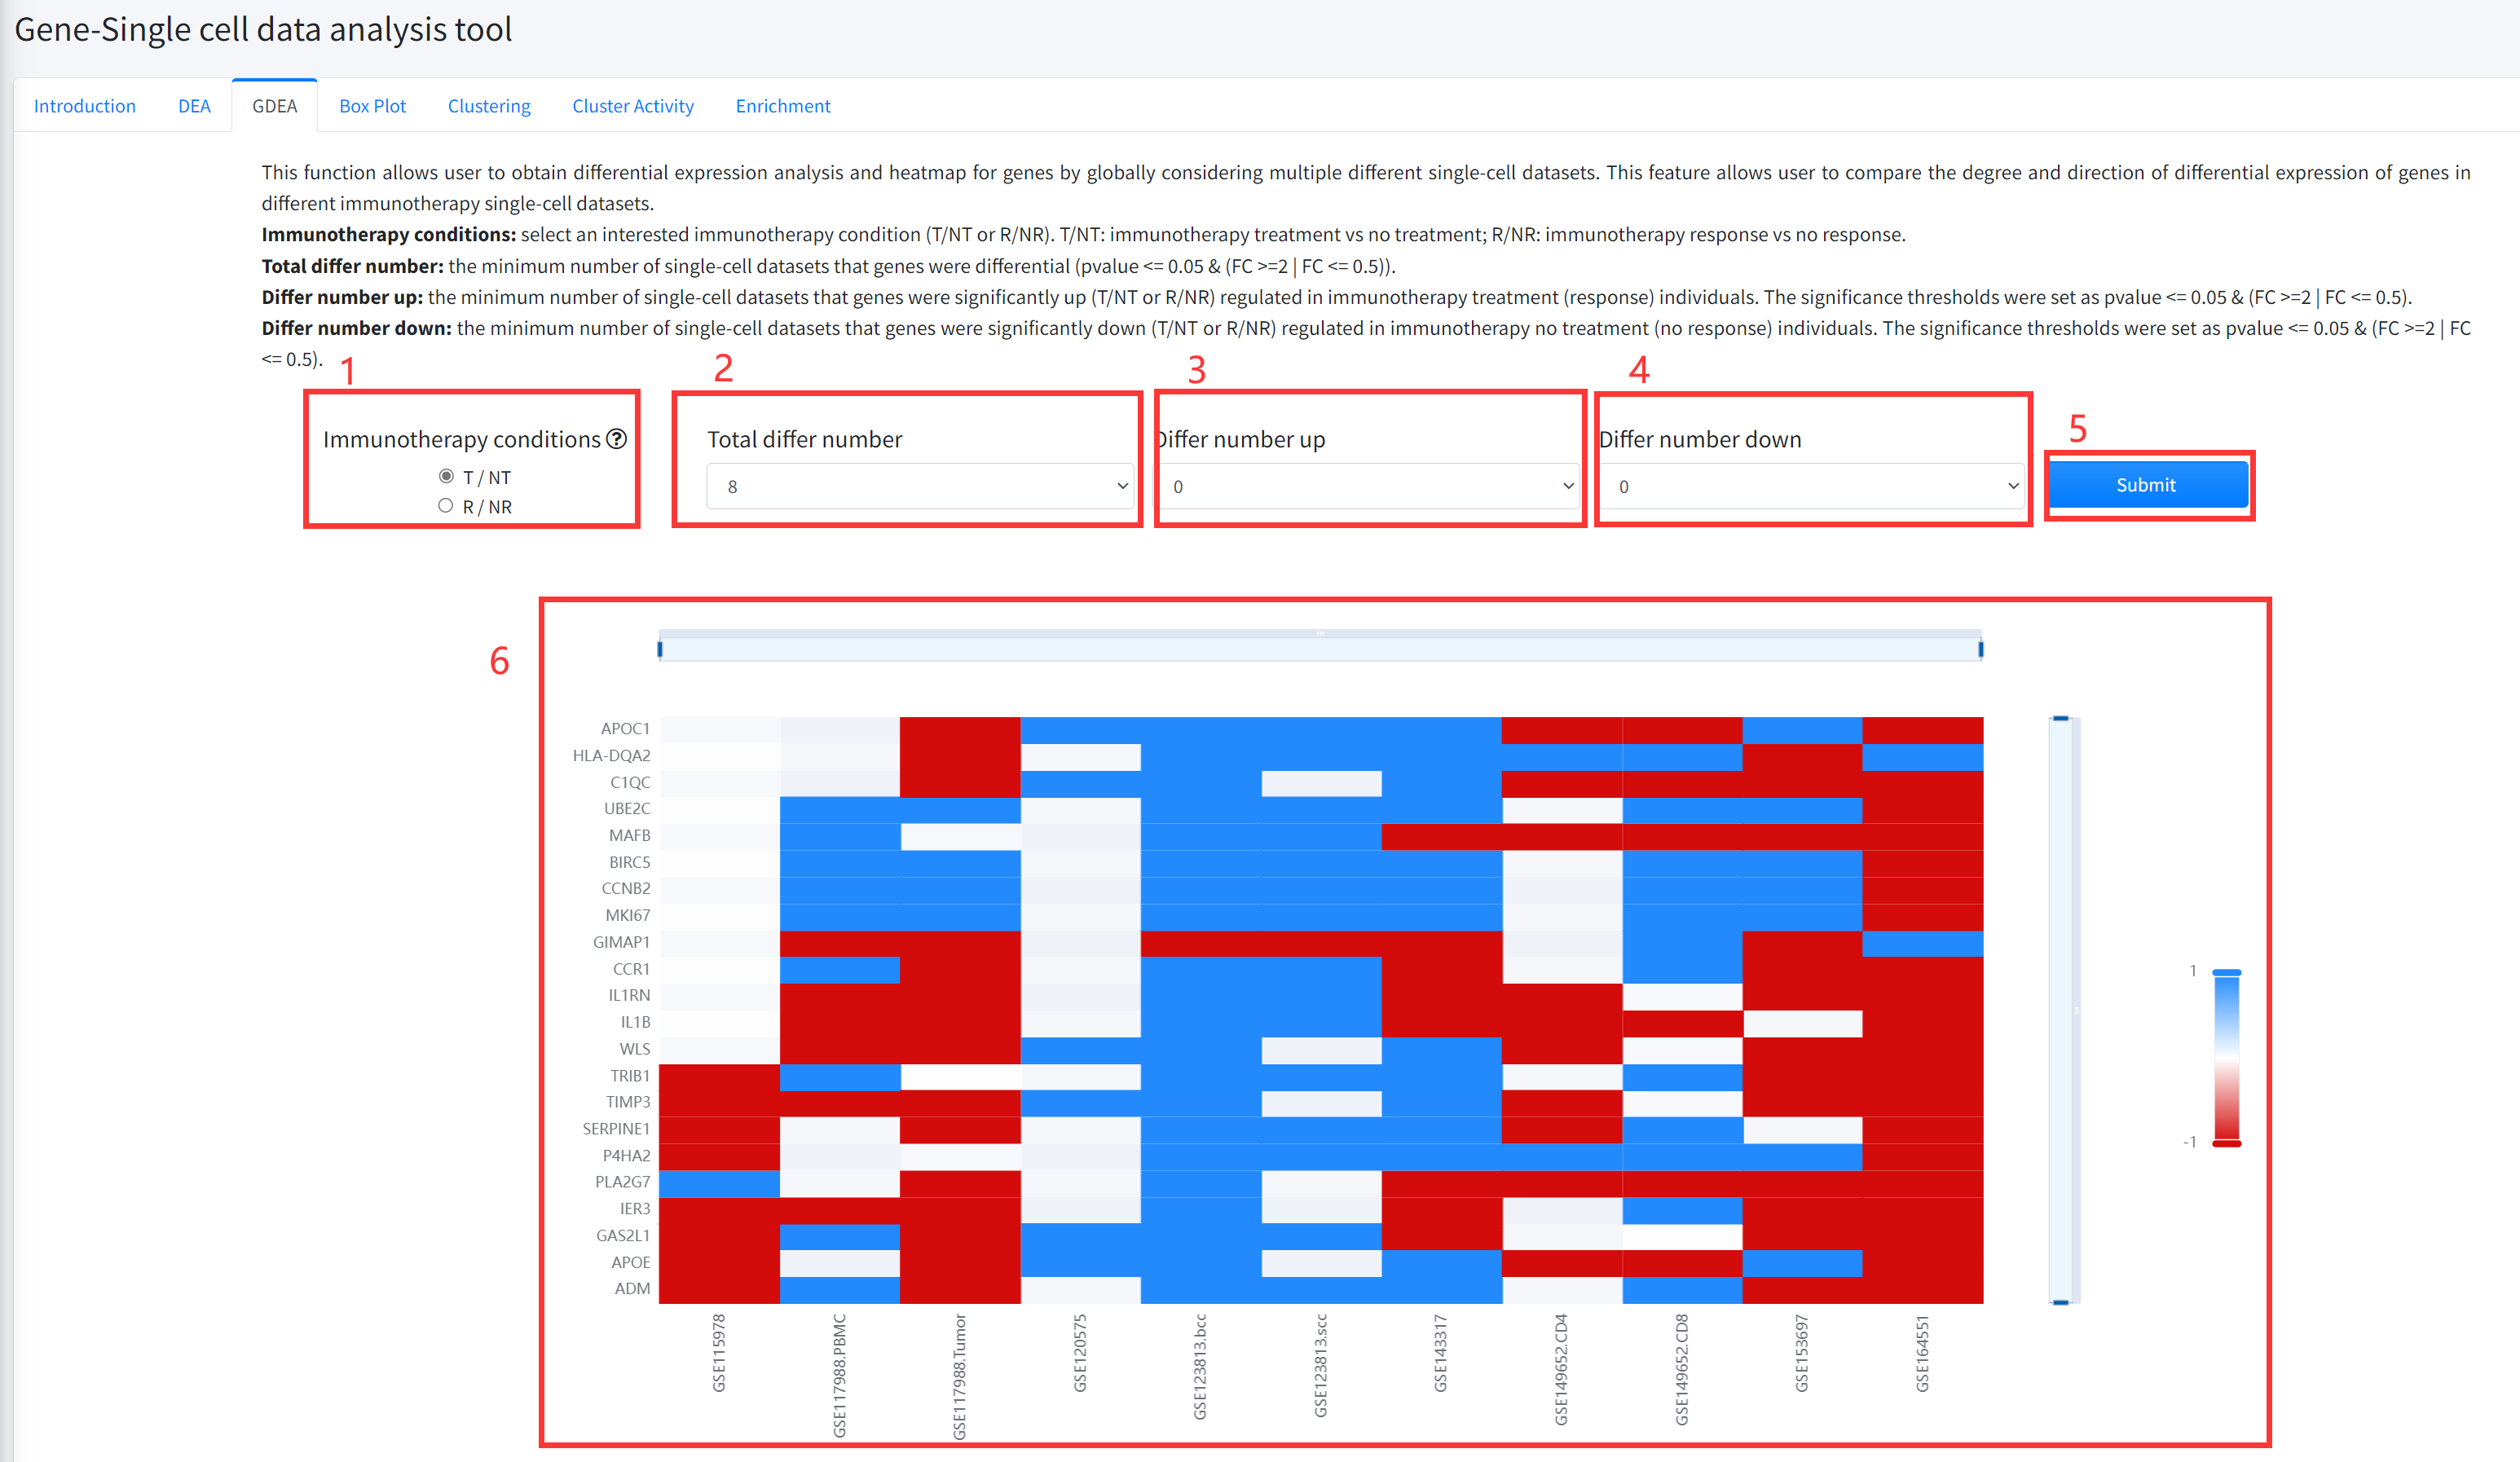
This function allows user to obtain differential expression analysis and heatmap for genes by globally
considering multiple different single cell datasets is displayed in Figure 6-3. This feature allows user
to compare the degree and direction of differential expression of genes in different immunotherapy single
cell datasets. The pvalue of differential analysis was calculated by using Wilcoxon Signed Rank Test.
1.Select an interested immunotherapy condition (T/NT or R/NR). T/NT: immunotherapy treatment vs no treatment;
R/NR: immunotherapy response vs no response.
2. Select the total number of cancer immunotherapy datasets that genes were differential (pvalue <= 0.05 & (FC >=2 | FC <= 0.5)).
3. Select the minimum number of single-cell datasets that genes were significantly up (T/NT or R/NR) regulated
in immunotherapy treatment (response) individuals. The significance thresholds were set as pvalue <= 0.05 & (FC >=2 | FC <= 0.5).
4. Select the minimum number of single-cell datasets that genes were significantly down (T/NT or R/NR) regulated
in immunotherapy no treatment (no response) individuals. The significance thresholds were set as pvalue <= 0.05 & (FC >=2 | FC <= 0.5).
5. Click the ‘Submit’ bottom to see results.
6. GDEA function will generate a heatmap of differentially expressed genes across different datasets of cancer
immunotherapy under the corresponding immunotherapy condition based on input parameters. ‘red’ color in the heatmap
represents significantly up (T/NT or R/NR) regulated in immunotherapy treatment (response) individuals, and ‘bule’
color in the heatmap represents significantly down (T/NT or R/NR) regulated in immunotherapy no treatment (no response) individuals.
Box Plot
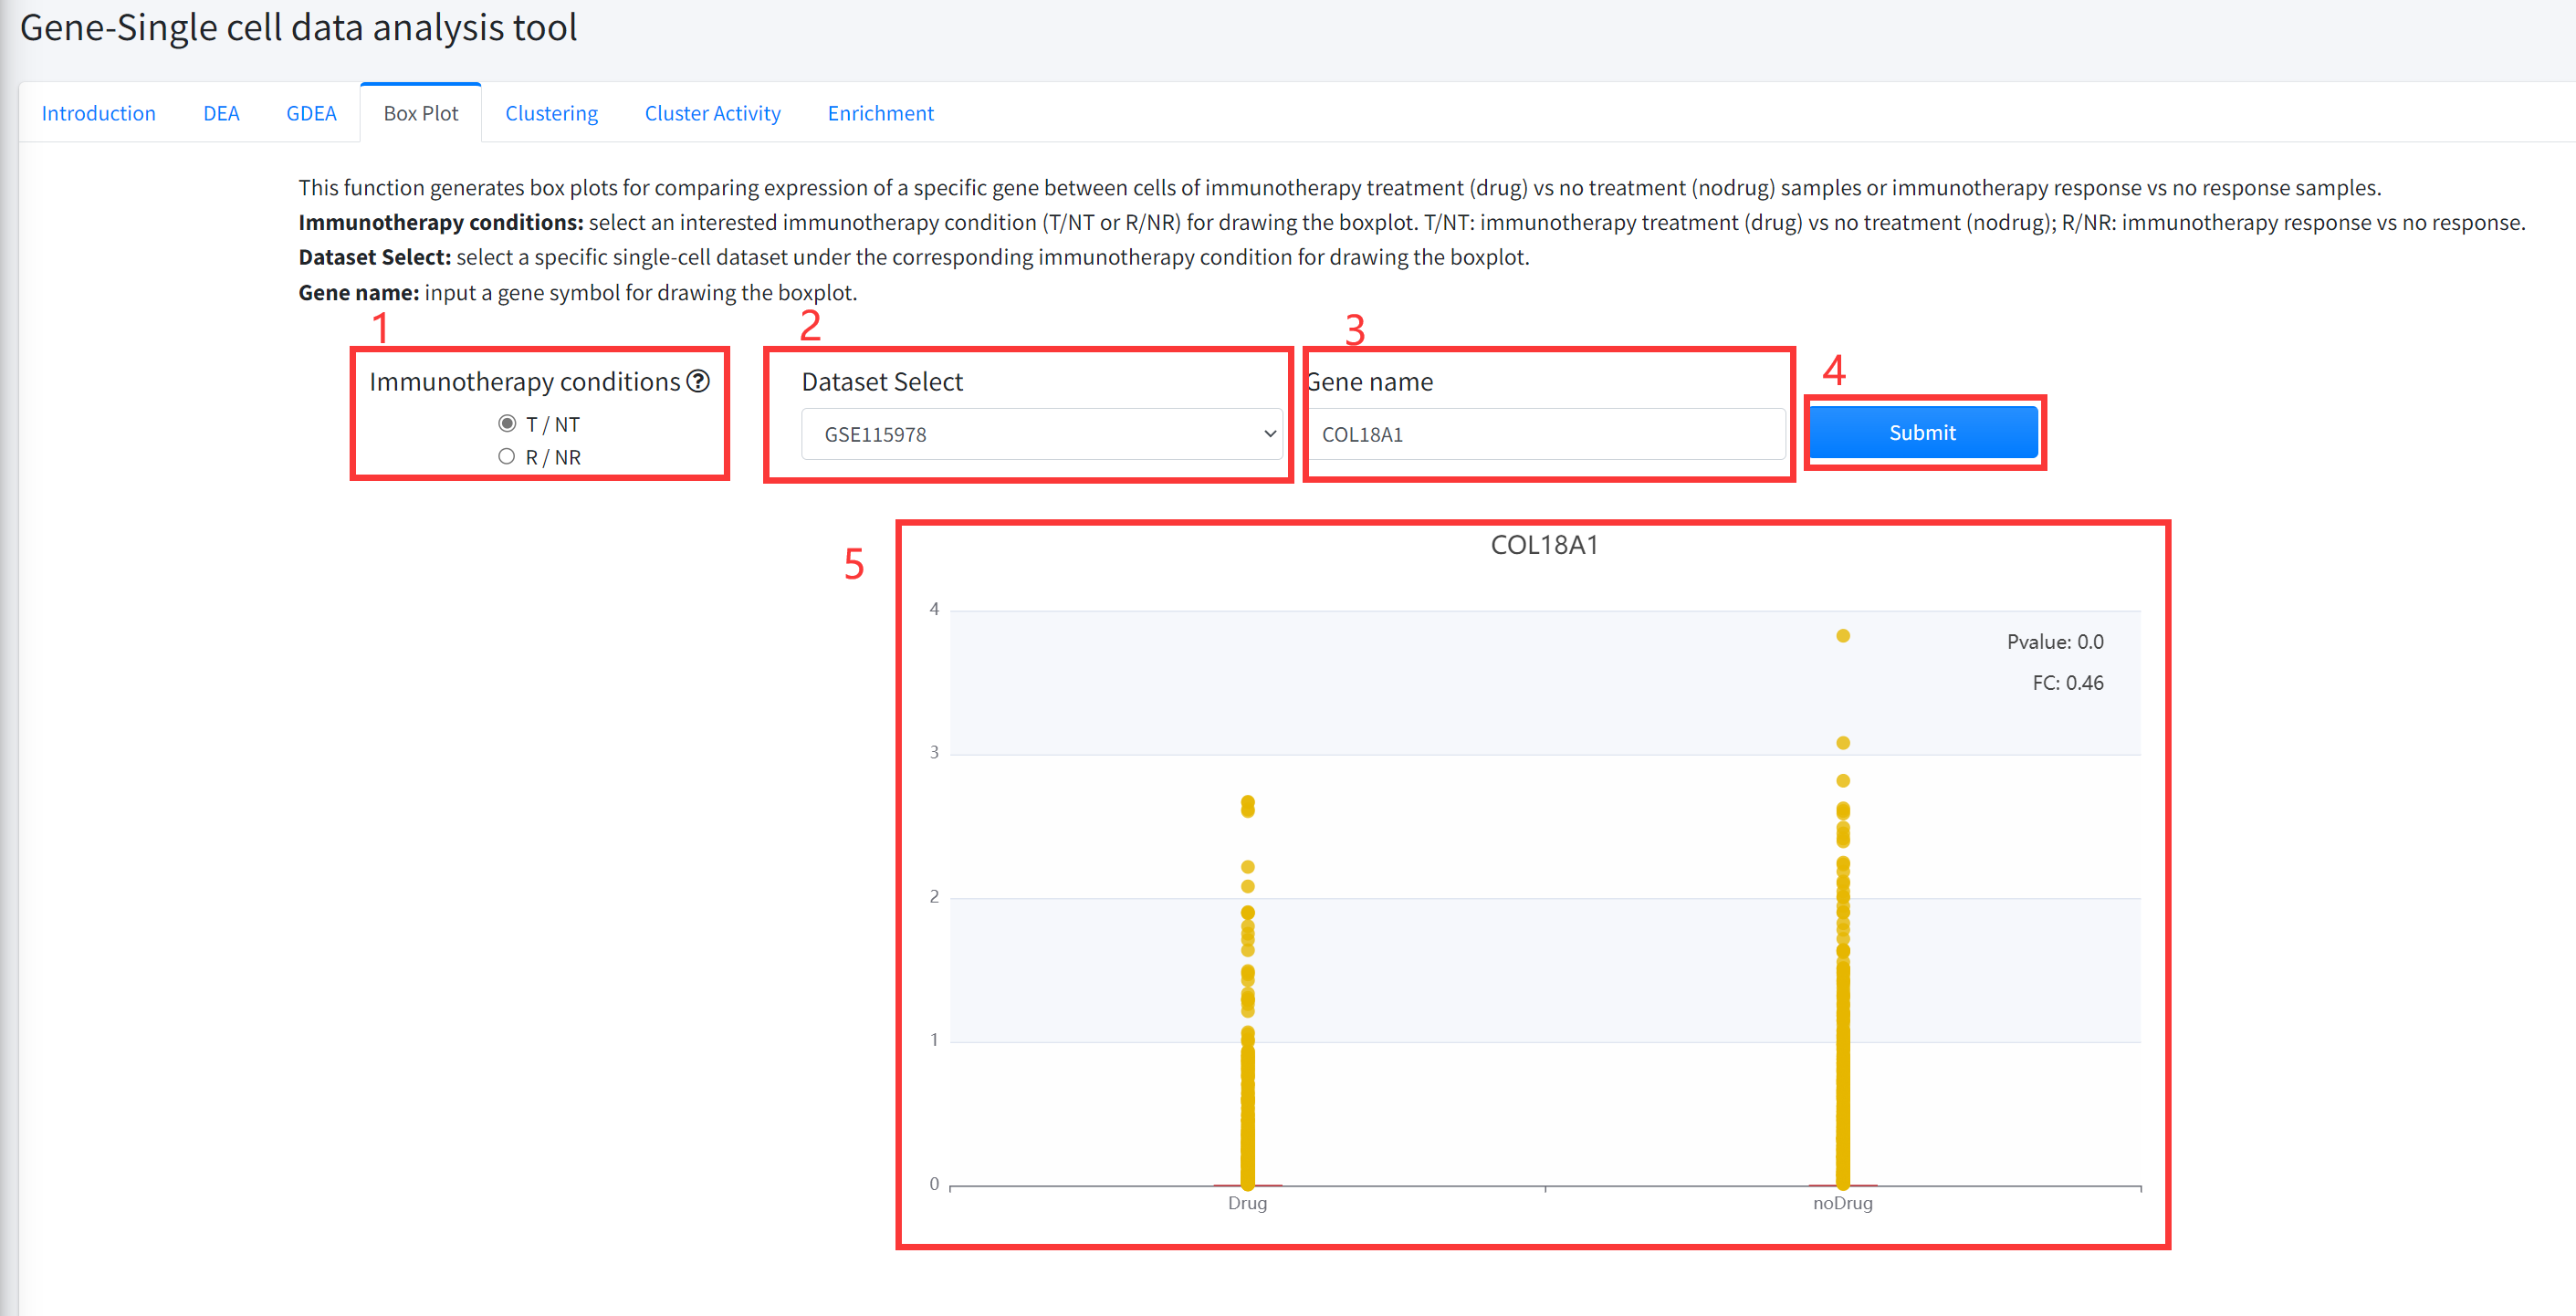
This function generates box plots for comparing expression of a specific gene between cells of cancer
immunotherapy treatment (Drug) vs no treatment (noDrug) samples or immunotherapy response vs no response
samples is displayed in Figure 6-4. Results for significantly differential (Wilcoxon Rank Test pvalue <= 0.05 &
(FC >=2 | FC <= 0.5)) genes can be shown.
1.Select an interested immunotherapy condition (T/NT or R/NR) for drawing the boxplot. T/NT: immunotherapy
treatment (Drug) vs no treatment (noDrug); R/NR: immunotherapy response vs no response.
2. Select a specific single cell dataset under the corresponding immunotherapy condition for drawing the boxplot.
3. Input a gene symbol for drawing the boxplot.
4. Click the ‘Submit’ bottom to see results.
5. Boxplot function will generate a boxplot for comparing expression of gene under the corresponding immunotherapy
condition based on input parameters. The pvalue in boxplot was calculated by using Wilcoxon Signed Rank Test.
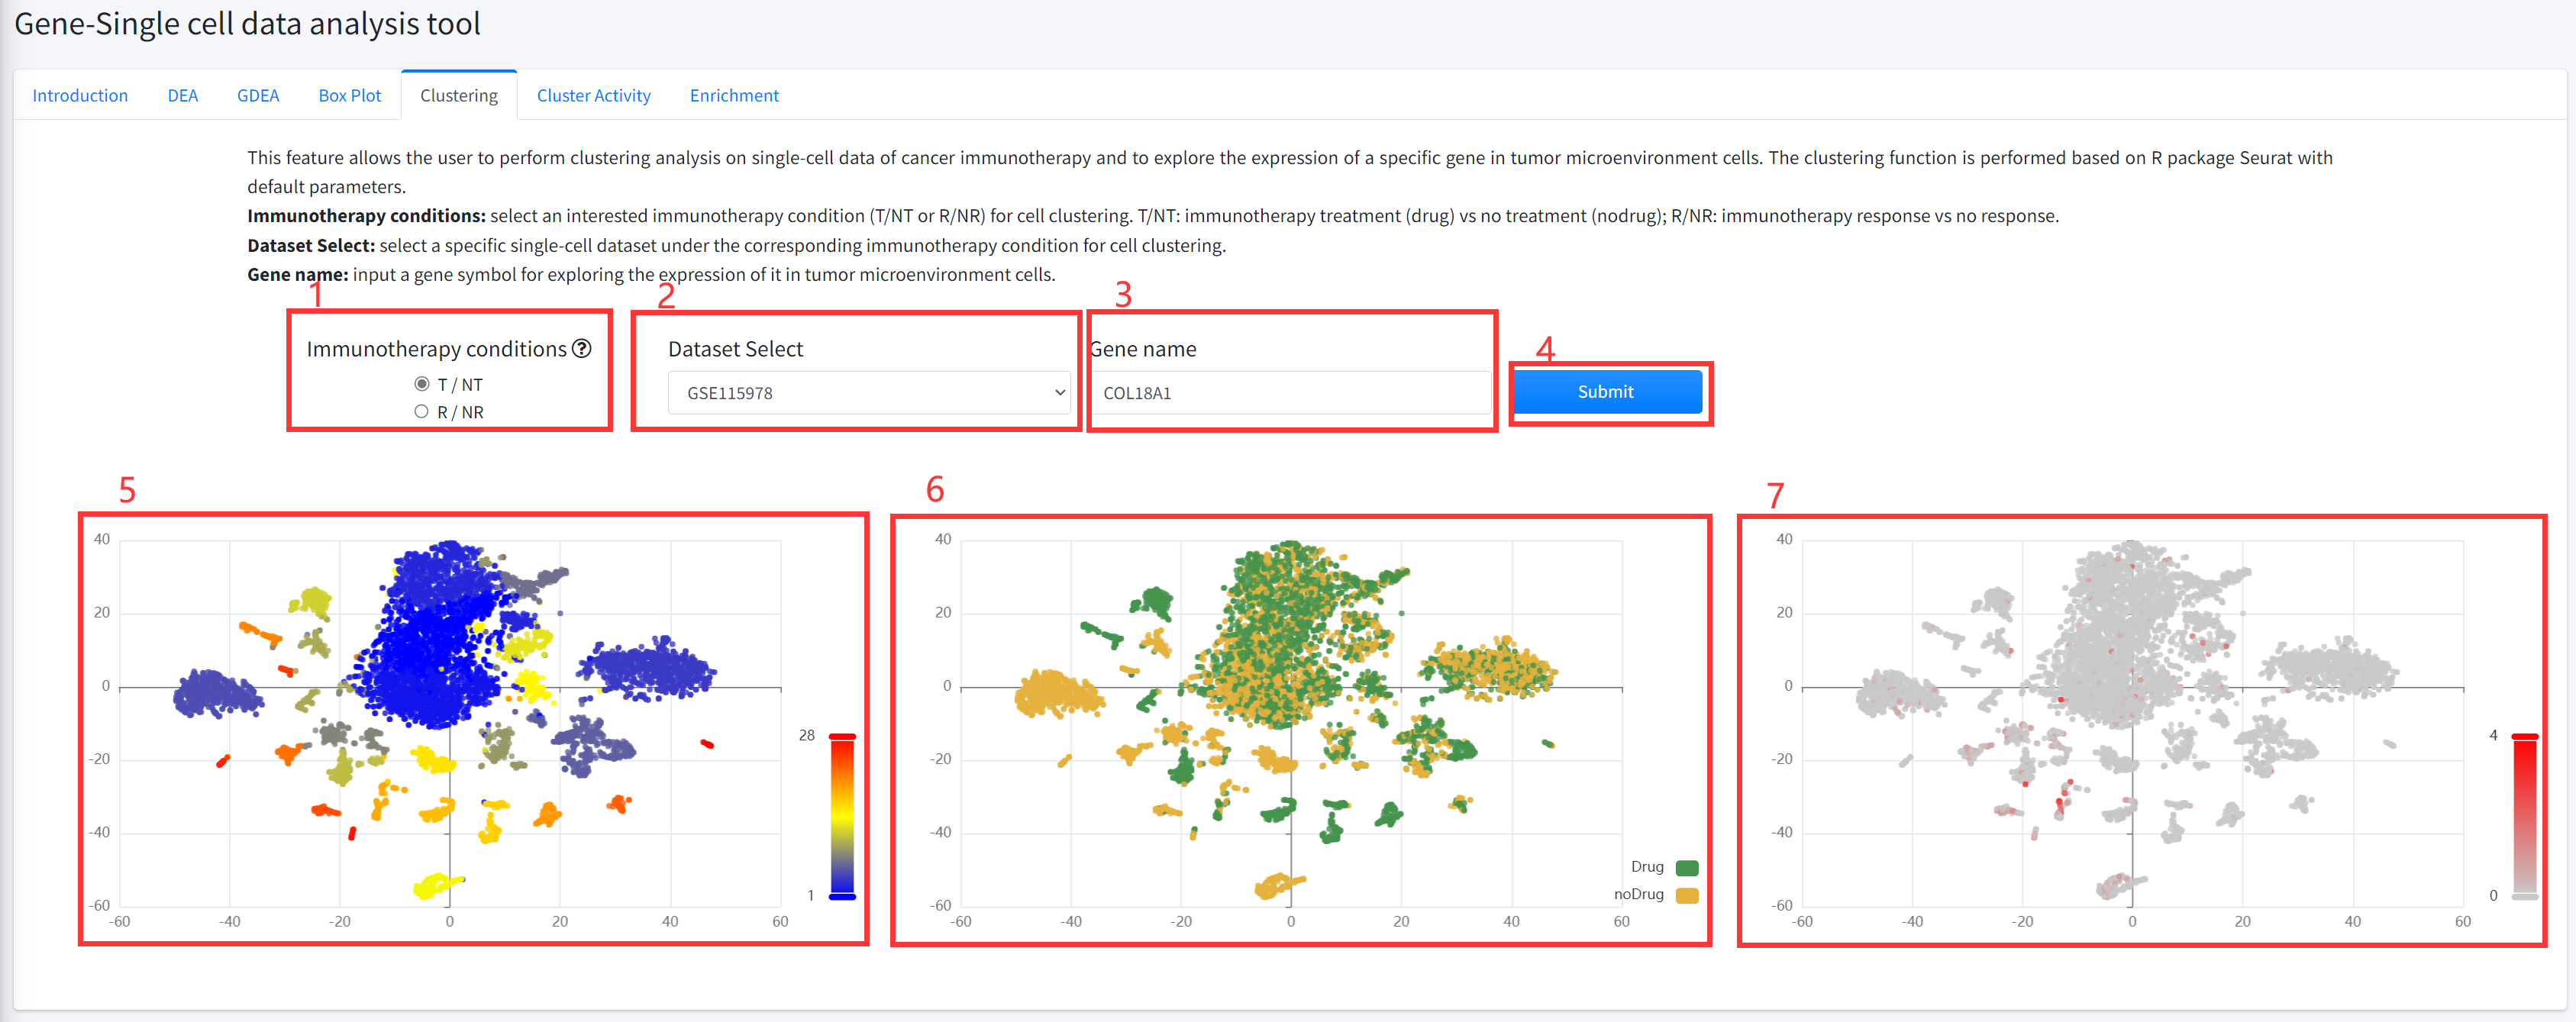
Clustering
This feature allows the user to perform cluster analysis on single-cell data of cancer immunotherapy and to
explore the expression of a specific gene in tumor microenvironment cells. The clustering function is performed
based on R package Seurat with default parameters. This function is displayed in Figure 6-5.
1. Select an interested immunotherapy condition (T/NT or R/NR) for cell clustering. T/NT: immunotherapy treatment
(Drug) vs no treatment (noDrug); R/NR: immunotherapy response vs no response.
2. Select a specific single-cell dataset under the corresponding immunotherapy condition for cell clustering.
3. Input a gene symbol for exploring the expression of it in tumor microenvironment cells.
4. Click the ‘Submit’ bottom to see results.
5. Clustering function will generate cluster plots of cluster analysis based on gene expression using high-dimensional
reduction method tNSE. The cluster plot is colored by different clusters.
6. Clustering function will generate cluster plots of cluster analysis based on gene expression using high-dimensional
reduction method tNSE. The cluster plot is colored by immunotherapy treatment (Drug) vs no treatment (noDrug) or
immunotherapy response vs no response based on the input parameters.
7. Clustering function will generate cluster plots of cluster analysis based on gene expression using high-dimensional
reduction method tNSE. The cluster plot is colored by the expression of the input gene (if available).
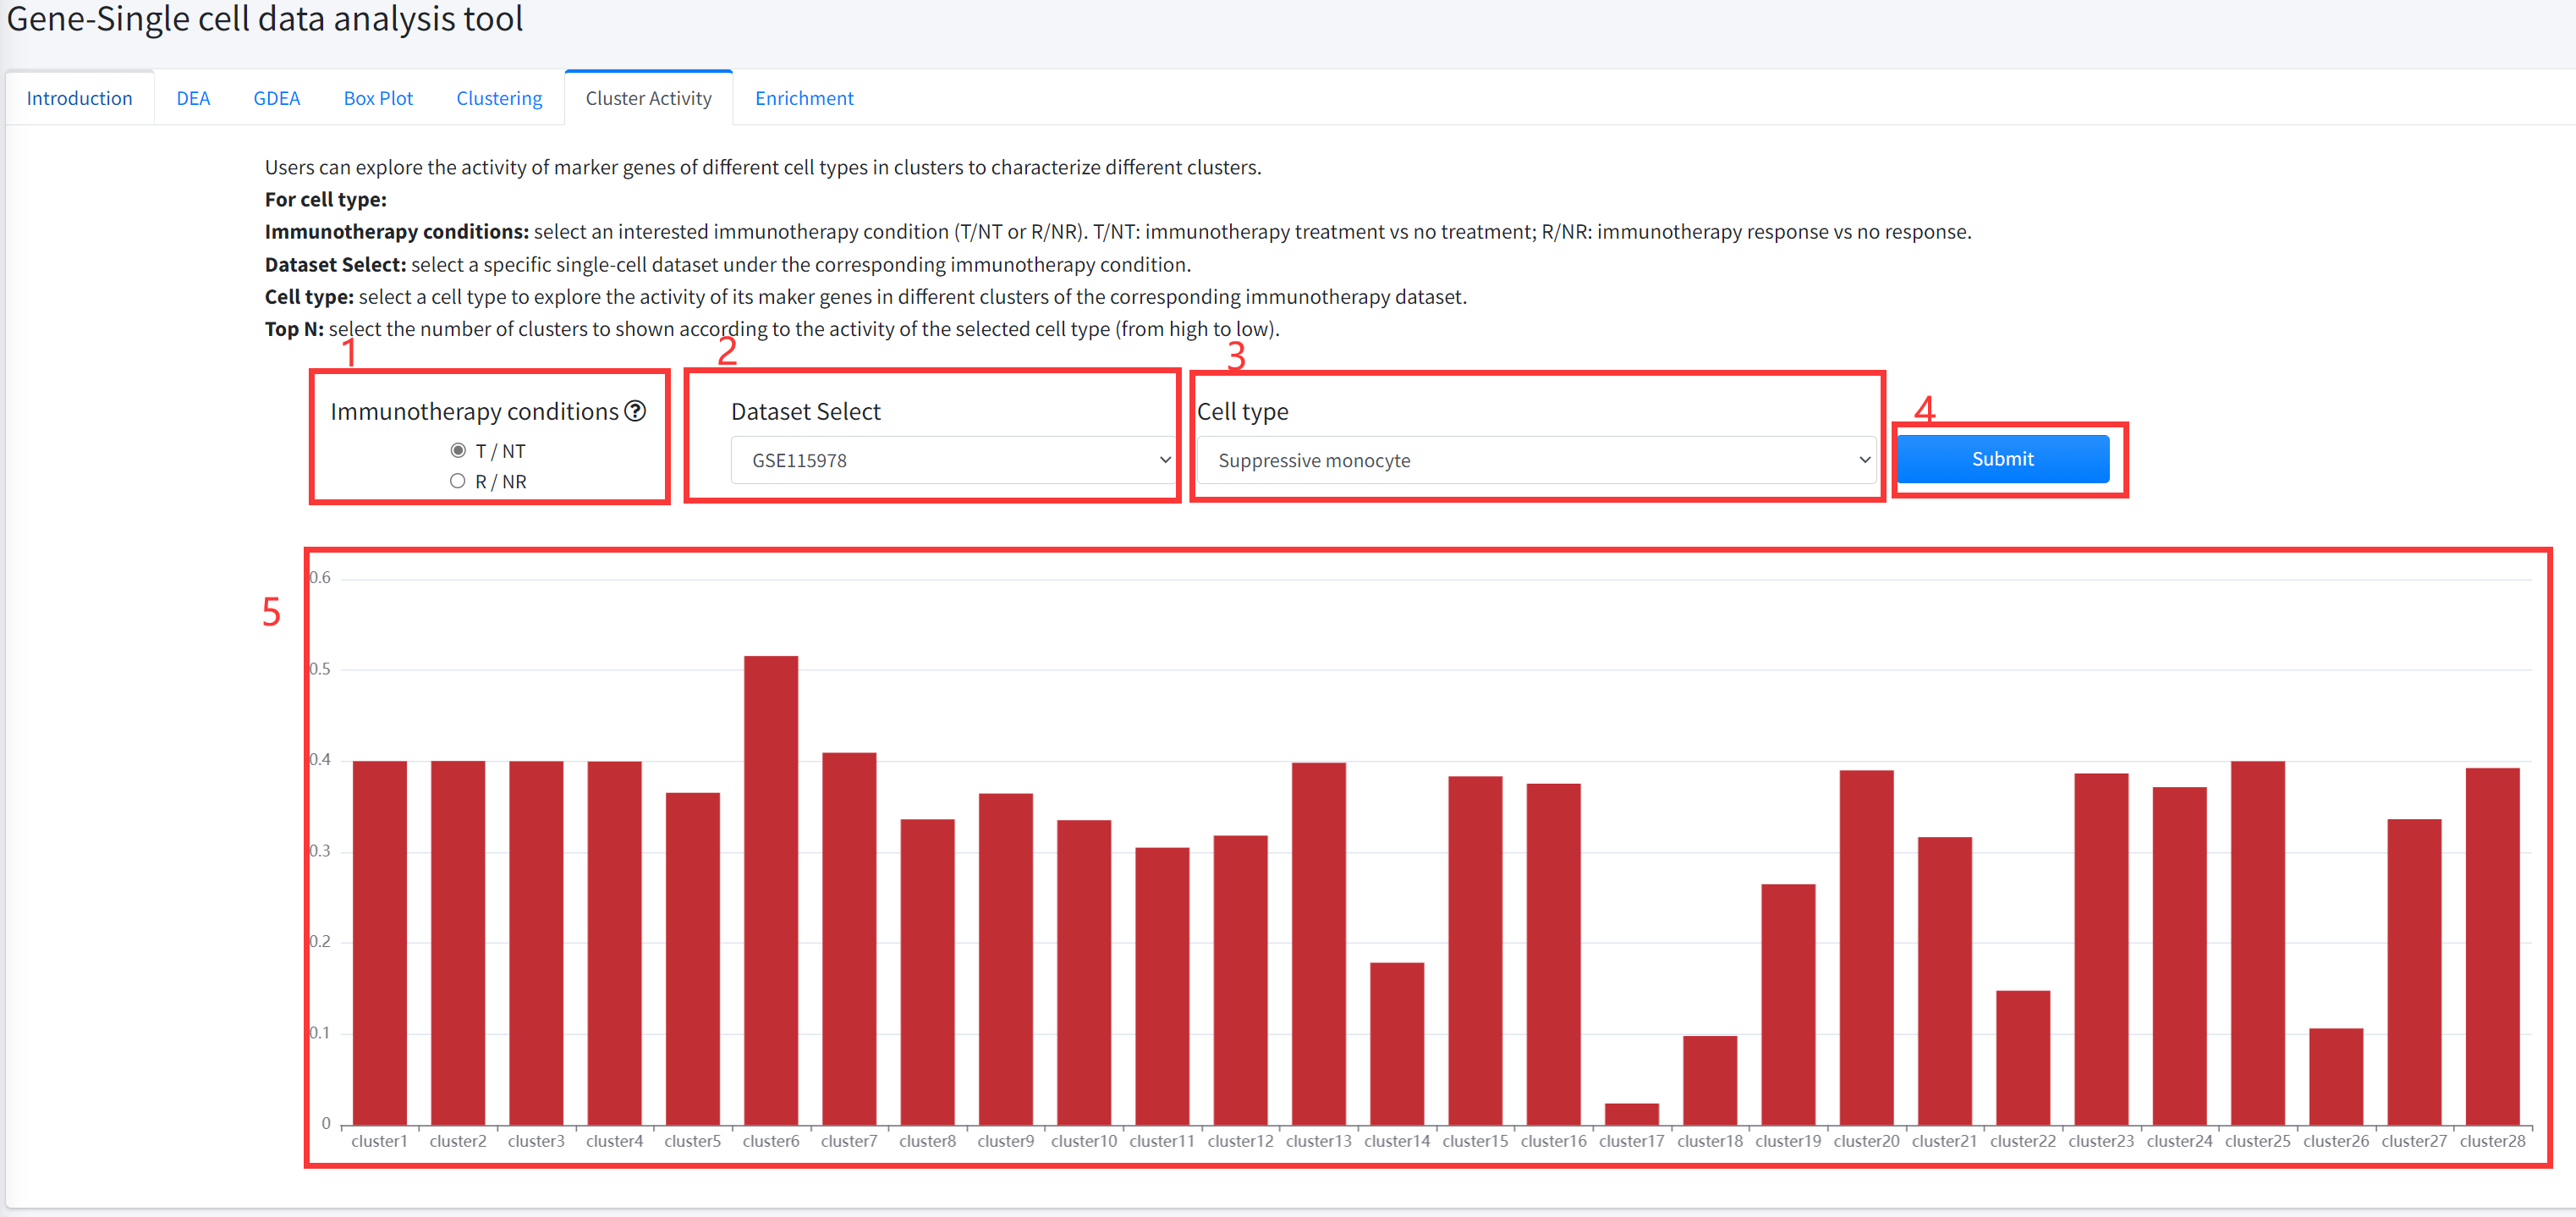
Clustering Activity
Users can explore the activity of marker genes of different cell types in clusters to characterize different
clusters. Marker genes of different cell types were obtained from CellMarker database. Activity of marker genes
of different cell types were evaluated as: (i) The mean expression value of genes in all cells of a cluster
was taken as expression value of the gene in the corresponding cluster; (ii) then, according to the marker
genes of different cell types from CellMarker database, the cell marker activity in each cluster were estimated
by Single sample GSEA algorithm based on the expression data of each cluster. Cluster Activity function is displayed in Figure 6-6.
For cell type:
1. Select an interested immunotherapy condition (T/NT or R/NR). T/NT: immunotherapy treatment vs no treatment; R/NR: immunotherapy response vs no response.
2. select a specific single-cell dataset of cancer immunotherapy under the corresponding immunotherapy condition.
3. select a cell type to explore the activity of its maker genes in different clusters of the corresponding immunotherapy dataset of cancer.
4. Click the ‘Submit’ bottom to see results.
5. Cluster Activity function will generate barplot for the activity of marker genes of the selected cell type in each cluster of the selected single-cell dataset.
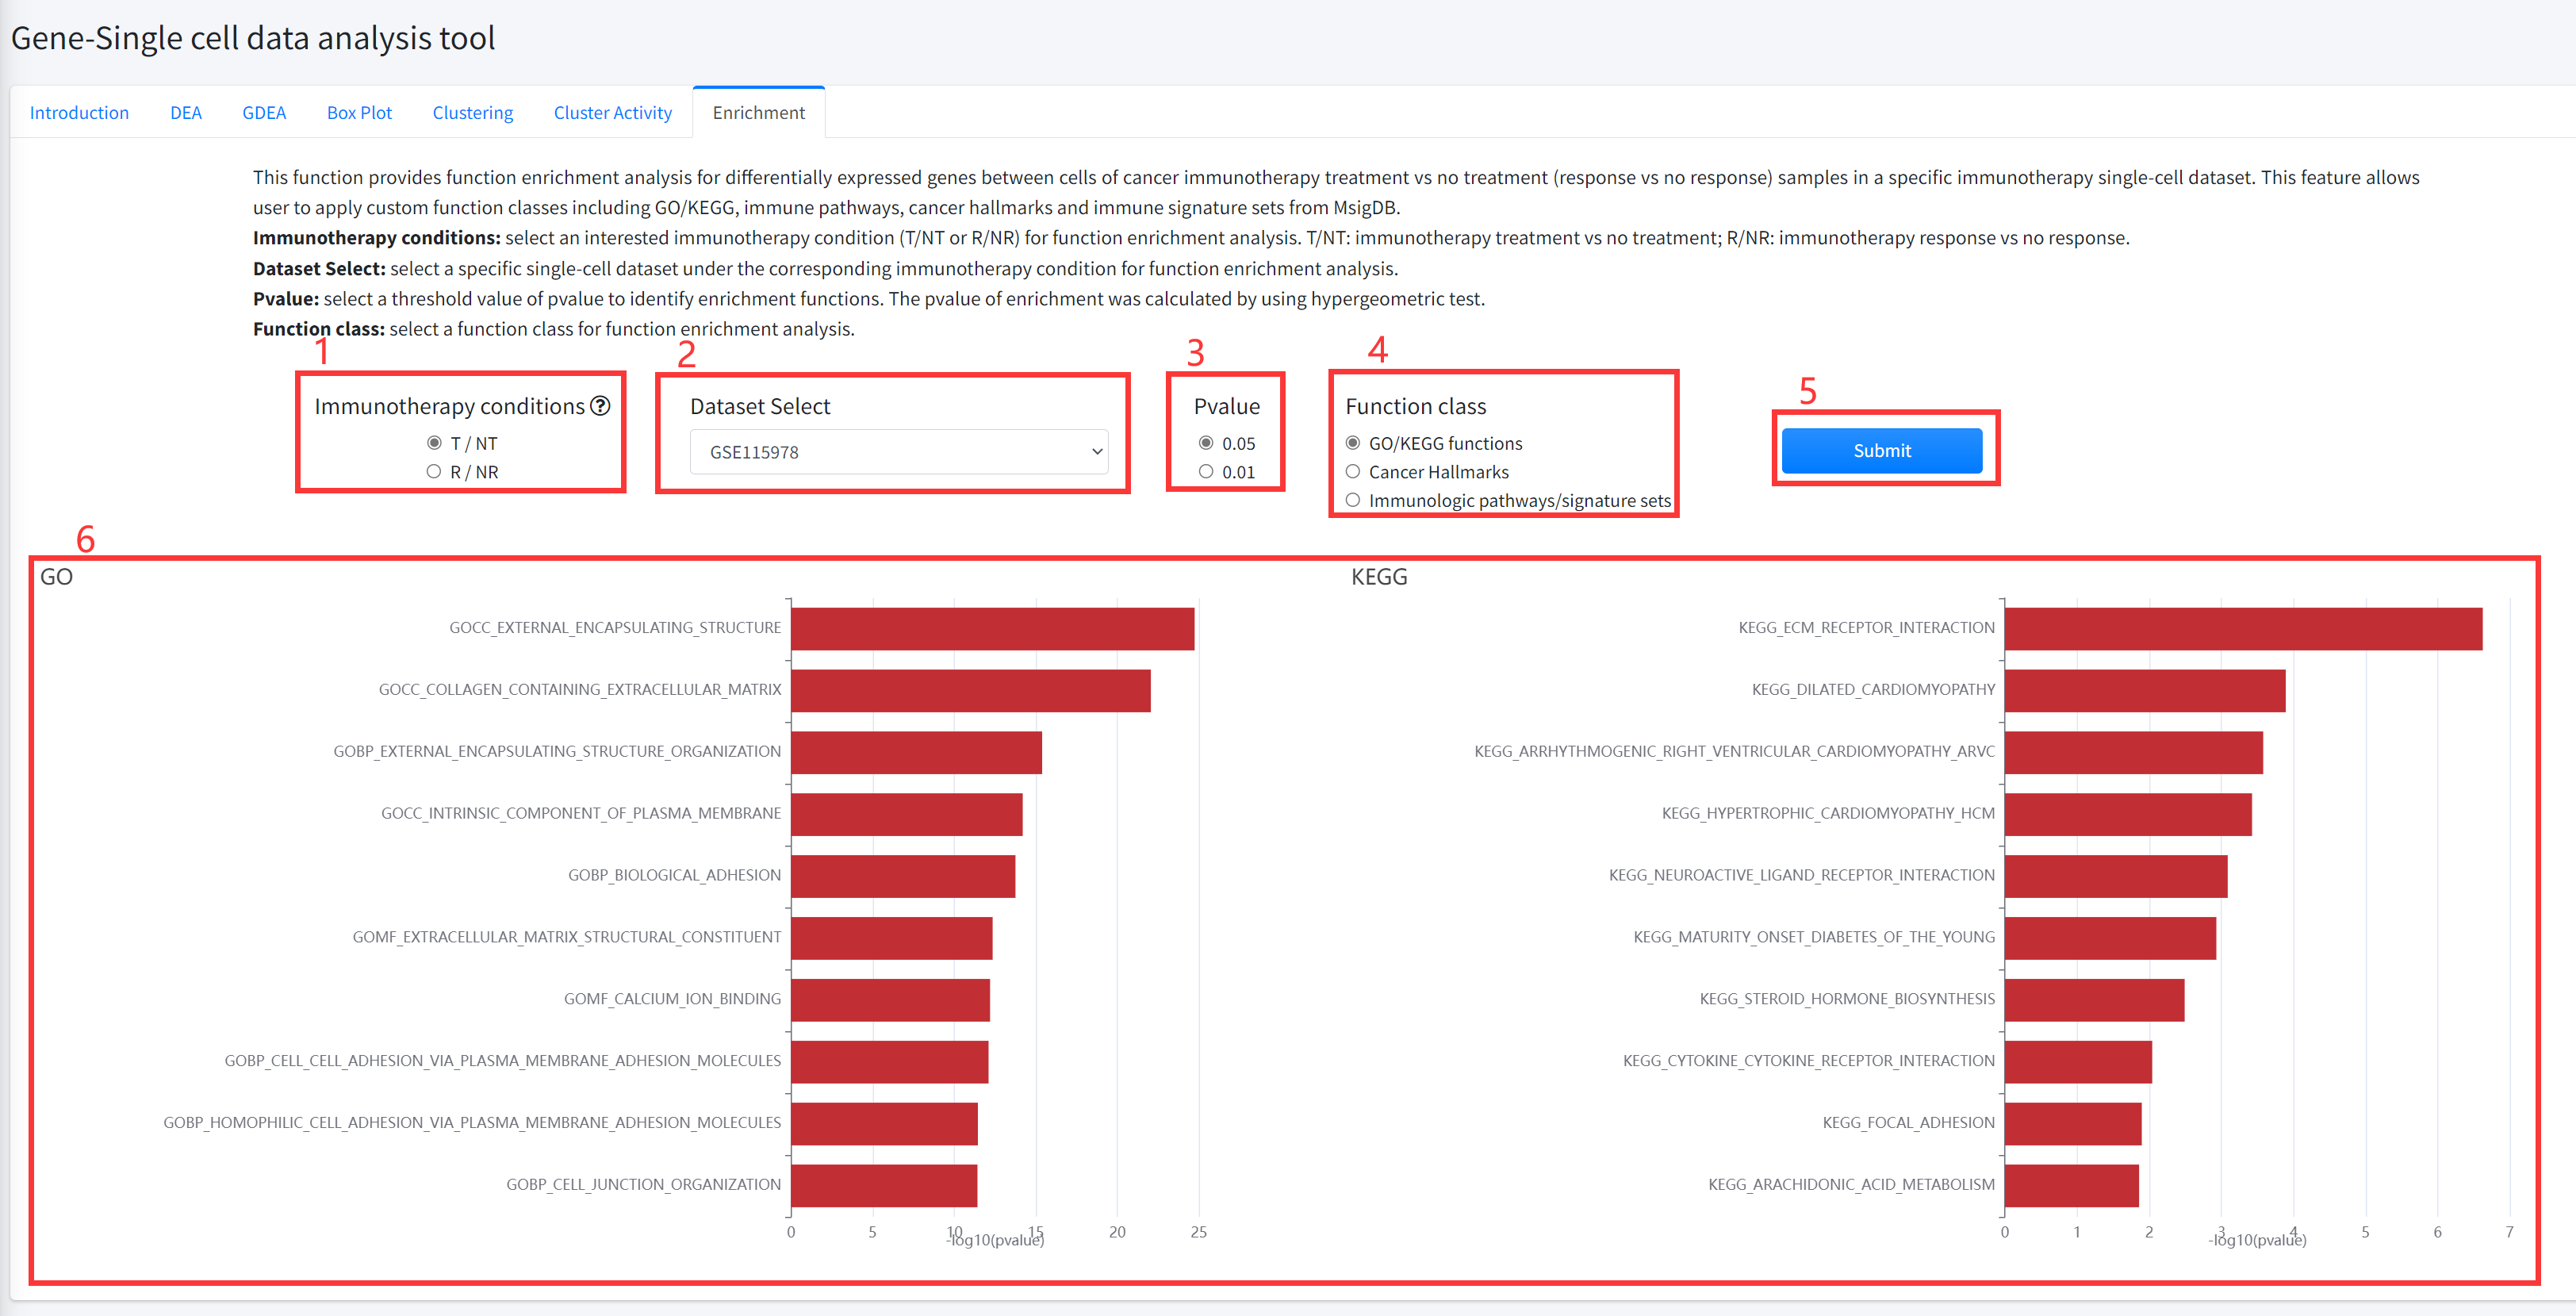
Enrichment
This function provides function enrichment analysis for differentially
expressed genes between cells of cancer immunotherapy treatment (drug) vs no
treatment (nodrug) (immunotherapy response vs no response) samples in a
specific immunotherapy single cell dataset of cancer is displayed in Figure 6-7.
This feature allows user to apply custom function classes including
GO/KEGG, immune pathways, cancer hallmarks and immune signature sets
from MsigDB.
1. Select an interested immunotherapy condition (T/NT or R/NR) for function enrichment analysis. T/NT: immunotherapy treatment
vs no treatment; R/NR: immunotherapy response vs no response.
2. Select a specific single cell dataset under the corresponding immunotherapy condition for function enrichment analysis.
3. Select a threshold value of pvalue to identify enrichment functions. The pvalue of enrichment was calculated by using hypergeometric test.
4. Select a function class for function enrichment analysis.
5. Click the ‘Submit’ bottom to see results.
6.Enrichment function will generate barplot for GO/KEGG and immune pathways/ signature sets or radar map for cancer hallmarks. If the number of functions that satisfy selected significant cutoff greater than 10, 10 functions were shown.
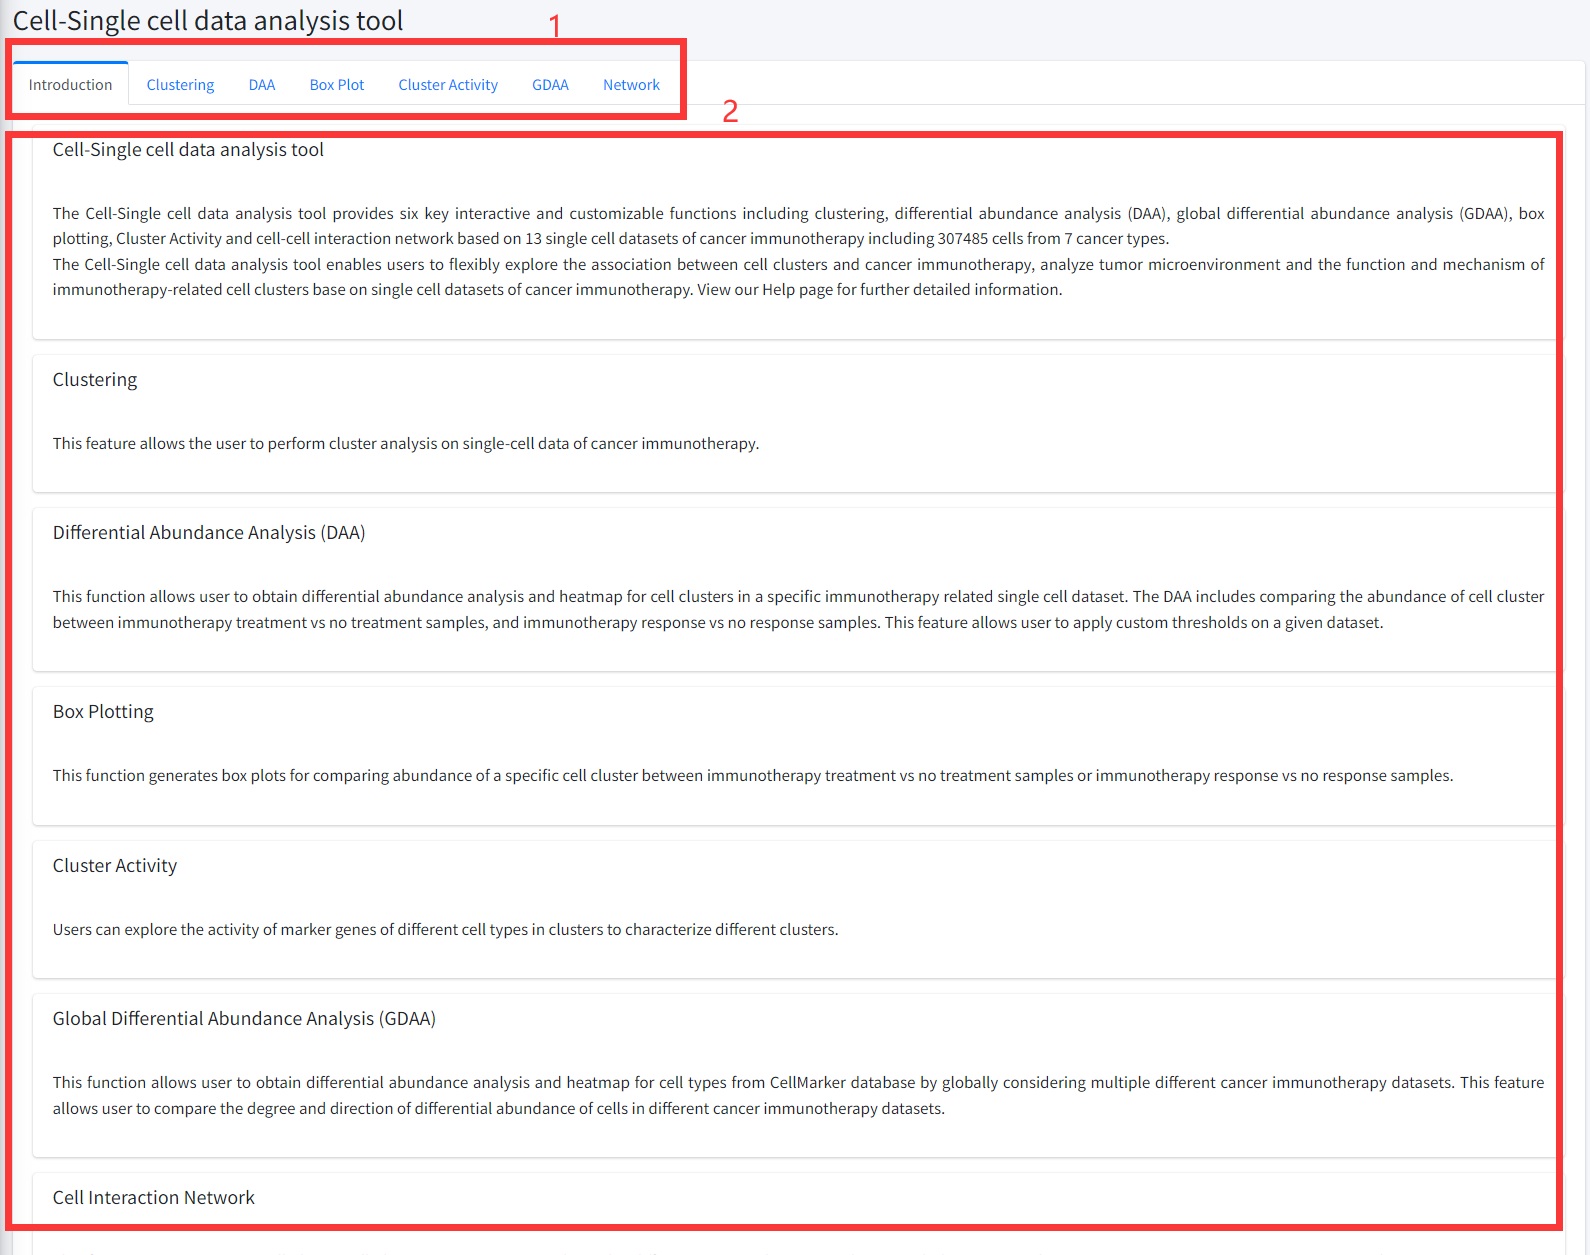
Cell-Single cell data analysis tool
The Cell-Single cell data analysis tool provides six key interactive and customizable functions including
clustering, differential abundance analysis (DAA), global differential abundance analysis (GDAA), box plotting,
Cluster Activity and cell-cell interaction network based on 13 single cell datasets of cancer immunotherapy
including 307485 cells from 7 cancer types.
The Cell-Single cell data analysis tool enables users to flexibly explore the association between cell clusters and cancer immunotherapy, analyze tumor microenvironment
and the function and mechanism of immunotherapy-related cell clusters base on single cell datasets of cancer immunotherapy.
Introduction
Detailed information of the Cell-Single cell data analysis tool contains functions for discovering and characterizing immunotherapy-related cell
clusters (types) based on single cell datasets is displayed in Figure 8-1:
1. Main functions of the Cell-Single cell data analysis tool are provided in menu bar form (boxed in red).
2. Detailed introduction of main functions of Cell-Single cell data analysis tool.
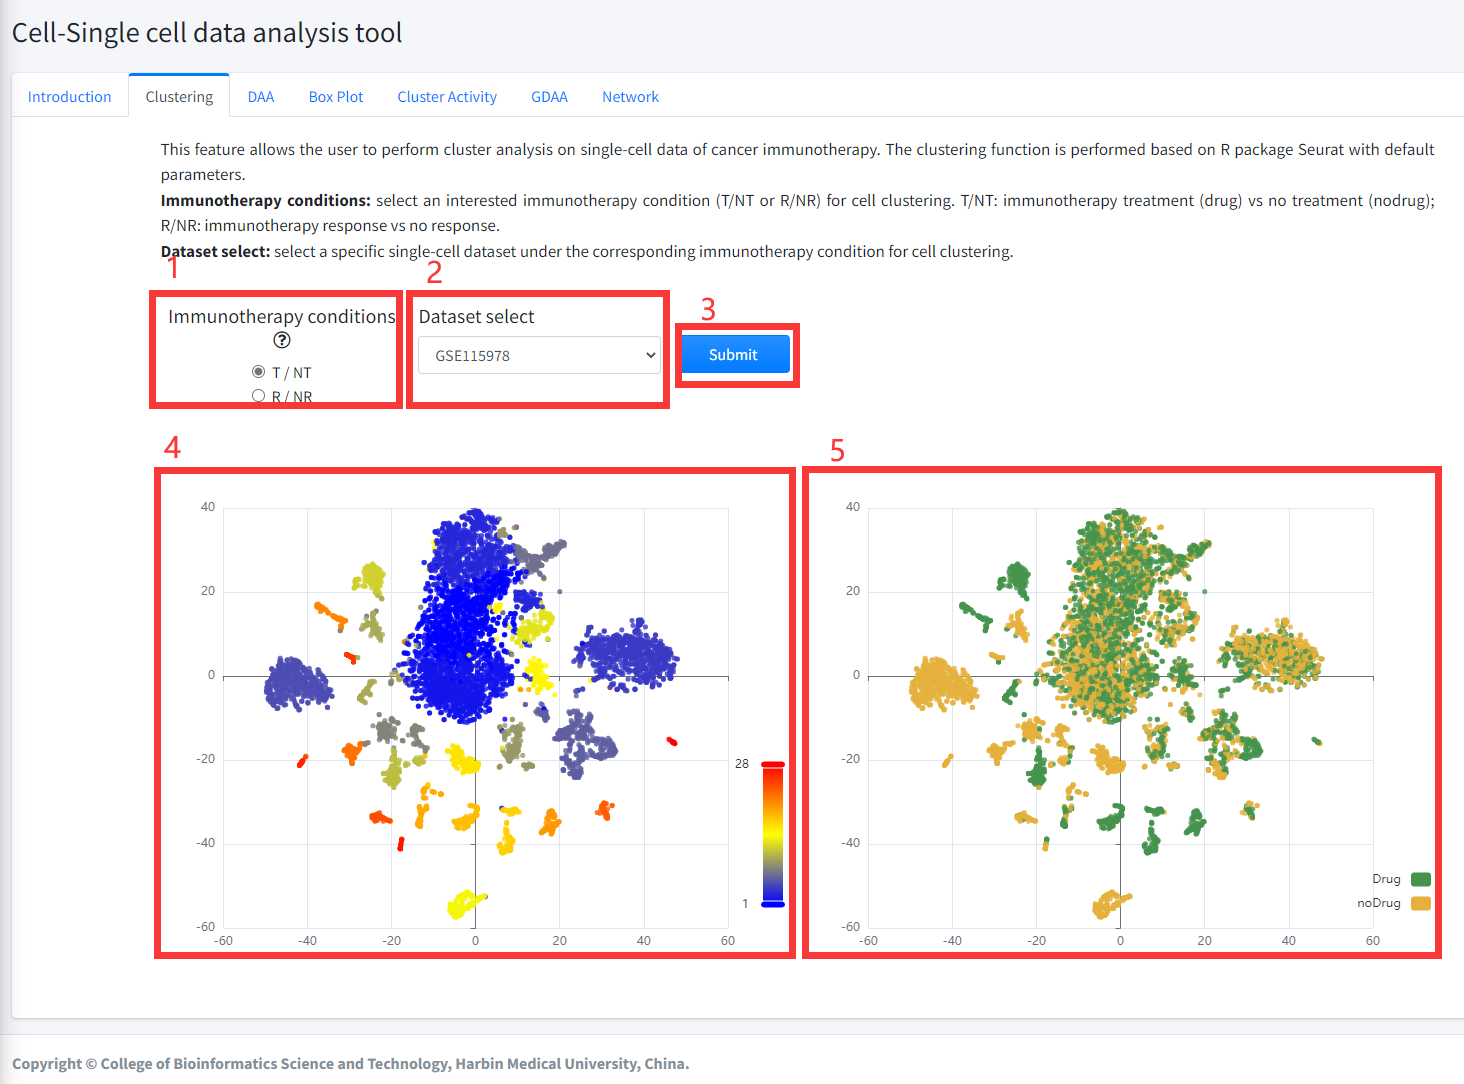
Clustering
This feature allows the user to perform cluster analysis on single-cell data
of cancer immunotherapy. The clustering function is performed based on R package
Seurat with default parameters. This function is displayed in Figure 8-2.
1. Select an interested immunotherapy condition (T/NT or R/NR) for cell clustering. T/NT: immunotherapy treatment (drug) vs no treatment
(nodrug); R/NR: immunotherapy response vs no response.
2. Select a specific single-cell dataset under the corresponding immunotherapy condition for cell clustering.
3. Click the ‘Submit’ bottom to see results.
4. Clustering function will generate cluster plots of cluster analysis based on gene expression using high-dimensional reduction method tNSE.
The cluster plot is colored by different clusters.
5. Clustering function will generate cluster plots of clustering analysis based on gene expression using high-dimensional reduction method tNSE.
The cluster plot is colored by immunotherapy treatment (Drug) vs no treatment (noDrug) or immunotherapy response vs no response based on the input parameters.
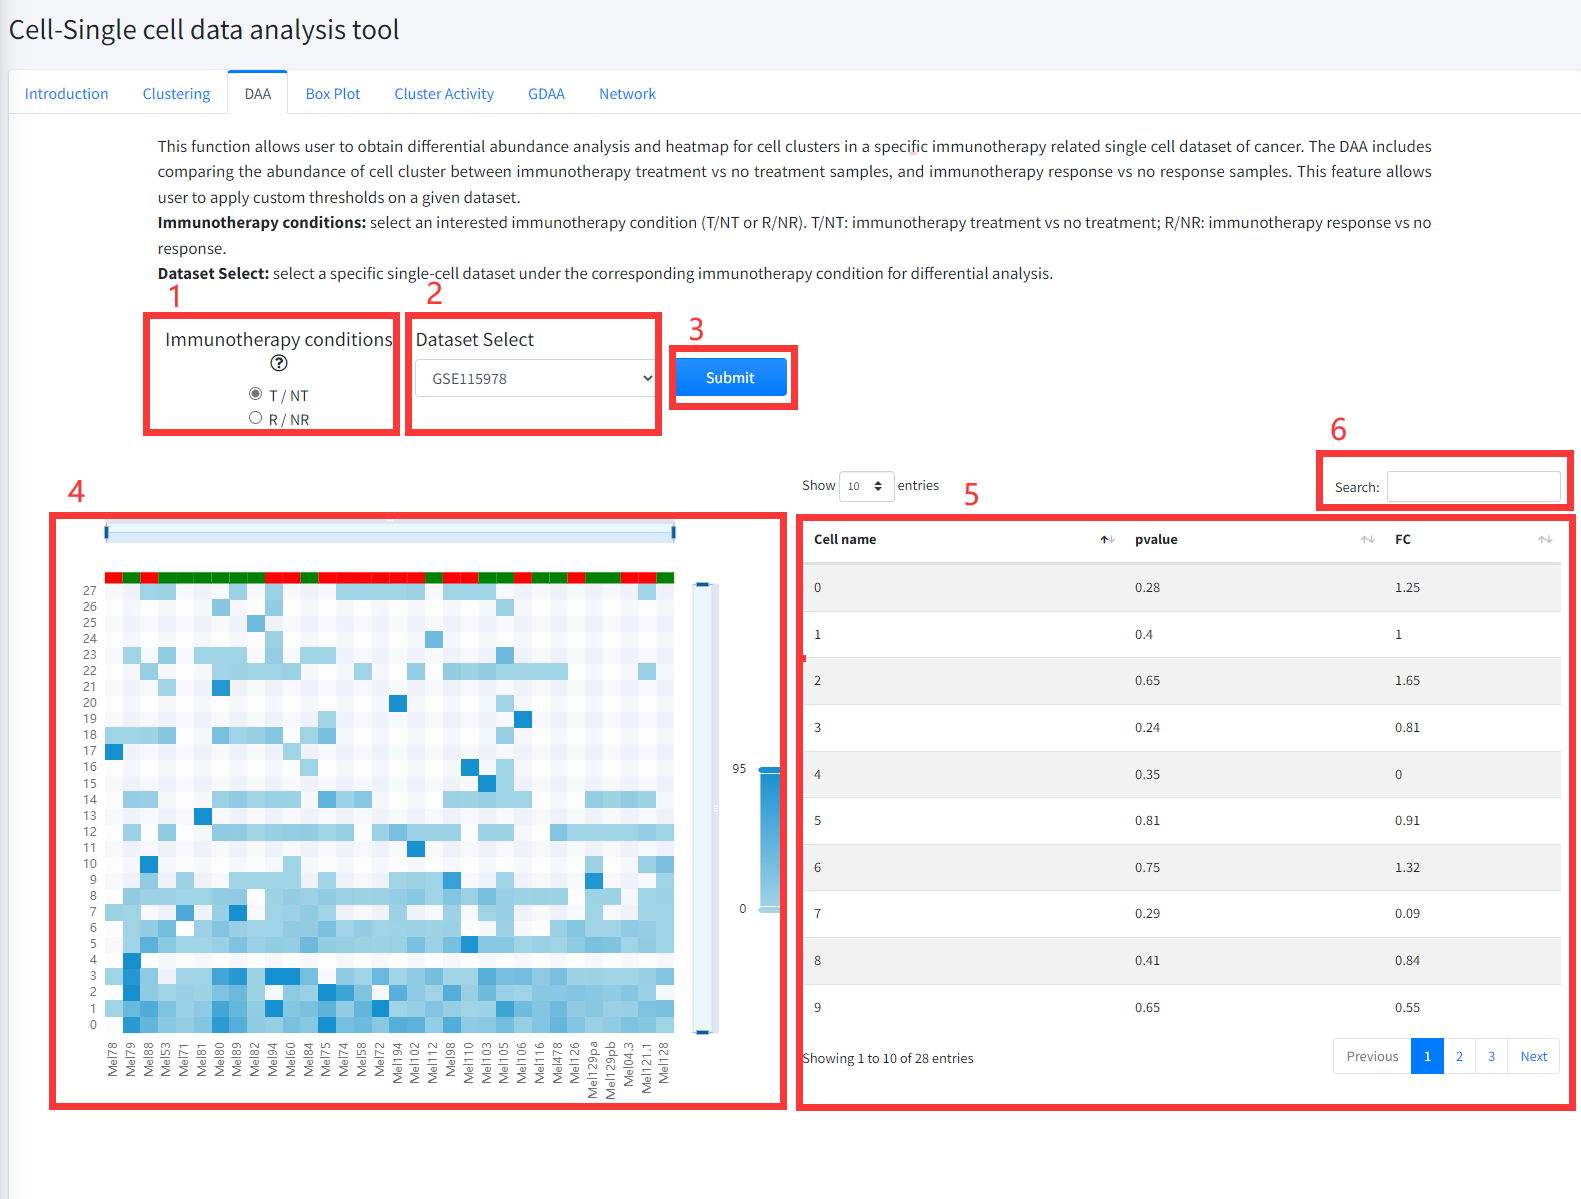
DAA
This function allows user to obtain differential abundance analysis and heatmap
for cell clusters in a specific immunotherapy related single cell dataset of cancer is
displayed in Figure 8 -3. The DAA includes comparing the abundance of cell
clusters between cells of cancer immunotherapy treatment (Drug) vs no treatment
(noDrug) samples, and between cells of immunotherapy response vs no response samples.
1. Select an interested immunotherapy condition (T/NT or R/NR). T/NT: immunotherapy treatment vs no treatment; R/NR: immunotherapy response vs no response.
2. Select a specific single-cell dataset under the corresponding immunotherapy condition for differential analysis.
3. Click the ‘Submit’ bottom to see results.
4. DAA function will generate a heatmap of differential cell clusters under the corresponding immunotherapy condition based on input parameters.
5. DAA function will generate a list of differential cell clusters under the corresponding immunotherapy condition based on input parameters.
6. Search for items that contain interesting cell cluster.
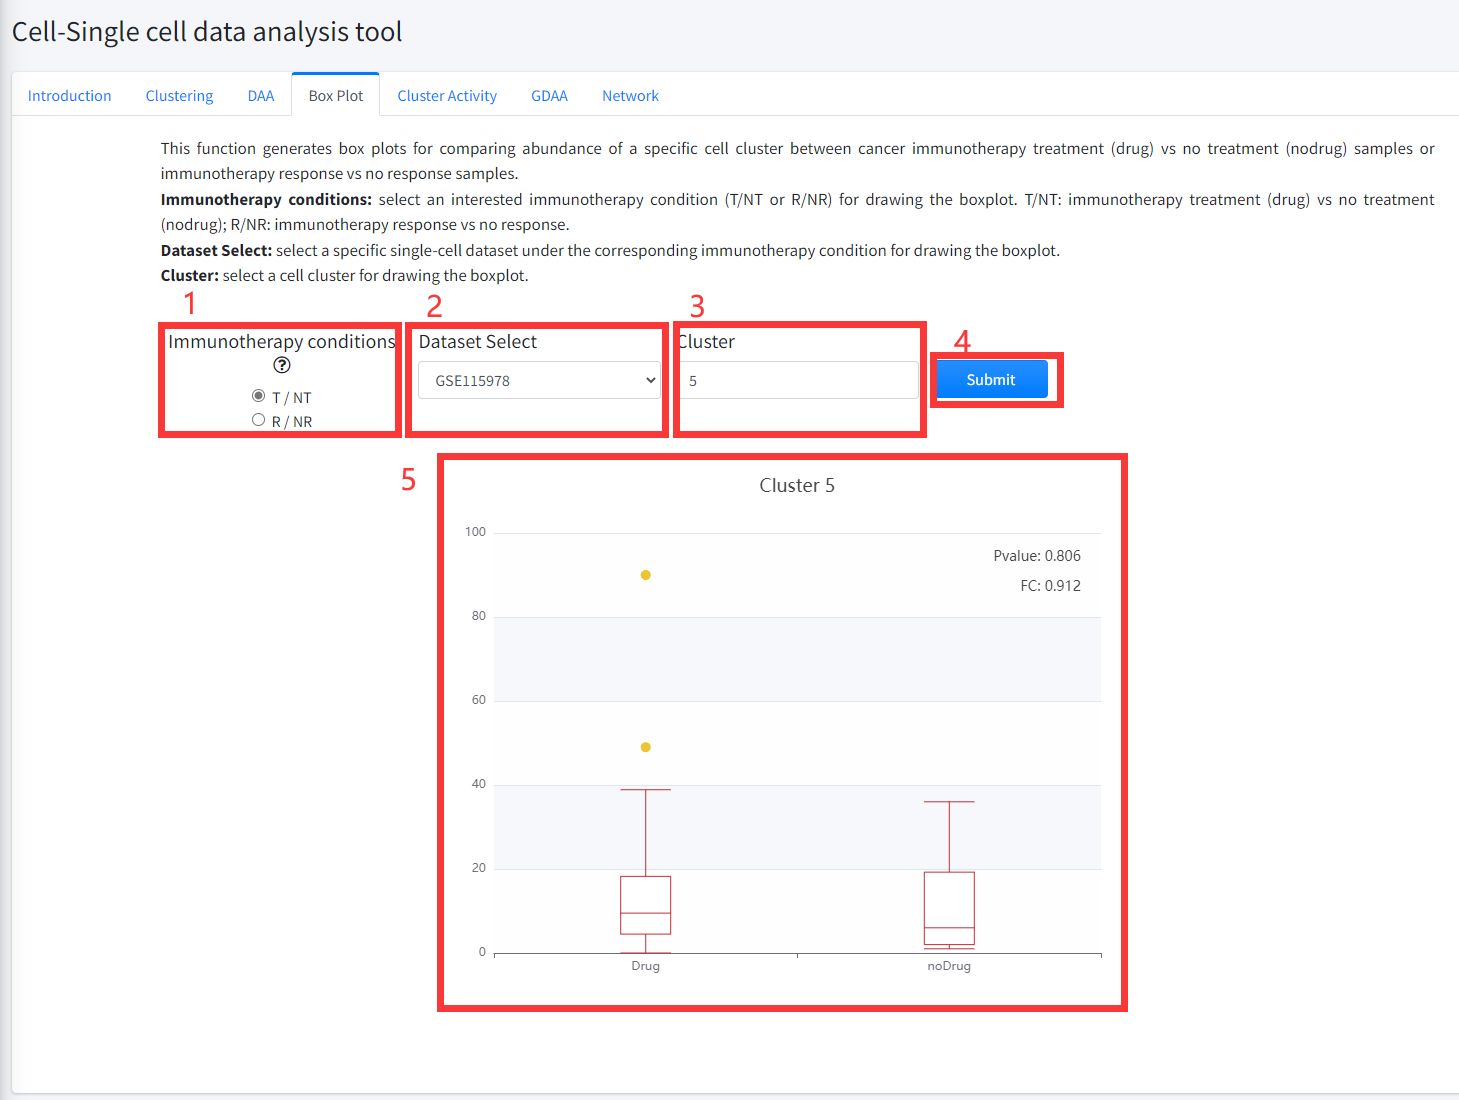
Box Plot
This function generates box plots for comparing abundance of a specific cell
cluster between cancer immunotherapy treatment (Drug) vs no treatment (noDrug) samples
or immunotherapy response vs no response samples. This function is displayed in Figure 8-4.
1. Select an interested immunotherapy condition (T/NT or R/NR) for drawing the boxplot. T/NT: immunotherapy treatment vs no treatment;
R/NR: immunotherapy response vs no response.
2. Select a specific single-cell dataset under the corresponding immunotherapy condition for drawing the boxplot.
3. Input a cell cluster of the selected single-cell dataset for drawing the boxplot.
4. Click the ‘Submit’ bottom to see results.
5. Boxplot function will generate a boxplot for comparing abundance of the selected cell cluster in cancer immunotherapy treatment (Drug) vs no treatment
(noDrug) samples or immunotherapy response vs no response samples of the corresponding single cell dataset based on input parameters.
The pvalue in boxplot was calculated by using Wilcoxon Signed Rank Test.
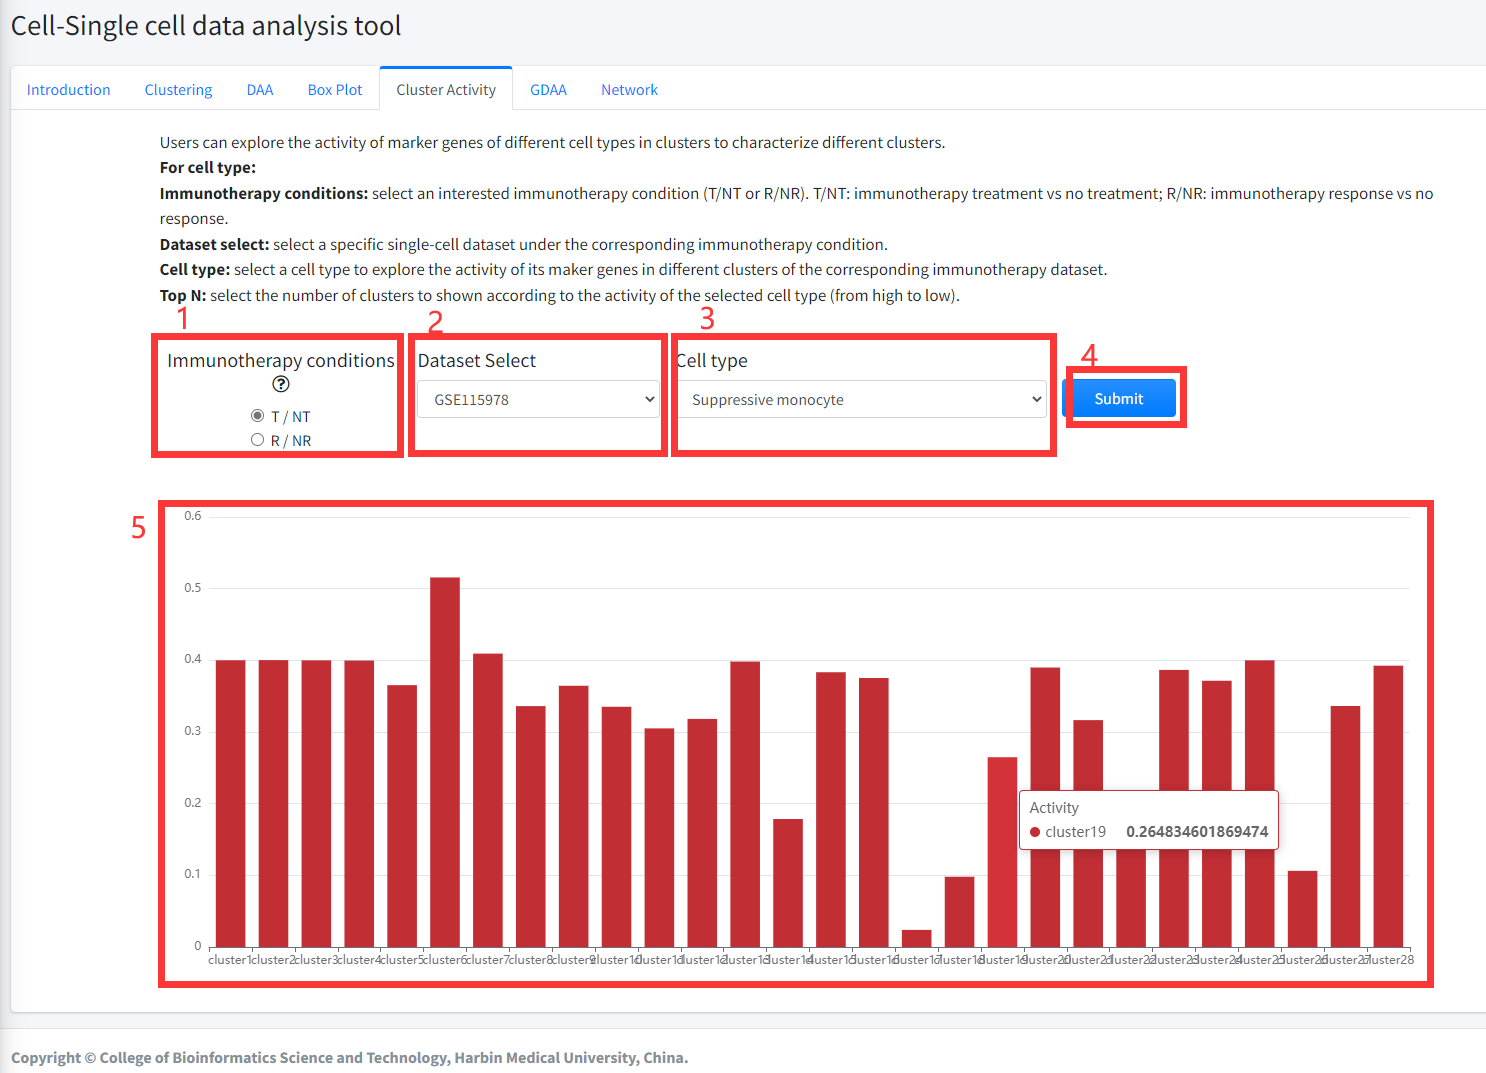
Cluster Activity
Users can explore the activity of marker genes of different cell types in clusters to characterize different clusters
in cancer immunotherapy dataset. Marker genes of different cell types were
obtained from CellMarker database. Activity of marker genes of different cell
types were evaluated as: (i) The mean expression value of genes in all cells of a
cluster was taken as expression value of the gene in the corresponding cluster; (ii)
then, according to the marker genes of different cell types from CellMarker database,
the cell marker activity in each cluster were estimated by Single sample GSEA algorithm
based on the expression data of each cluster. Cluster Activity function is displayed in Figure 8-5.
For cell type:
1. Select an interested immunotherapy condition (T/NT or R/NR). T/NT: immunotherapy treatment vs no treatment; R/NR: immunotherapy response vs no response.
2. select a specific single-cell dataset under the corresponding immunotherapy condition.
3. select a cell type to explore the activity of its maker genes in different clusters of the corresponding immunotherapy single cell dataset.
4. Click the ‘Submit’ bottom to see results.
5. Cluster Activity function will generate barplot for the activity of marker genes of the selected cell type in each cluster of the selected single-cell dataset.
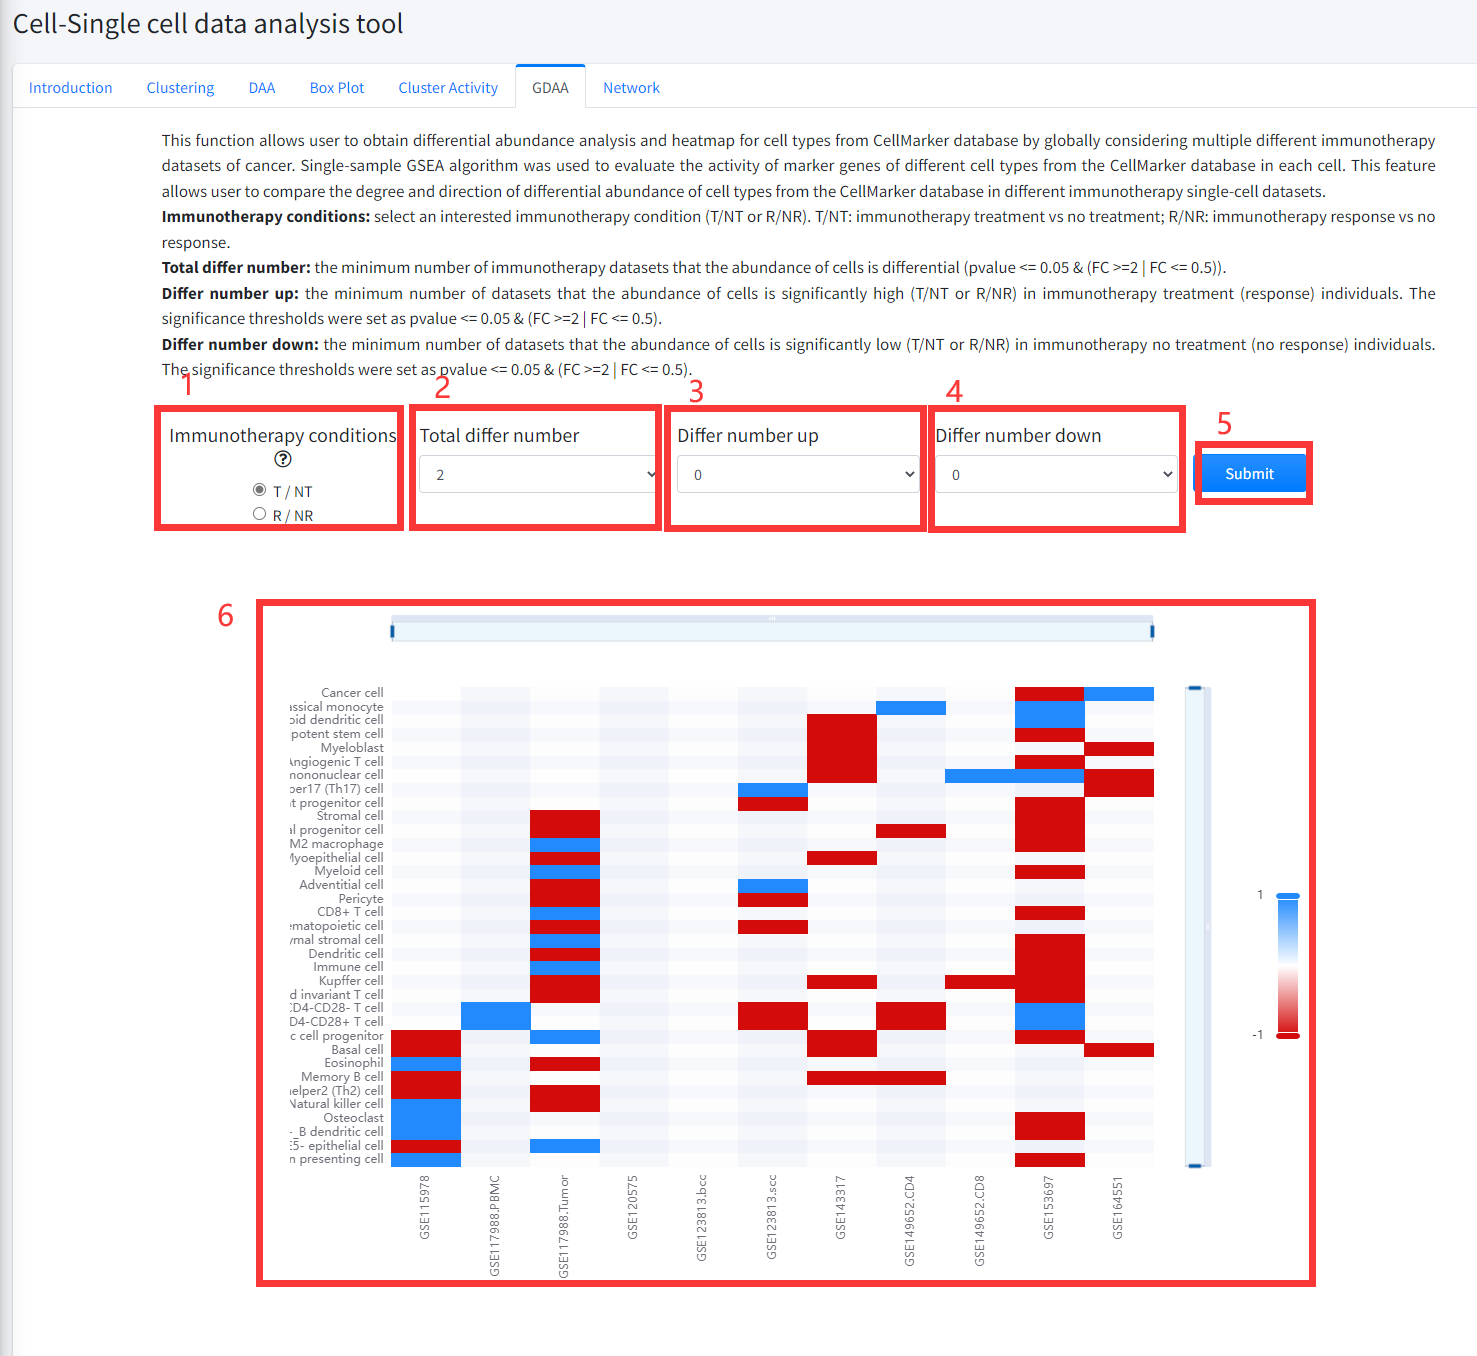
GDAA
This function allows user to obtain differential abundance analysis and heatmap for cell types from
CellMarker database by globally considering multiple different immunotherapy datasets of cancer.
Single-sample GSEA algorithm was used to evaluate the activity of marker genes of different cell
types from the CellMarker database in each cell. Then, cell types that differed in activity between
cells of immunotherapy treatment vs no treatment samples or between cells of immunotherapy response
vs no response samples were identified by using Wilcoxon Signed Rank Test (p < = 0.05) and
the FCs (FC > = 2 | FC < = 0.5) as the threshold.
This feature allows user to compare the degree and direction of differential abundance of cell types from the CellMarker database in different immunotherapy
single-cell datasets of cancer. This function is displayed in Figure 8-6.
1. Select an interested immunotherapy condition (T/NT or R/NR). T/NT: immunotherapy treatment vs no treatment; R/NR: immunotherapy response vs no response.
2. The minimum number of immunotherapy datasets that the abundance of cells is differential (pvalue <= 0.05 & (FC >=2 | FC <= 0.5)).
3. The minimum number of datasets that the abundance of cells is significantly high (T/NT or R/NR) in immunotherapy treatment (response) individuals.
The significance thresholds were set as pvalue <= 0.05 & (FC >=2 | FC <= 0.5).
4. The minimum number of datasets that the abundance of cells is significantly low (T/NT or R/NR) in immunotherapy no treatment (no response) individuals.
The significance thresholds were set as pvalue <= 0.05 & (FC >=2 | FC <= 0.5).
5. Click the ‘Submit’ bottom to see results.
6. GDAA function will generate a heatmap of differentially activity cell types across different datasets under the corresponding immunotherapy condition based on input parameters. ‘red’ color in the heatmap represents the activity of cell markers significantly high (T/NT or R/NR) in immunotherapy treatment (response) individuals and ‘bule’ color in the heatmap represents the activity of cell markers significantly low (T/NT or R/NR) in immunotherapy no treatment (no response) individuals.
Network
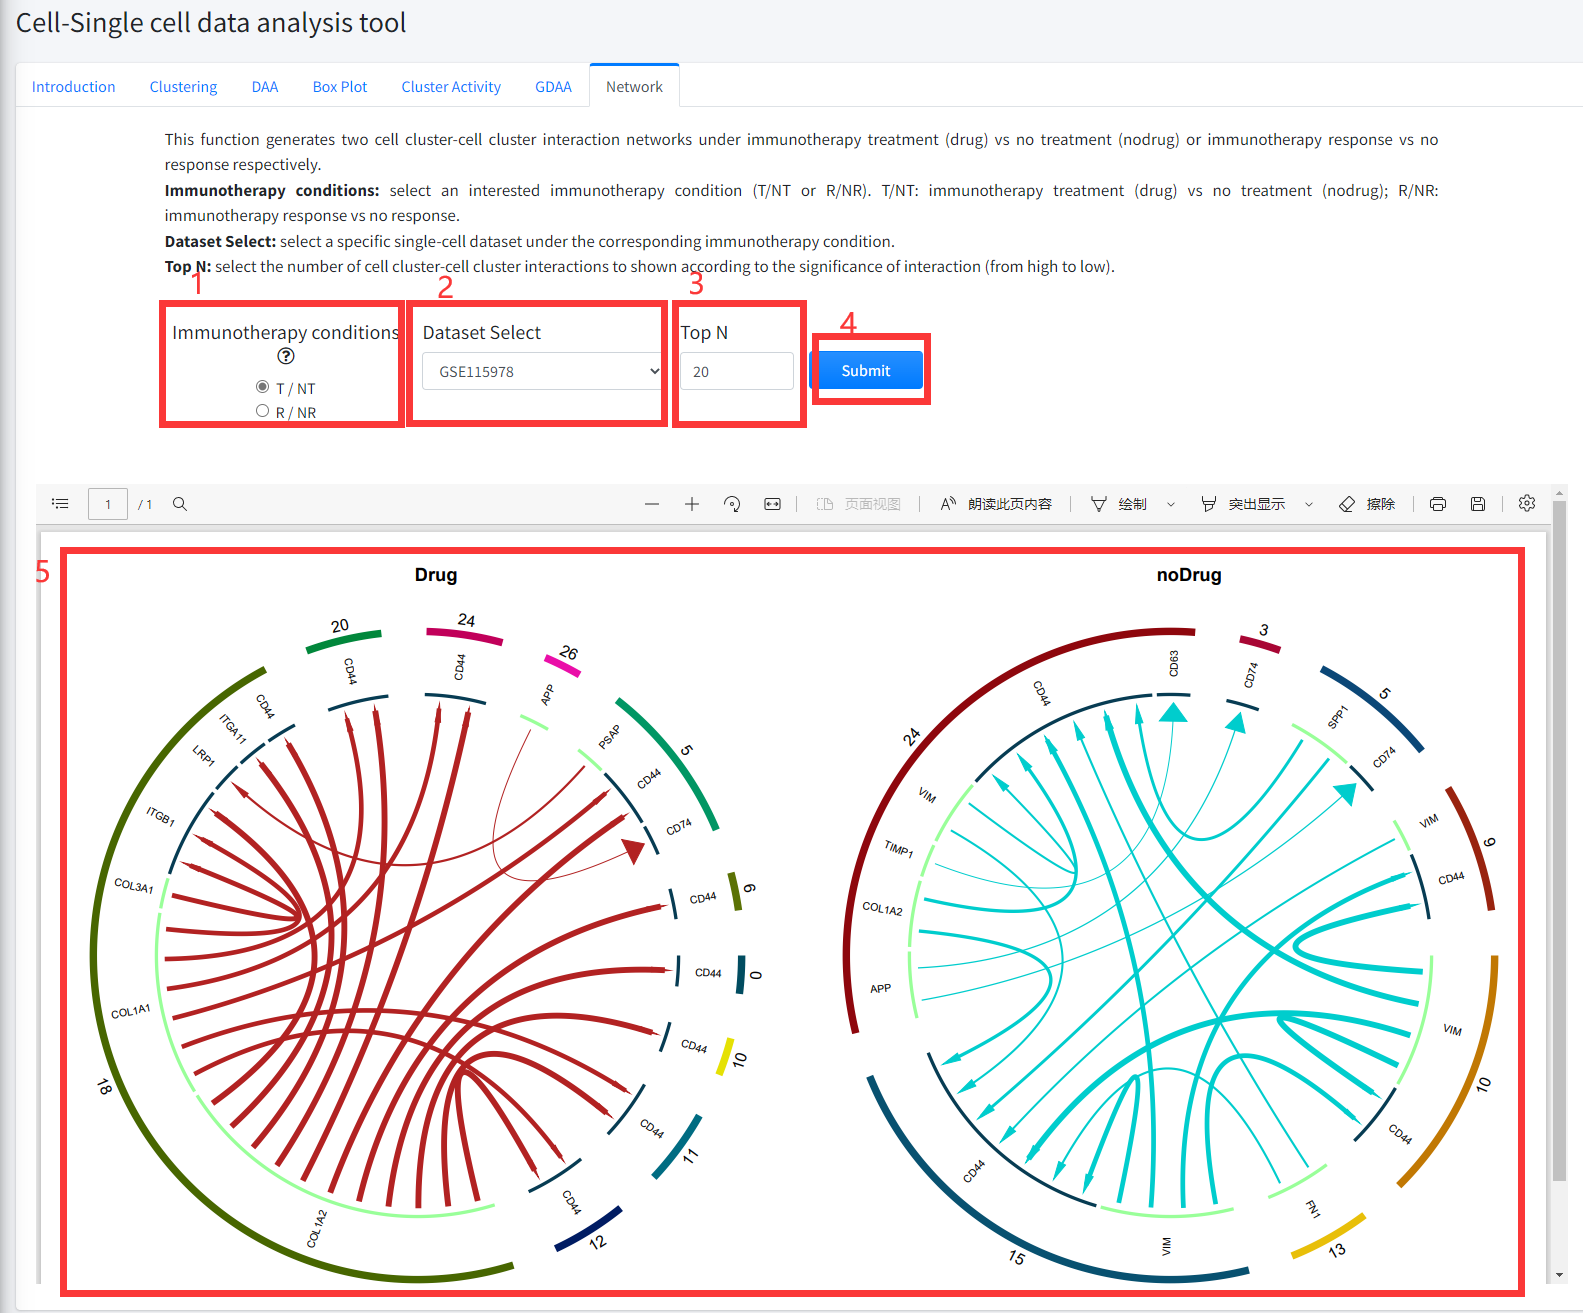
This function generates two cell cluster-cell cluster interaction networks under cancer
immunotherapy treatment (Drug) vs no treatment (noDrug) or immunotherapy response vs no
response respectively. This function is displayed in Figure 8-7.
1. Select an interested immunotherapy condition (T/NT or R/NR). T/NT: immunotherapy treatment (Drug) vs no treatment (noDrug); R/NR:
immunotherapy response vs no response.
2. Select a specific single-cell dataset under the corresponding immunotherapy condition.
3. Select the number of cell cluster-cell cluster interactions to shown according to the significance of interaction (from high to low).
4. Click the ‘Submit’ bottom to see results.
5. Network function will generate two cell cluster-cell cluster interaction networks under immunotherapy treatment (Drug) vs no treatment (noDrug) or immunotherapy
response vs no response conditions according to the input parameter.