LncDM Platform
LncDM is an R package to identify differentially DNA methylated lncRNAs (and protein-coding genes) in the targeted control VS disease datasets.
In the following example, we take the methylation data of Breast Invasive Carcinoma from TCGA to calculate the differentially methylated lincRNAs.
- Example Code
- Data Distribution
- Differential Methylation Site
- Differential Methylation Region
- Differential Methylation Element
library("LncDM");
#classes:lincRNA gene processed_transcript pseudogene
classes="lincRNA";
#phenotype file's name
groupfile="pheno.txt";
###Load and preprocessed raw data
loadData=loaddata(fileDir="Level_2",beta_method="M/(M+U)",groupfile=groupfile,samplefilter = TRUE,contin="OFF",samplefilterperc = 0.75,XYchrom = c(FALSE, "X","Y"),sitefilter = TRUE, sitefilterperc = 0.75,filterDecetP=0.05,normalization = FALSE,transfm = FALSE,snpfilter=c(FALSE,"prob_snp"),gcase="case",gcontrol="control",skip=2,imputation="knn",knn.k=10);
save(loadData,file="loadData.Rdata");
load("loadData.Rdata");
###calculate differential methylation site
dms=dms(data=loadData,contin="OFF",classes=classes,testmethod = "t.test", Padj = "fdr", gcase = "case", gcontrol = "control",
paired = FALSE,rawpcut = 0.05, adjustpcut = 0.05, betadiffcut = 0.3,XY=c(FALSE,"X","Y"),tlog=FALSE,num=1);
###calculate differential methylation element
Region=region_level(data=loadData,indexmethod = "mean",classes=classes);
save(Region,file="Region.Rdata");
dme=dme(data=Region,classes=classes,contin="OFF",testmethod = "t.test", Padj = "fdr", gcase = "case", gcontrol = "control",
paired = FALSE,rawpcut = 0.05, adjustpcut = 0.05, betadiffcut = 0.3,num=1);
###calculate differential methylation region
dmr=dmr(data=loadData,contin="OFF",classes=classes,testmethod = "t.test", Padj = "fdr", gcase = "case", gcontrol = "control",
paired = FALSE,rawpcut = 0.05, adjustpcut = 0.05, betadiffcut = 0.3,num=1,sole=FALSE);
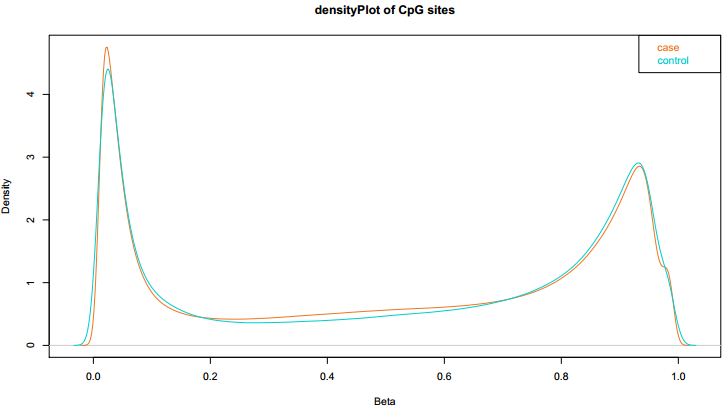
Fig 1-1: The density plot displays the lncRNA/PCG methylation value distributed in case and control. |
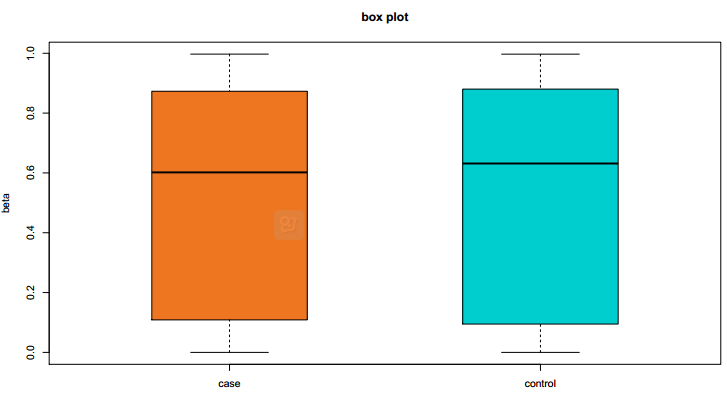
Fig 1-2: The box plot displays the lncRNA/PCG methylation value distributed in case and control. |
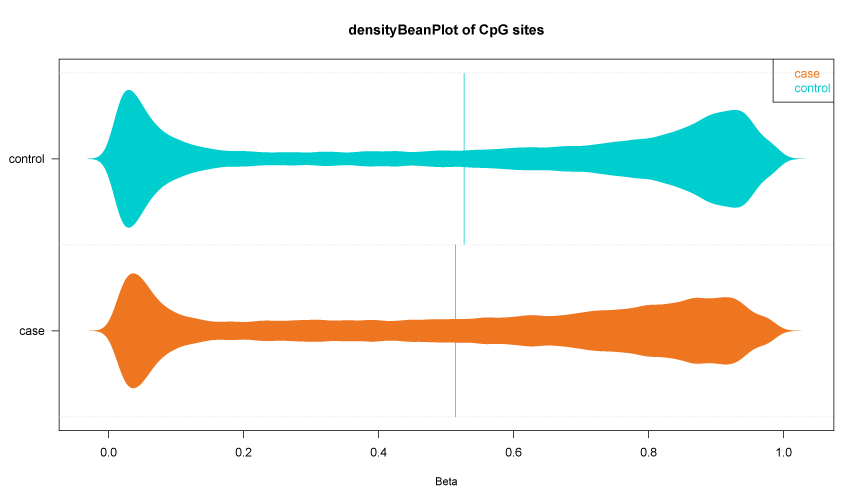
Fig 1-3: The violin plot displays the lncRNA/PCG methylation value distributed in case and control. |
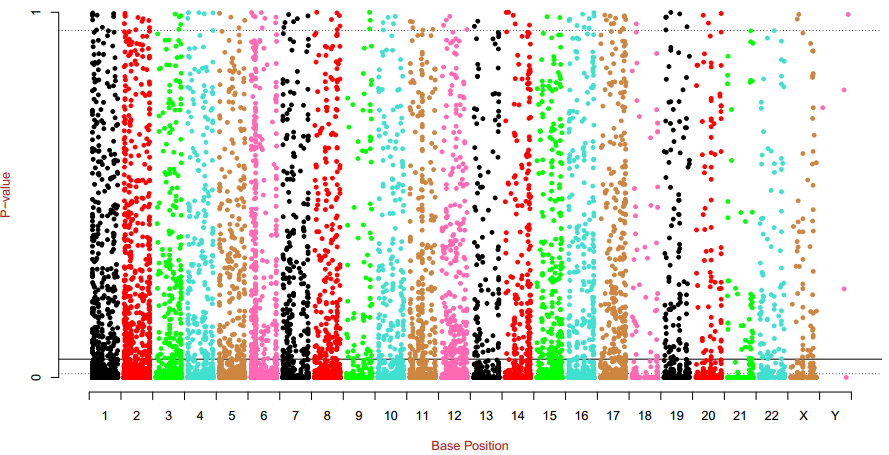
Fig 2-1: Manhattan plot displays the t test p values of the differentially methylated sites |
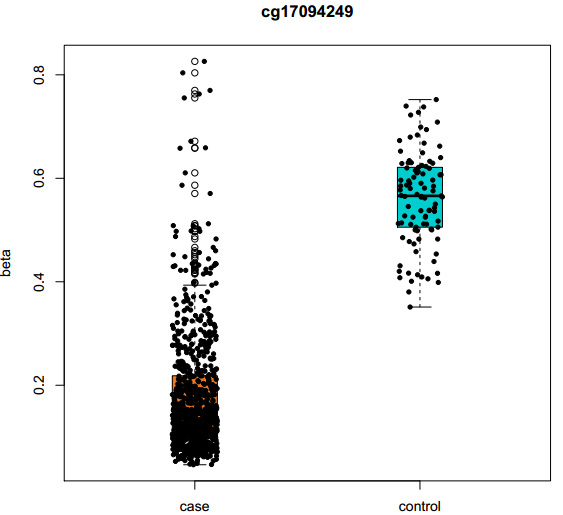
Fig 2-2: Box plot displays the DNA methylation value of the selected differentially methylated site in samples. |
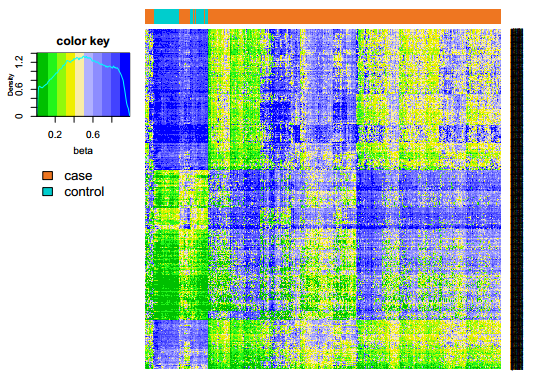
Fig 2-3: The heatmap plot displays the two-way hierarchical clustering result of the differentially methylated sites. |
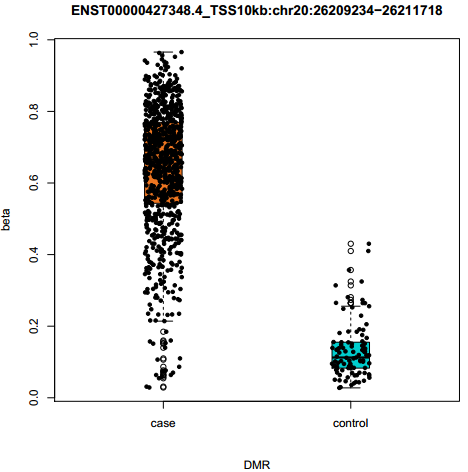
Fig 3-1: Boxplot displays the DNA methylation value of the selected differentially methylated region in samples. |
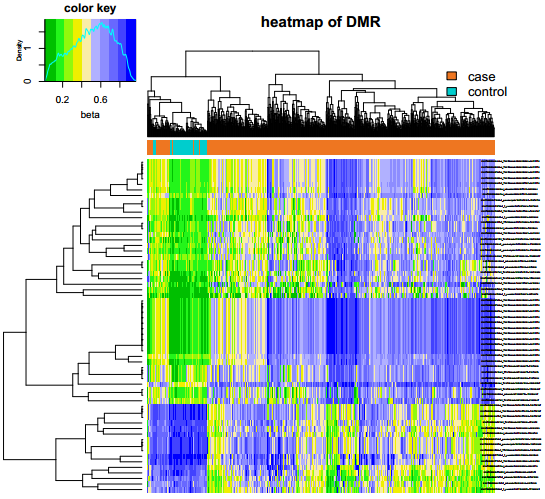
Fig 3-2: The heatmap displays the two-way hierarchical clustering result of the differentially methylated regions. |
|
Fig 4-1: The barplot displays the numbers of the probe-annotated transcript in each functional element |
Fig 4-2: The box plots display the methylation value of the disease and normal samples in all kinds of functional element |
| Availability: LncDM was implemented as an R package. |
| LncDM is maintained at http://lncdm.r-forge.r-project.org/ |