Best experienced using the browsers Chrome![]() Firefox
Firefox ![]() Safari
Safari ![]() or IE version (9,10,11)
or IE version (9,10,11) ![]()
- 01 Get an overview of Lnc2Meth from the Home page .
- 02 How to search Curation by disease name ?
- 03 How to search Curation by the regulatory relation type between the lncRNAs and DNA methylation ?
- 04 How to read results of Curation ?
- 05 How to read detail information of the entry in Curation ?
- 06 How to get the differential methylated lncRNAs/protein-coding genes(PCGs) for the interested diseases by Disease Centric Search ?
- 07 How to make use of Disease Centric Search results ?
- 08 How to do Hierarchical Clustering and Functional Annotation in Disease-Centric Search result page?
- 09 What's the difference between Differential Methylation Site, Differential Methylation Element and Differential Methylation Region ?
- 10 How to get diseases containing the target differentially methylated transcript by Transcript-Centric Search ?
- 11 How to make use of Transcript-Centric Search results ?
- 12 How to browse the lncRNAs/PCGs in DMBrowser and check the Prognostic Value of the target lncRNA/PCG ?
- 13 How to browse your interested transcript in DMBrowser ?
- 14 How to re-annotate probes from the Illumina Infinium 450k DNA methylation array to lncRNA/PCG loci ?
- 15 How to identify the Differential Methylation Patterns for the target lncRNA and PCG with the user-supplied external datasets ?
- 16 How to make use of the identified Differential Methylation Patterns ?
- 17 How to identify differentially methylated lncRNAs/PCGs in large scale with R package LncDM ?
- 18 How to download the calculated differential DNA methylation profiles of lncRNAs and PCGs in disease ?
The Home page is displayed in Figure 1-1:
1. Main functions of the database are provided in menu bar form (boxed in red).
2. A quick view of functions in Lnc2Meth.
3. The resource of lncRNAs in Lnc2Meth.
4. Introductions of the functions in Lnc2Meth.
5. A quick search for lncRNAs linked to Curation.
6. The number of regulatory relationship between human lncRNAs and DNA methylation (different color represent different regulatory relationship).
7. The number of differentially methylated transcripts (different color represent different transcripts: lincRNAs, processed transcripts, pseudogenes, protein-coding genes) in diseases.
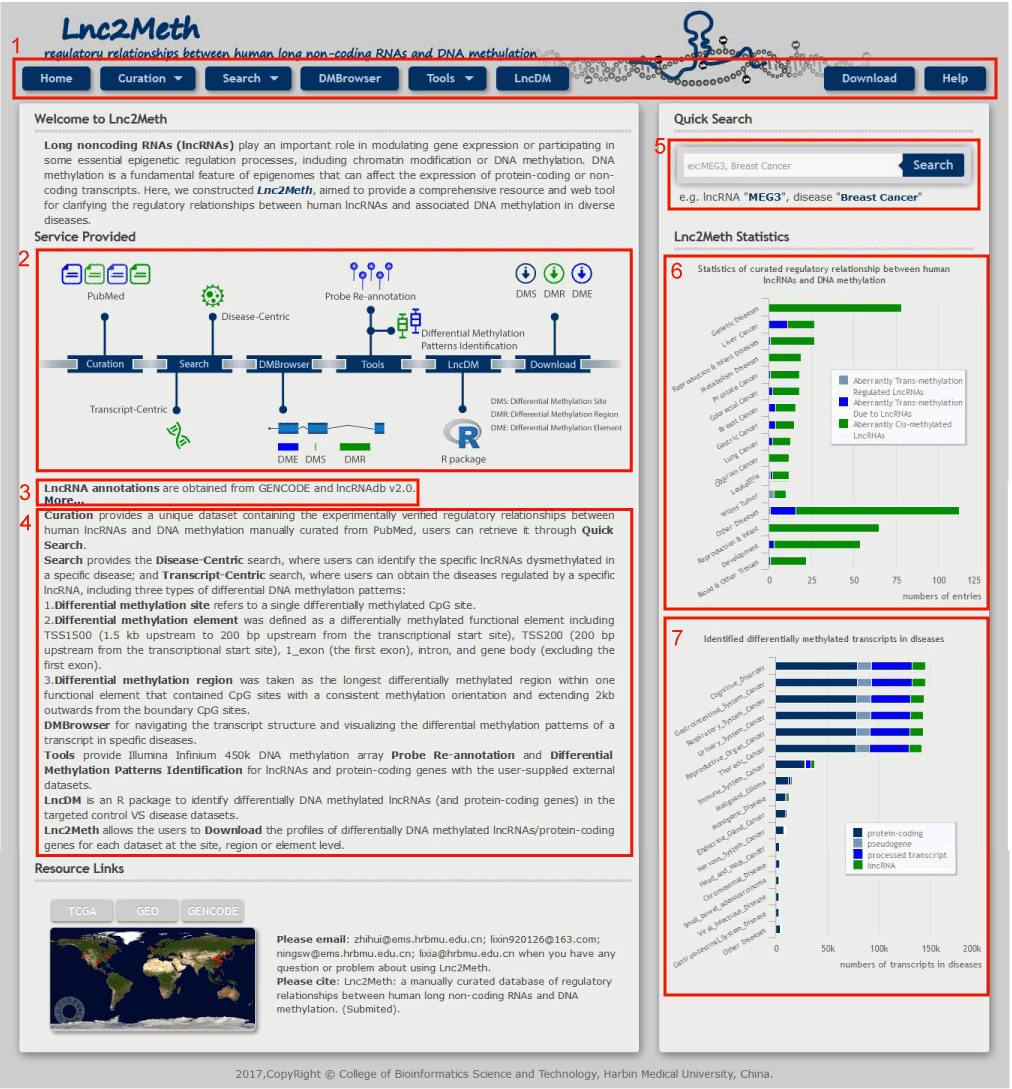
Figure 1-1 Homepage
In the Disease-Centric page from the drop-down menu of Curation, there are two ways to search by disease name
Figure 2-1:
1. Input disease name to search.
2. Browse and click to select the interested disease from the drop-down 'Disease' list on the left-hand side of the page.
3. Browse and click to select the interested disease according to its anatomical classification in human bodymap.
4. After step 1, 2 or 3, you will get the result page with the target disease.
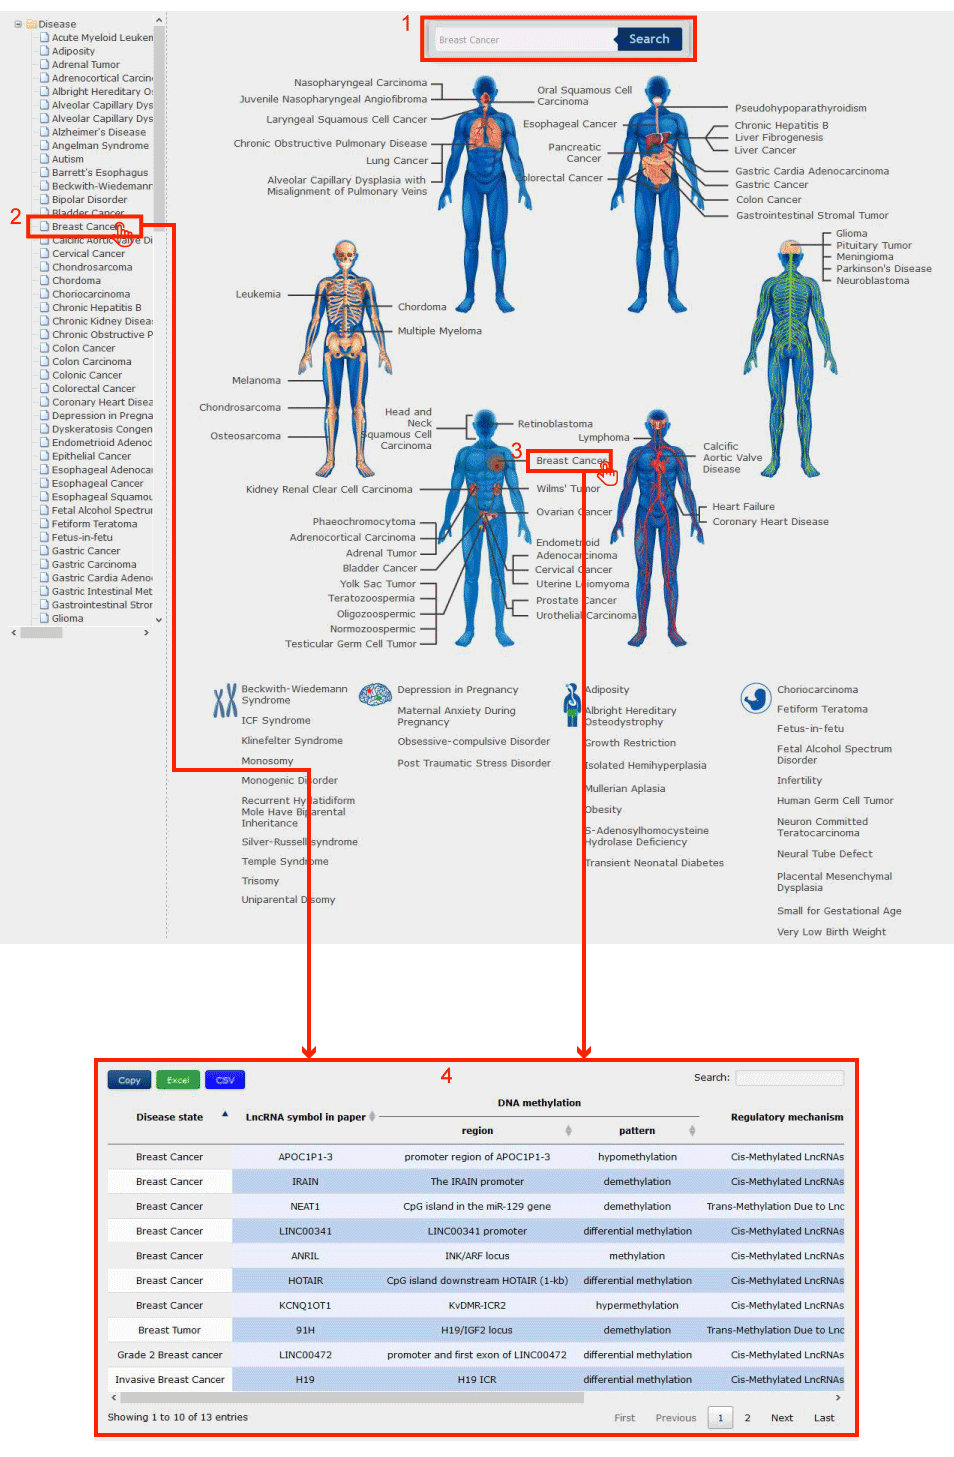
Figure 2-1 Disease-Centric Page of Curation
We classified the regulatory relation between the lncRNAs and DNA methylation into three categories: Cis-Methylated LncRNAs (CML), Trans-Methylation Due to LncRNAs (TMDL), Trans-Methylation Regulated LncRNAs (TMRL)
Figure 3-1:
1. Click on the interested lncRNA name or the interested Methylation Pattern ( differential methylation, hypermethylation, hypomethylation, methylation, demethylation ) in the left menu to search.
2. Click on the interested regulatory relation type to get all the relations belong to this type.
3. Input lncRNA name to search.
You will get the result page as 4.
Figure 3-1 Transcript-Centric Page of Curation
In the result page, all entries are listed with basic information including Disease state, LncRNA symbol in paper, DNA methylation region, DNA methylation pattern, Regulatory mechanism, Prognostic value, Year, PubMedID and link to the detail information.
Figure 4-1:
1. In curation result page, users can drag the slide block to see complete information in 2.
3. Click to download data.
4. Users can input keywords from any column to filter the results.
5. Click to check the detail information of the entry in 6.
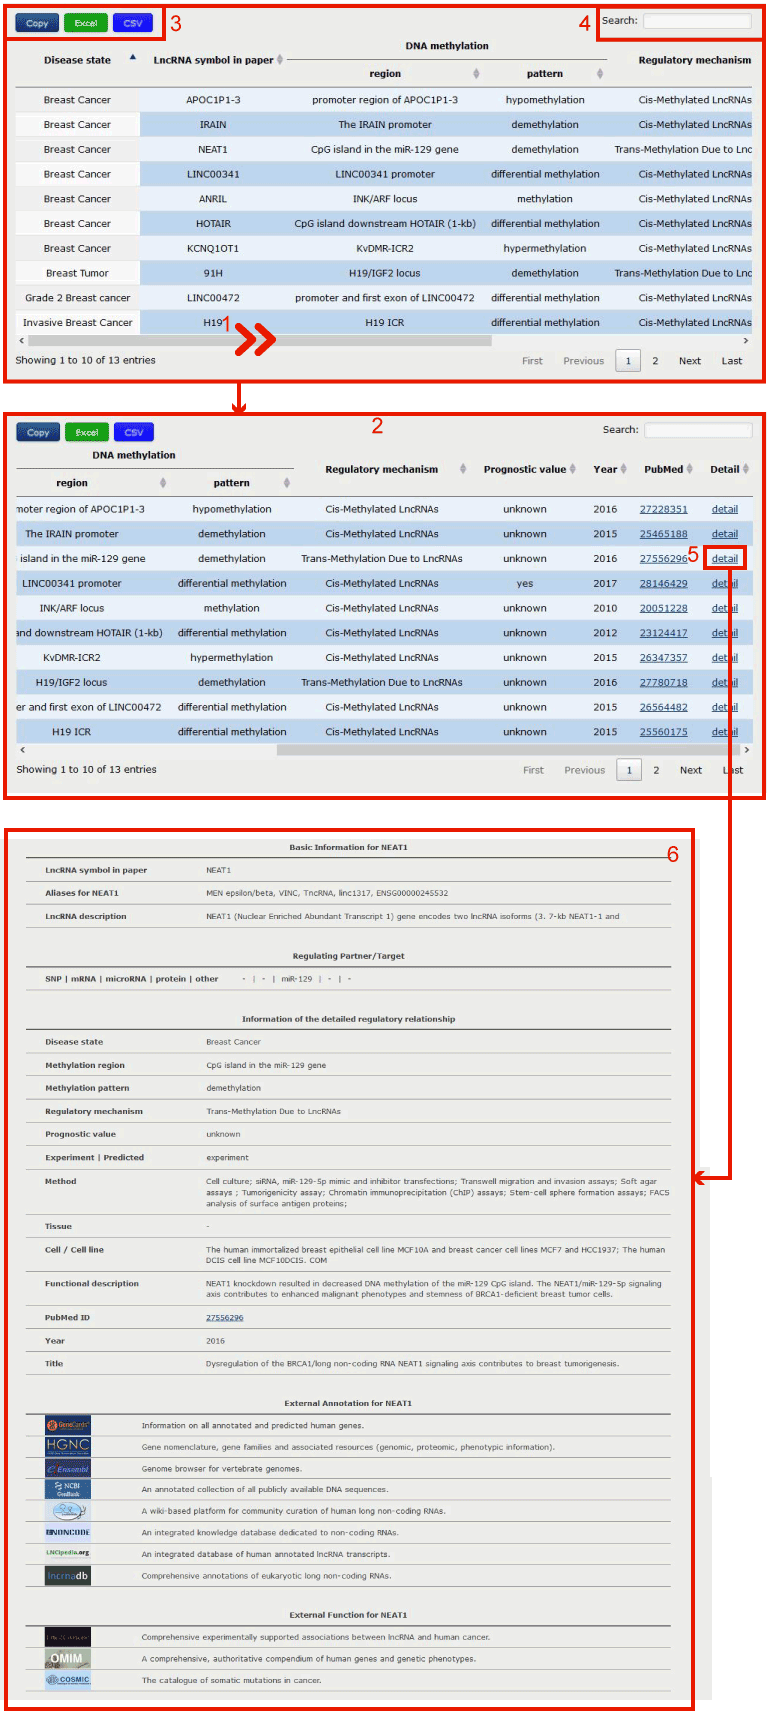
Figure 4-1 Regulatory relationships between lncRNA and DNA methylation
Detailed information of a specific lncRNA-methylation association
Figure 5-1:
1. Users can get the basic information for the hit lncRNA.
2. Users can get associated regulating partner/target in the regulatory processs of the target lncRNA.
3. Users can get detailed information of the regulatory process of the hit lncRNA and DNA methylation.
4. Users can search the external annotation information for the lncRNA by clicking on the corresponding hyperlink logo.
5. Users can search the external function information for the lncRNA by clicking on the corresponding hyperlink logo.
Figure 5-1 Detailed information of a specific lncRNA-methylation association
Figure 6-1 display search interface of Disease-Centric Search
1. Select your interested diseases.
2. Click to select transcript type (lincRNA, processed transcript, pseudogene or PCG).
3. Click to select the interested DNA methylation region.
4. Click to select the threshold of the absolute difference DNA methylation value of lncRNA/PCG between disease and normal samples.
5. Note: options marked with * are required.
Click submit to complete the retrieval, you will get page as 6.
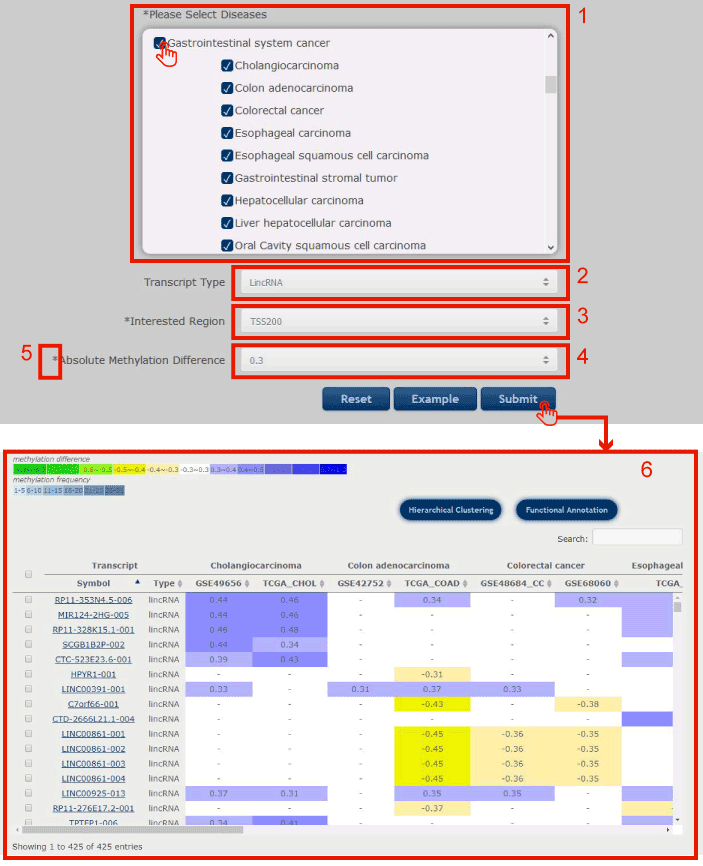
Figure 6-1 Disease-Centric Search Page
The disease centric search return a entry table illustrated as a heatmap with the methylation differences between disease and normal samples, and the last column of the table showed the differential methylation frequencies of each transcript in all types of disease stored in Lnc2Meth.
Figure 7-1
1. Users can input keywords from any column to filter the results.
2. Click to search all the diseases containing the target differentially methylated transcript, and you will get the result page as 5.
3. Users can drag the slide block to see complete transcripts information.
4. Users can drag the slide block to see complete diseases information.
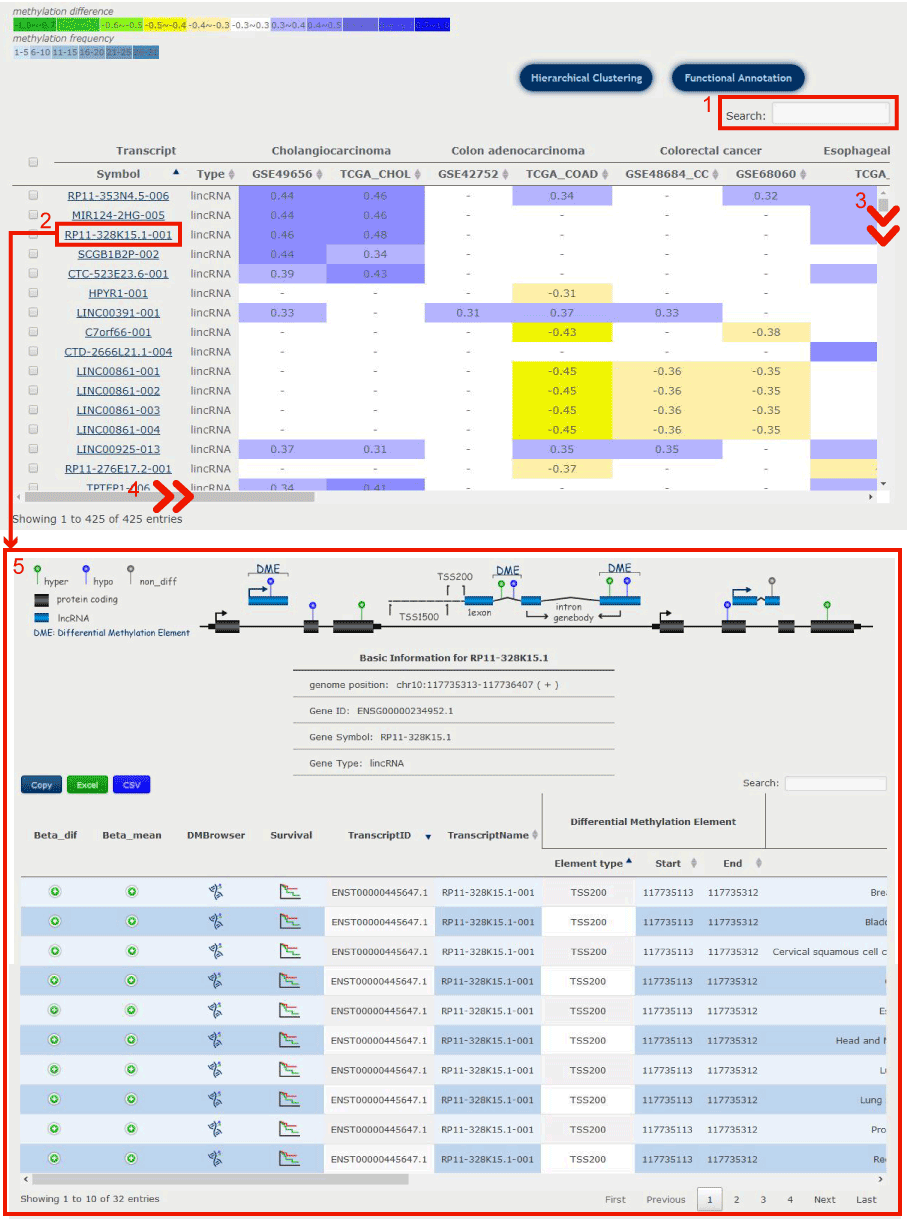
Figure 7-1 Differentially methylated transcripts in the selected diseases
In disease-centric result page, users can do Hierarchical Clustering and Functional Annotation by selecting interested differentially methylated transcripts.
Figure 8-1
1. Click to select the interested differentially methylated transcripts.
2. Click to perform two-way hierachical cluster analysis of the methylation profile of the selected transcripts in diseases, and you will get the result page as 4.
3. Click to perform the functional analysis through the GREAT web service for the selected transcripts, and you will get the result page as 5.
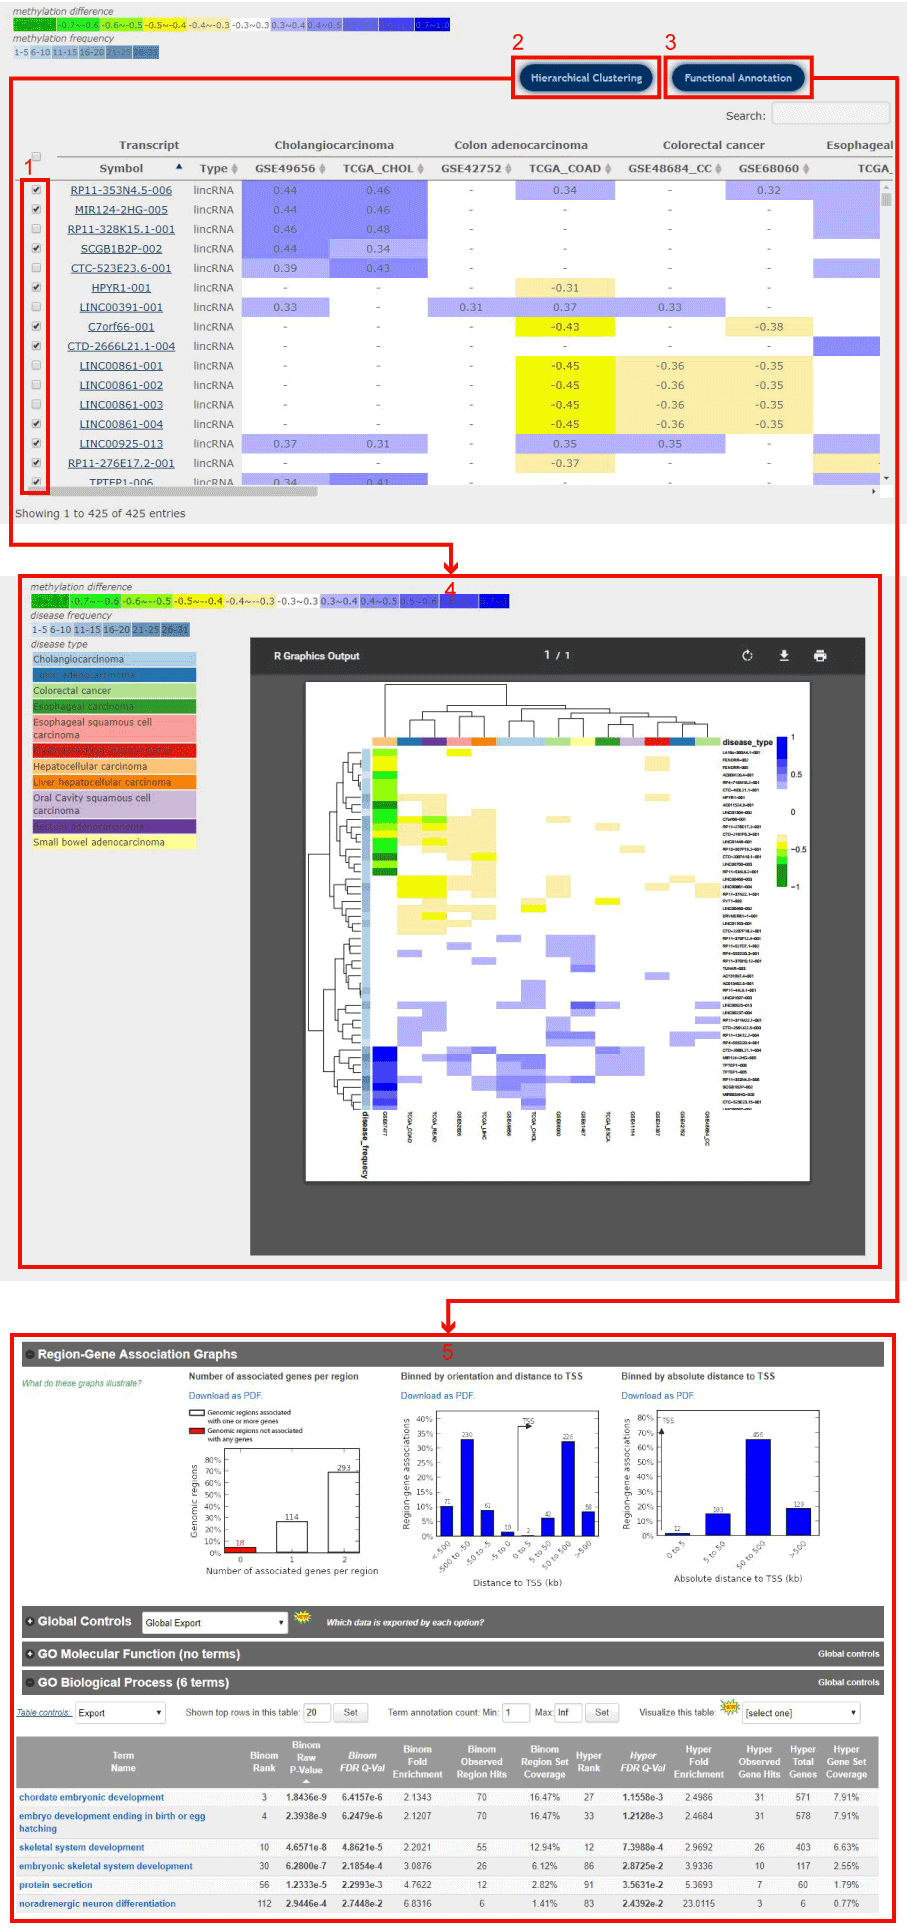
Figure 8-1 Hierarchical Clustering and Functional Annotation
The difference of differential methylation site, differential methylation element and differential methylation region
Figure 9-1:
Differential methylation site refers to a single differentially methylated CpG site, such as 1 2 3 and 4.

Figure 9-1 Differential Methylation Site
Figure 9-2:
Differential methylation element was defined as a differentially methylated functional element including TSS1500 (1.5 kb upstream to 200 bp upstream from the transcriptional start site), TSS200 (200 bp upstream from the transcriptional start site), 1_exon (the first exon), intron, and gene body (excluding the first exon), such as 1 2 and 3.

Figure 9-2 Differential Methylation Region
Figure 9-3:
Differential methylation region was taken as the longest differentially methylated region within one functional element that contained CpG sites with a consistent methylation orientation and extending 2kb outwards from the boundary CpG sites, such as 1 and 2.

Figure 9-3 Differential Methylation Element
Figure 10-1:
1. Input lncRNA/protein-coding gene by symbol or Ensembl gene id.
2. Click to select differential methylation pattern from Differential methylation site, Differential methylation region or Differential methylation element.
3. Click to select interested DNA methylation region.
4. Click to select hypermethylation, hypomethylation or hyper and hypo.
5. Click to select the threshold of the absolute difference DNA methylation value of lncRNA/PCG between disease and normal samples.
Click submit to get the result page in 6 (differential methylation site), 7 (differential methylation region) and 8 (differential methylation element).
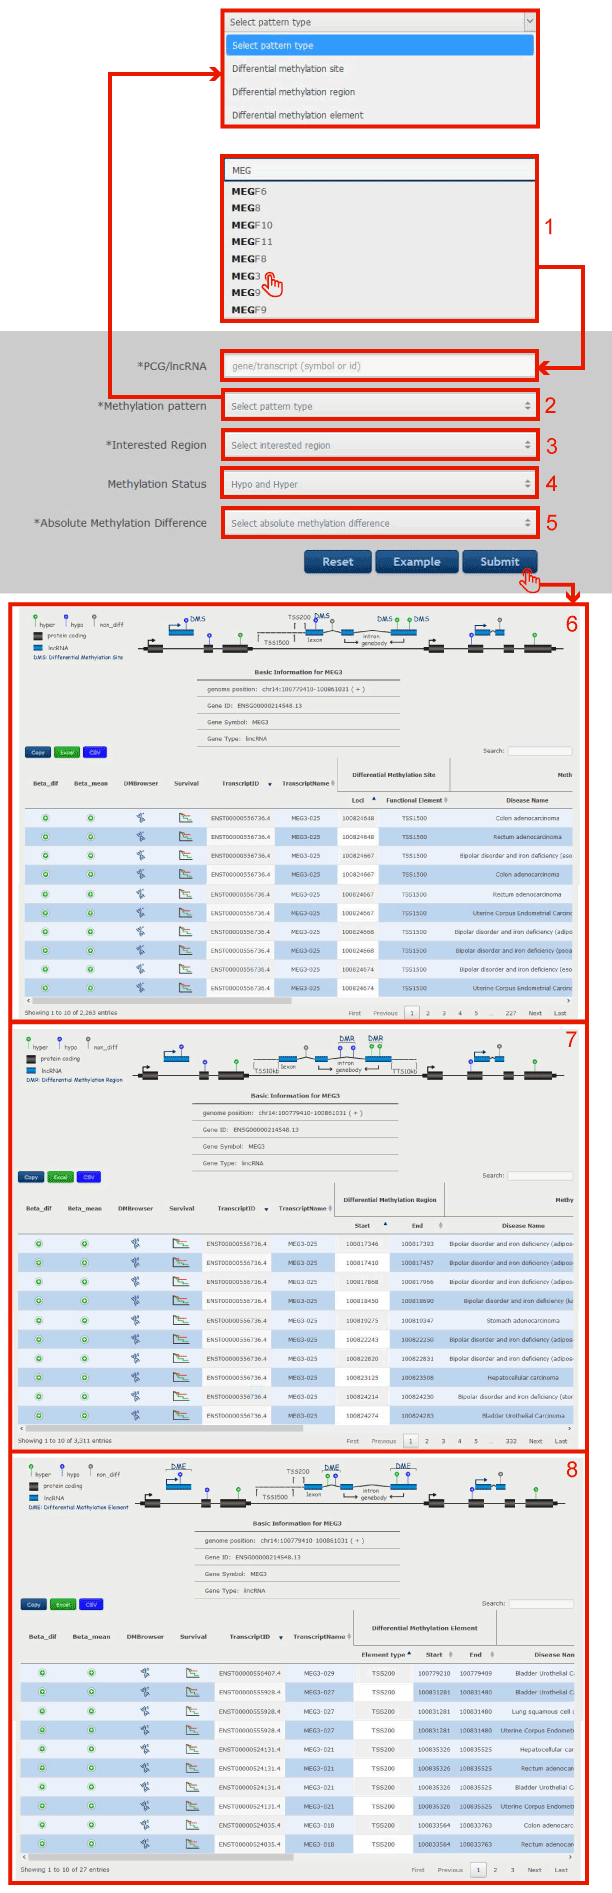
Figure 10-1 Transcript-Centric Search Page
Figure 11-1:
1. Get the basic information of the hit lncRNA/PCG of genome loci, gene id, gene symbol and gene type.

Figure 11-1 Basic information for Differential Methylation in ENSG00000253616.4
In the Transcript-Centric Search Result page, you can get the information of Transcript id, Transcript name, Differential Methylation Information, Methylation Status in Disease, and its Correlation with Expression.
Figure 11-2:
1. Click to see the disease types containing the retrieval lncRNA/PCG, the barplot displays mean methylation value in disease and normal samples.
2. Click to see the disease types containing the retrieval lncRNA/PCG, the barplot displays methylation value difference in diseases.
3. Click to link to DMbrowser.
4. Click to check the prognostic value.
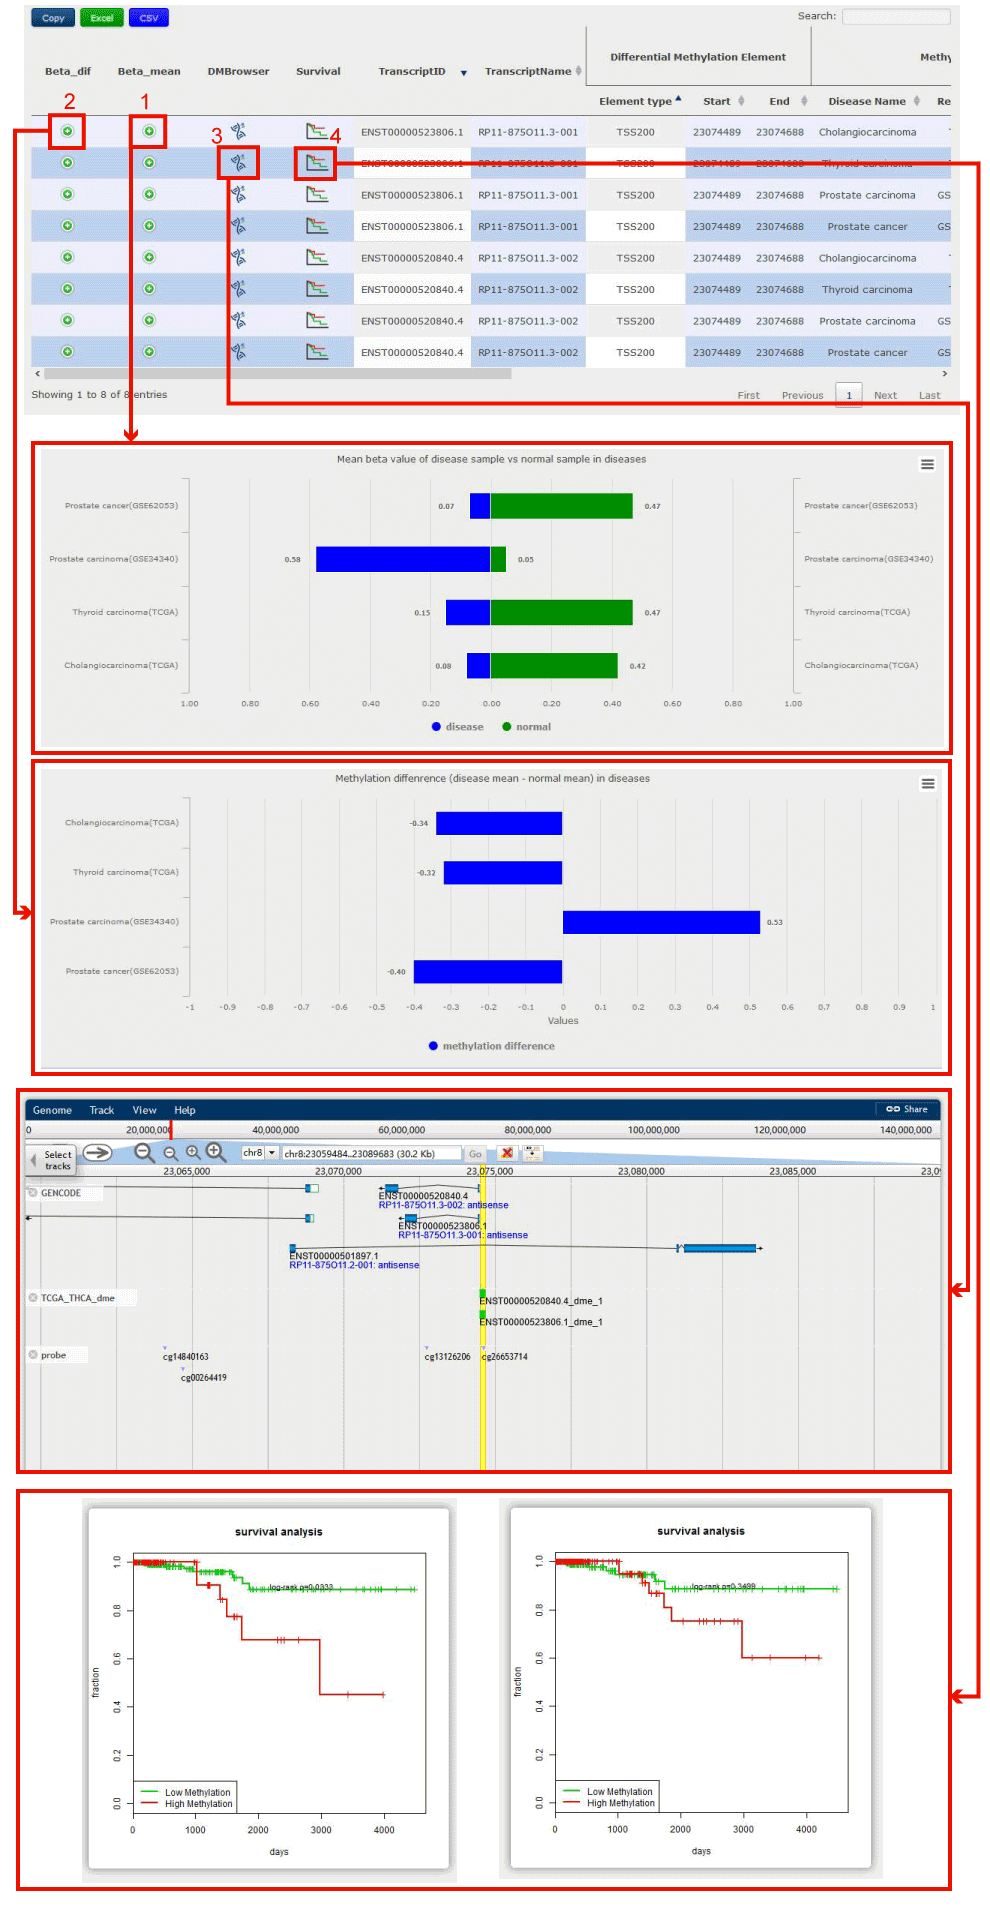
Figure 11-2 Transcript-Centric Result of ENSG00000253616.4
Figure 11-3:
1. Users can search the external annotation information for the lncRNA by clicking on the corresponding hyperlink logo.
2. Users can search the external function information for the lncRNA by clicking on the corresponding hyperlink logo.
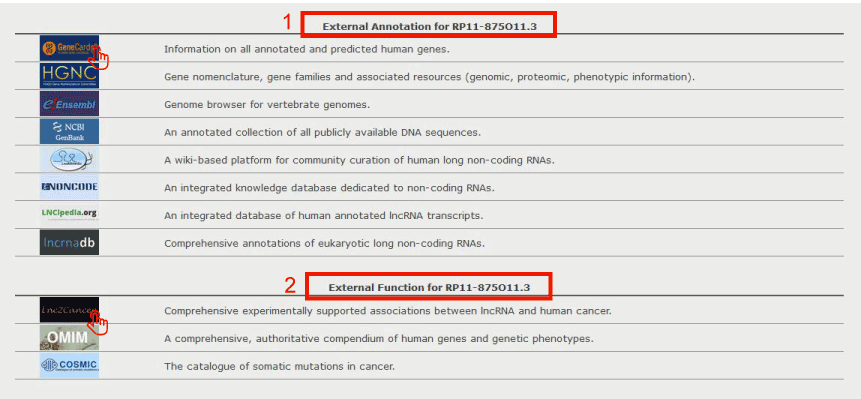
Figure 11-3 External links to other databases
Figure 12-1:
1. Click to link to DMbrowser in Figure 12-2.
2. Click to check the prognostic value for the target transcript calculated from the patient clinical data downloaded from TCGA in Figure 12-3.
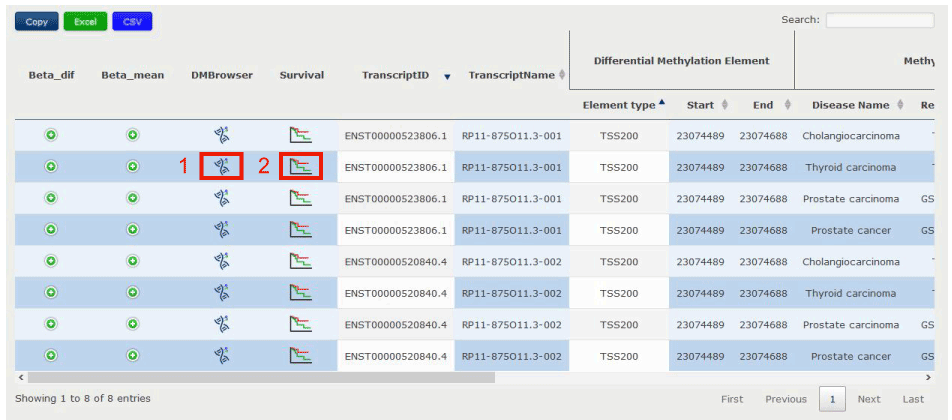
Figure 12-1 Specific methylation status of ENST00000520840.4
Figure 12-2:
1. Users can check the structure of the transcript in DMBrowser.
2. Users can check the differential DNA methylation pattern (DMS: Differential Methylation Site, DMR: Differential Methylation Region, DME: Differential Methylation Element; green represents hypomethylation, blue represents hypermethylation).
3. Users can check the probes from Illumina Infinium 450k DNA methylation array located in the region of 2.
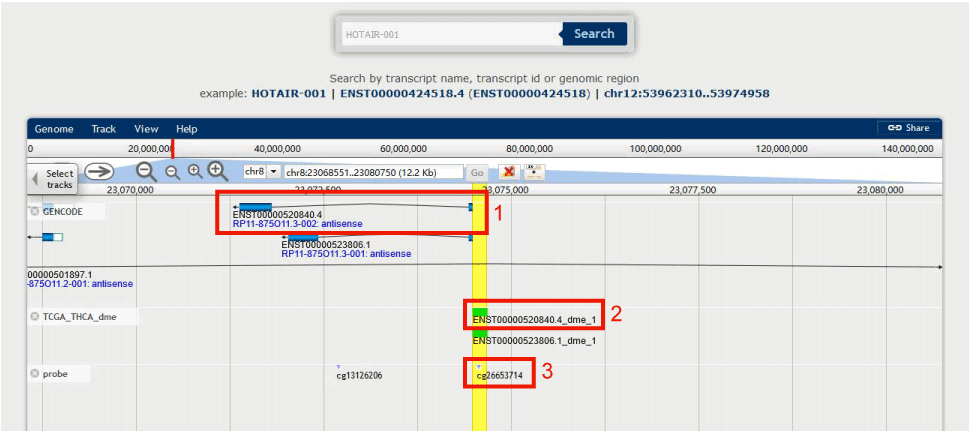
Figure 12-2 Browse genome position of TSS200 in ENST00000520840.4
We calculated Kaplan–Meier log-rank P-values to the target lncRNAs or PCGs with overall survival (OS)-associated methylation patterns.
Figure 12-3:
1. Click to get the survival analysis result, we seperate samples into 2 groups by the mean methylation value of each sample, and users can get the result in 2 with the Kaplan–Meier log-rank p value.
3. Click to get the survival analysis result, we seperate samples into 2 groups by the median methylation value of each sample, and users can get the result in 4 with the Kaplan–Meier log-rank p value.
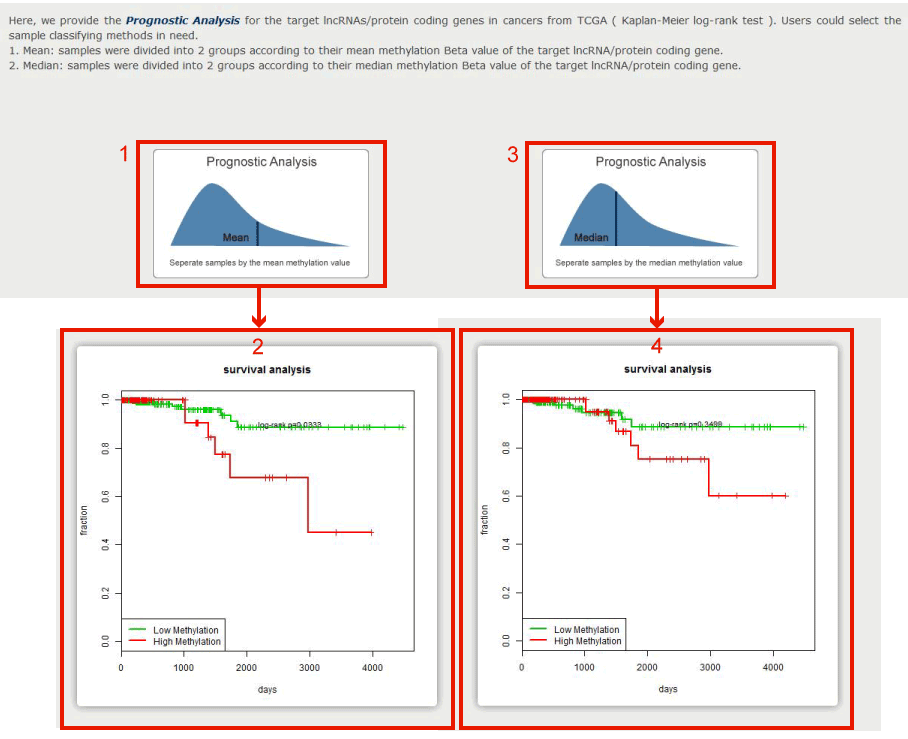
Figure 12-3 Survival analysis of differential methylation element (TSS200) in ENST00000520840.4
Figure 13-1:
1. Input the interested lncRNA/PCG symbol or Ensembl gene id or genomic region, and click search to get transcript information in DMBrowser.
2. Users can check the structure of the transcript in DMBrowser.
3. Users can check the probes from Illumina Infinium 450k DNA methylation array located in the transcript.
4. Click to select your interested diseases.
5. Select disease dataset(s).
6. Users can get the differential methylation region in the selected dataset(s) of the request transcript.
7. For the track of lncRNA transcripts, DMBrowser provides links to the UCSC Genome Browser for users further investigating the characteristics of the lncRNAs and methylation.
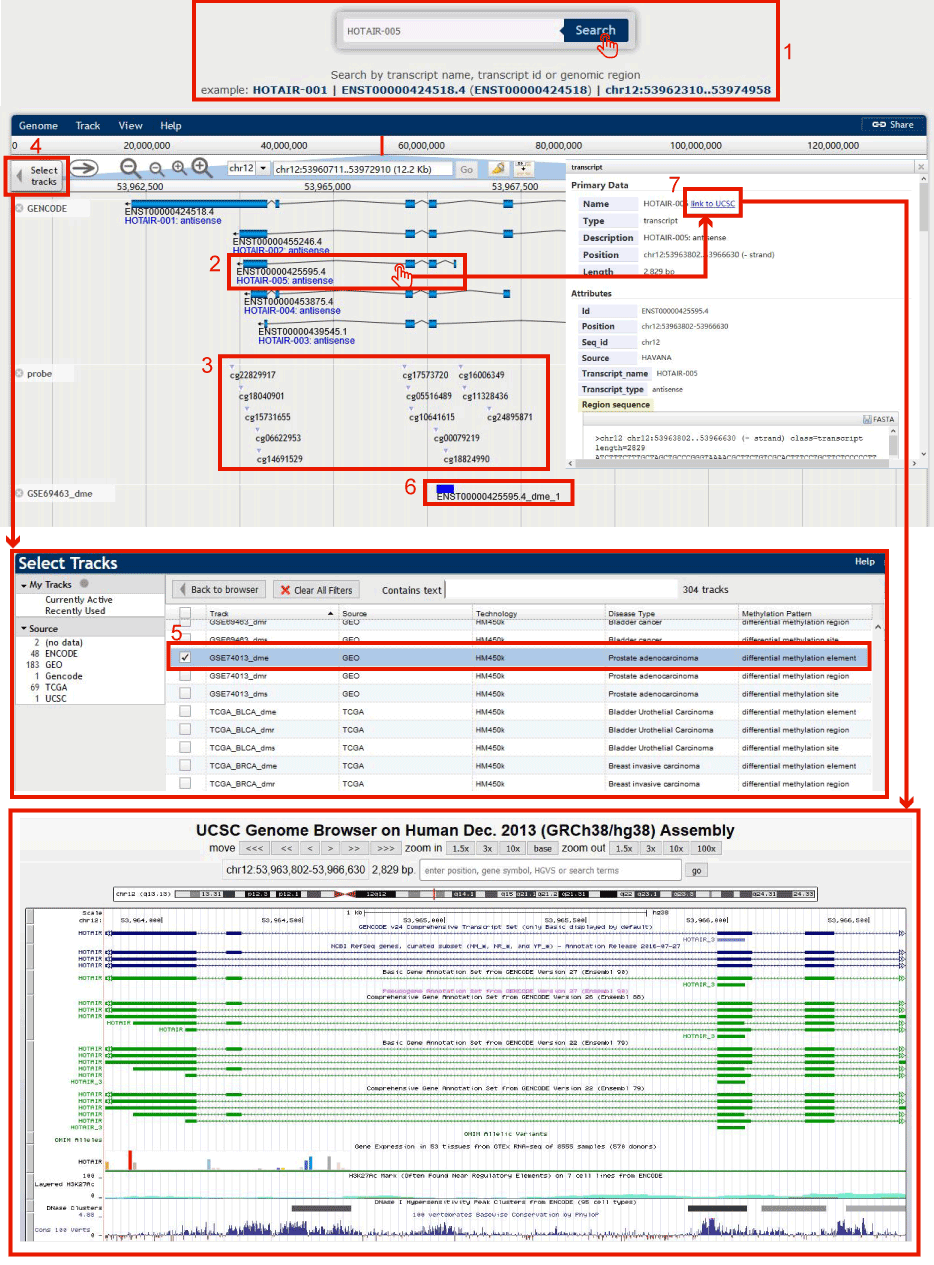
Figure 13-1 Search HOTAIR-005 in DMBrowser
Figure 14-1:
1. Input lncRNA/protein-coding gene by symbol or Ensembl gene id.
2. Or input the information of a newly-assembled lncRNA.
3. Click to download the re-annotation results.
4. Probe id of the Illumina Infinium 450k DNA methylation array.
5. Genome loci of the probe.
6. Drag the slide block to see complete information in 7.
8. Users can input keywords from any column to filter the results.
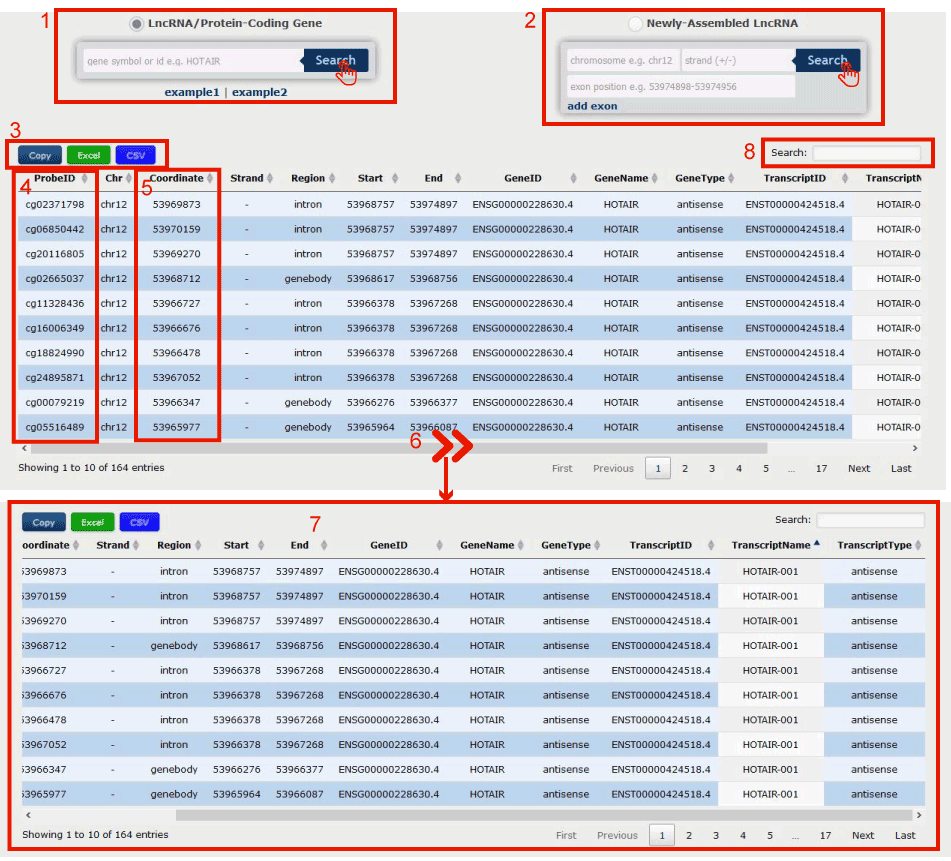
Figure 14-1 Probe re-annotaion
Figure 15-1 displays steps to download your methylation profile
1. Users can calculate methylation Beta value according to our formula.
2. Input your request lncRNA/protein-coding gene.
3. Upload Illumina Infinium 450k DNA methylation array data with the same format as our example data.
4. Choose 'yes', if there is a missing value in your methylation profile (the missing methylation value = NA).
5. Click on the 'Submit' button to download the returned methylation profile of the lncRNA/PCG.
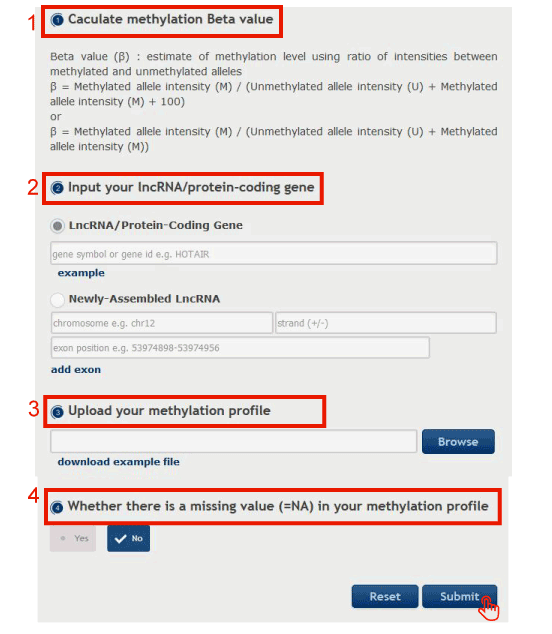
Figure 15-1 Get the request lncRNA/PCG's methylation profiles
Select the differential methylation pattern ( Differential Methylation Site, Differential Methylation Element and Differential Methylation Region ) according to the following schematic illustrative examples
Figure 15-2:
1. Select to identify 'Differential Methylation Site'.
2. Select to identify 'Differential Methylation Element'.
3. Select to identify 'Differential Methylation Region'.
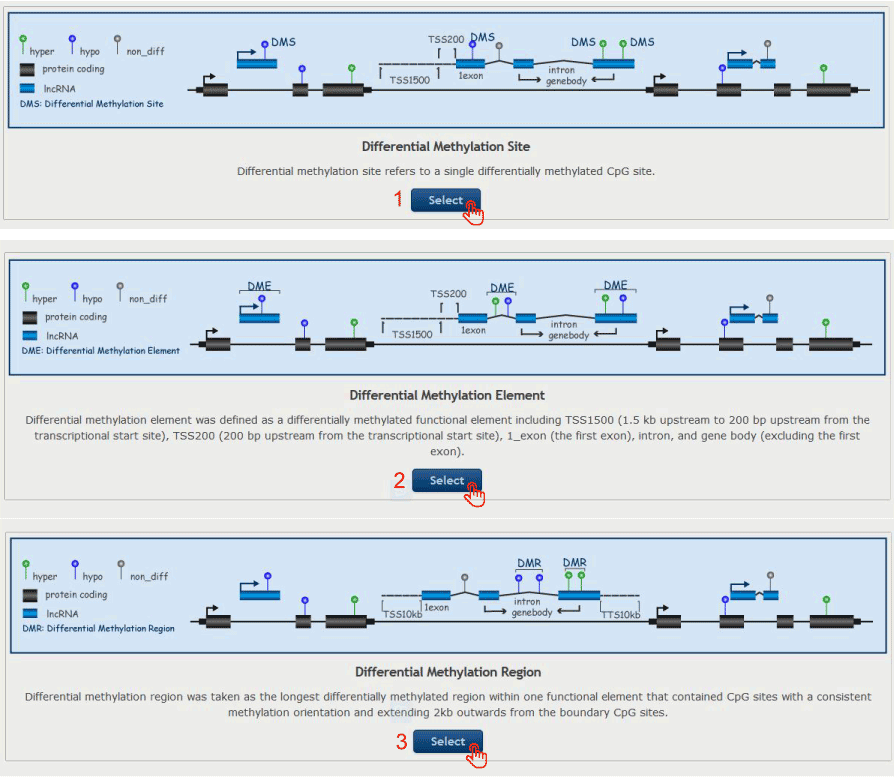
Figure 15-2 Select and identify the differential methylation pattern
Identify differential methylation patterns for the request lncRNA/PCG
Figure 15-3:
1. Upload or paste the methylation profile obtained from Figure 15-1.
2. Upload or paste the phenotypes of the samples appearing in the methylation profile, with the same data format as our examples.
3. Input your request lncRNA/PCG.
4. Click on the 'Submit' button to access the Results page.
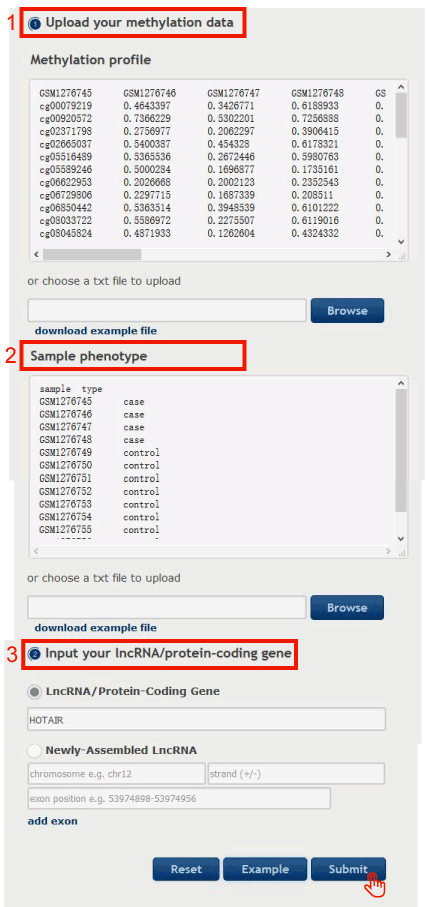
Figure 15-3 Identify differential methylation patterns for the request lncRNA/PCG
There are 4 types visualization for the identified lncRNA/PCG
Figure 16-1:
1. Click to select the corresponding DNA methylation region.
2. The heatmap plot displays the two-way hierarchical clustering of the methylation profile.
3. The density plot displays the distributed methylation value in case and control samples separately.
4. The violin plot displays the distributed methylation value in case and control samples separately.
5. The box plot displays the distributed methylation value in case and control samples separately.
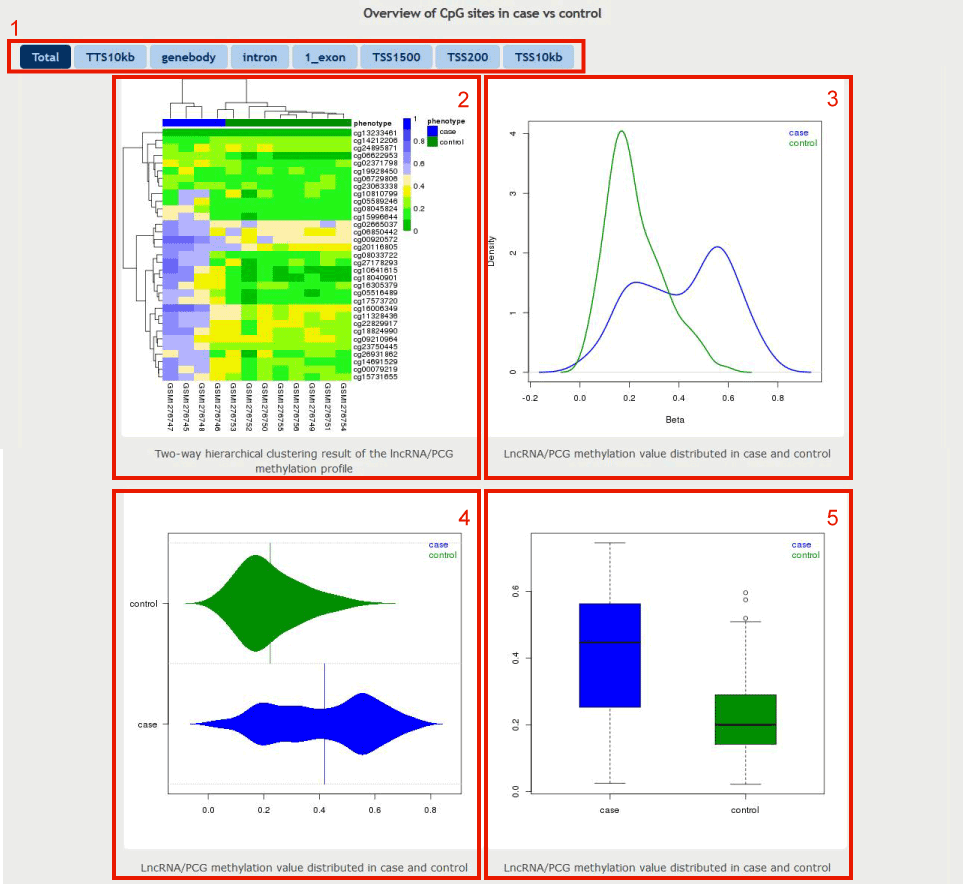
Figure 16-1 An overview of user's methylation profile
Figure 16-2 displayes the text result for the lncRNA/PCG, including transcript id, transcript name, transcript type, probe id, chromosome, probe loci, methylation region, methylation status and t test FDR value.
1. Click to download the results.
2. Click to get boxplot of methylation value in two groups (case and control) of samples.
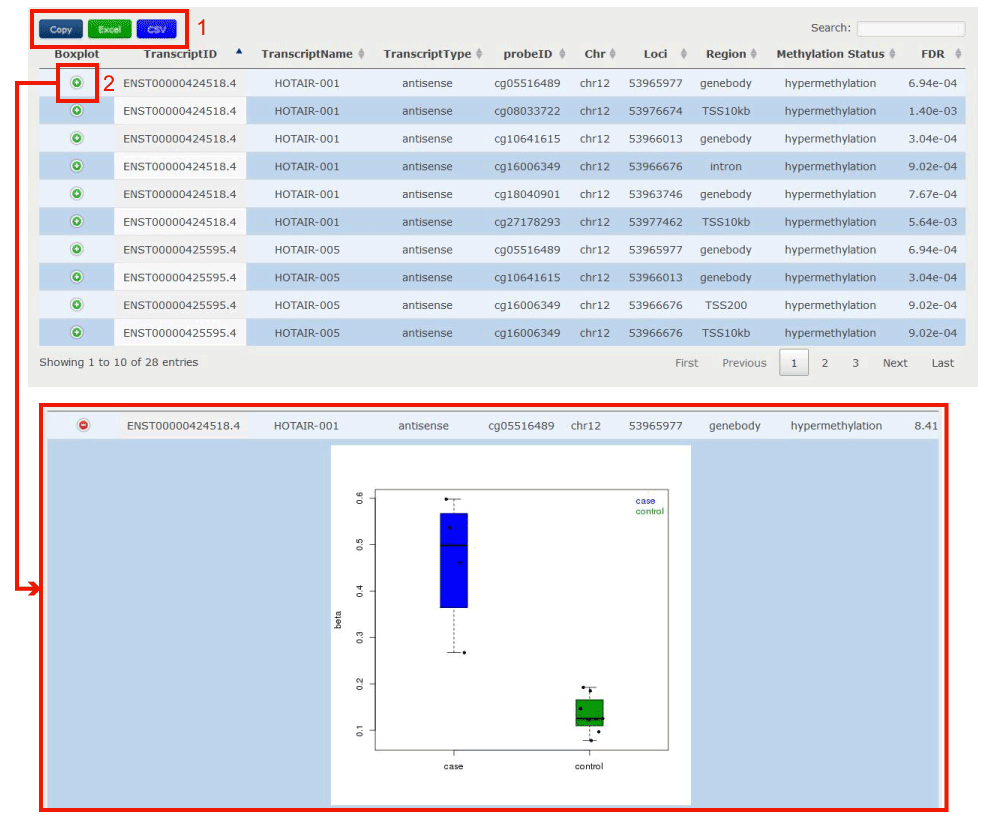
Figure 16-2 Differential Methylation Sites Identification results
Installation.
1.The LncDM package requires R version >= 3.30;
2.The LncDM package requires the following packages to be installed: beanplot,reshape,gplots,WriteXLS,MASS,impute,limma,preprocessCore. If your system does not have them installed, the easiest way to install them is to issue the following command at the R prompt: source("http://bioconductor.org/biocLite.R"); biocLite(c("impute","limma","preprocessCore")); install.packages(c("beanplot","reshape","gplots","WriteXLS","MASS"),repos="http://cran.r-project.org");
3.Install LncDM package: install.packages("LncDM", repos="http://R-Forge.R-project.org");
Tutorial
1.A vignentte that illustrate various aspects of LncDM is available here.
2.The user manual of LncDM package could be found here.
3.The project summary page you can find here.
Download example data
Download page displayed disease information, data source information and Pubmed ID.
Figure 18-1:
1. Click to download the differential methylation site profile for the select dataset.
2. Click to download the differential methylation region profile for the select dataset.
3. Click to download the differential methylation element profile for the select dataset.
4. We have provided the option for bulk downloading data from the download web page.
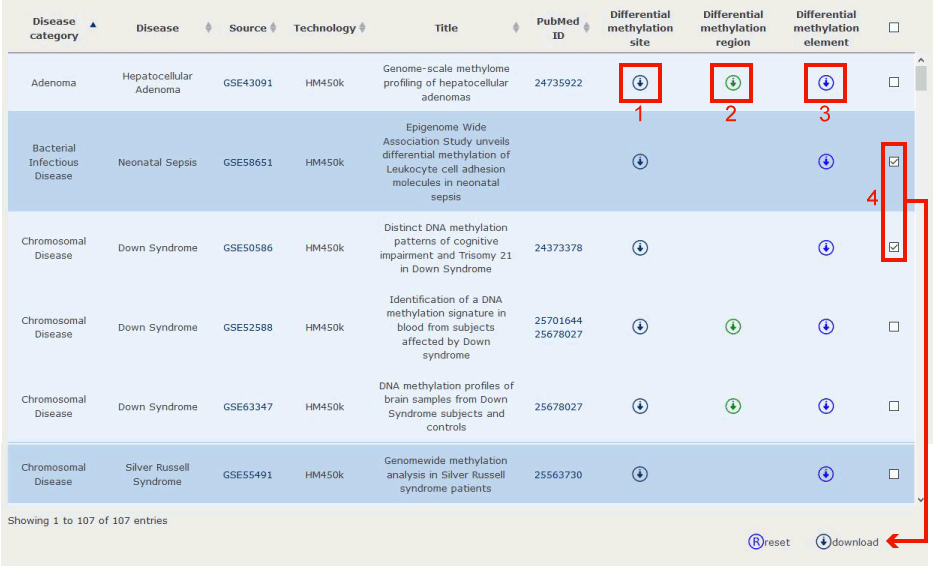
Figure 18-1 Download data