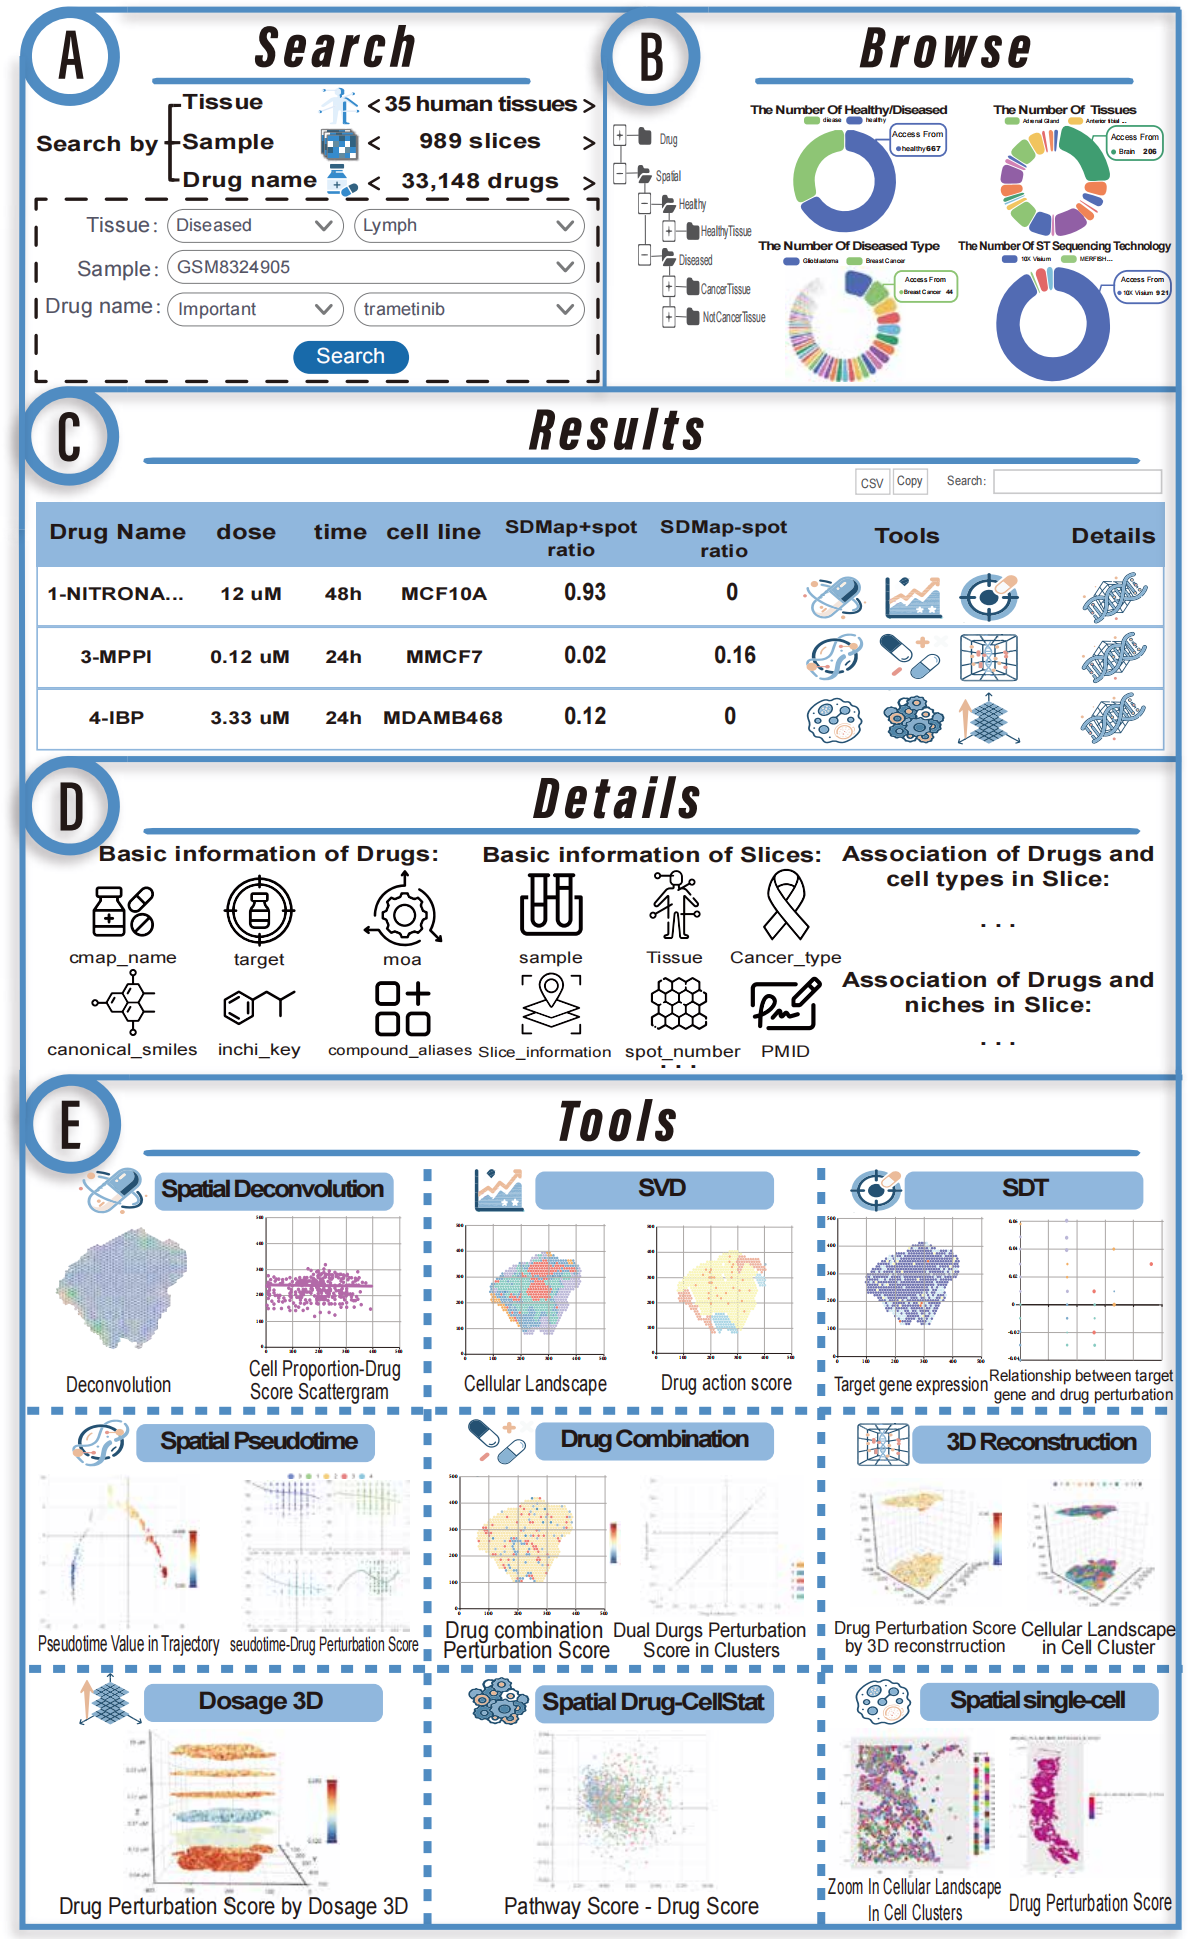
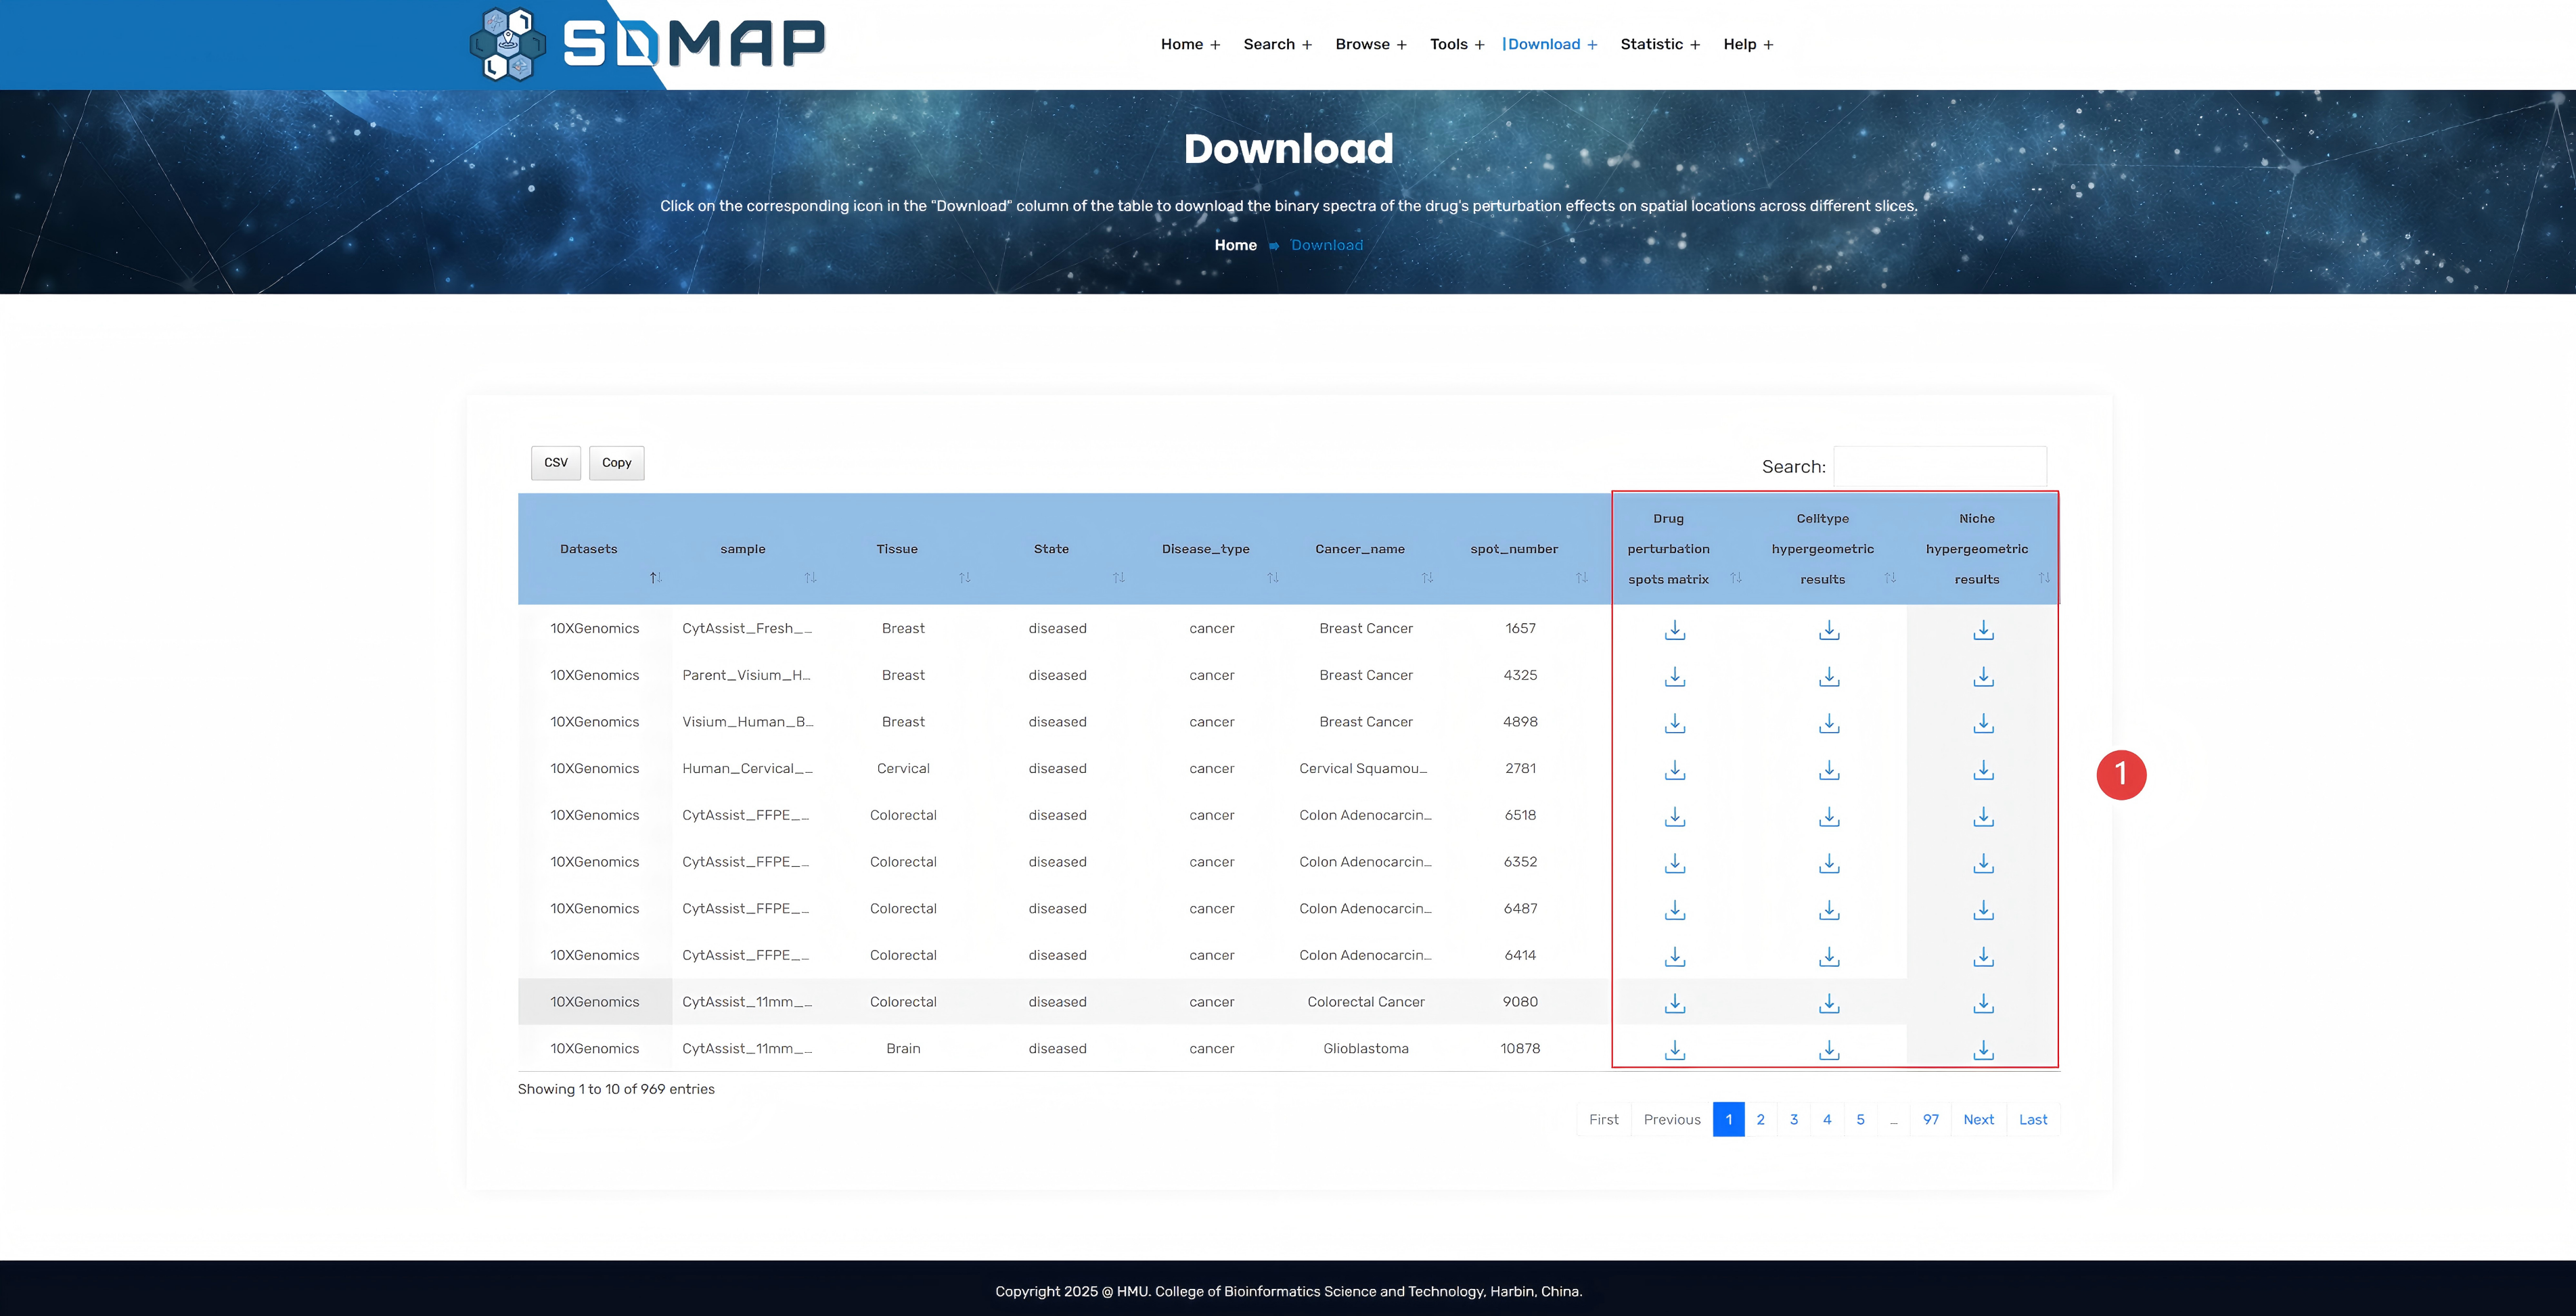
1.Analysis of the relationship between drug perturbation scores and spatial deconvolution.
2.Identification of spatially variable drugs.
3.Visualization of spatial distribution of drug targets.
4.Spatial pseudotime analysis of drug perturbation scores.
5.Simulation of combined drug spatial perturbation.
6.3D stereo spatial drug perturbation visualization.
7.Cell-level perturbation analysis of single-cell resolution spatial transcriptomics.
8.Analysis of the relationship between drug perturbation scores and cancer pathway score.
9.Utilize this function to construct a dynamic 3D model of the same transcriptomic slice for perturbation
score data across different drug dosages under the same action time dimension, arranged in the order of dosages from low to high.
· The influence mechanism of cellular heterogeneity in the spatial dimension on drug perturbation response.
· The spatial specific molecular basis of tumor cell drug tolerance.
· As a basic resource library for drug action mechanism research, it helps the development of cell type-specific targeted therapy and the discovery of therapeutic biomarkers.
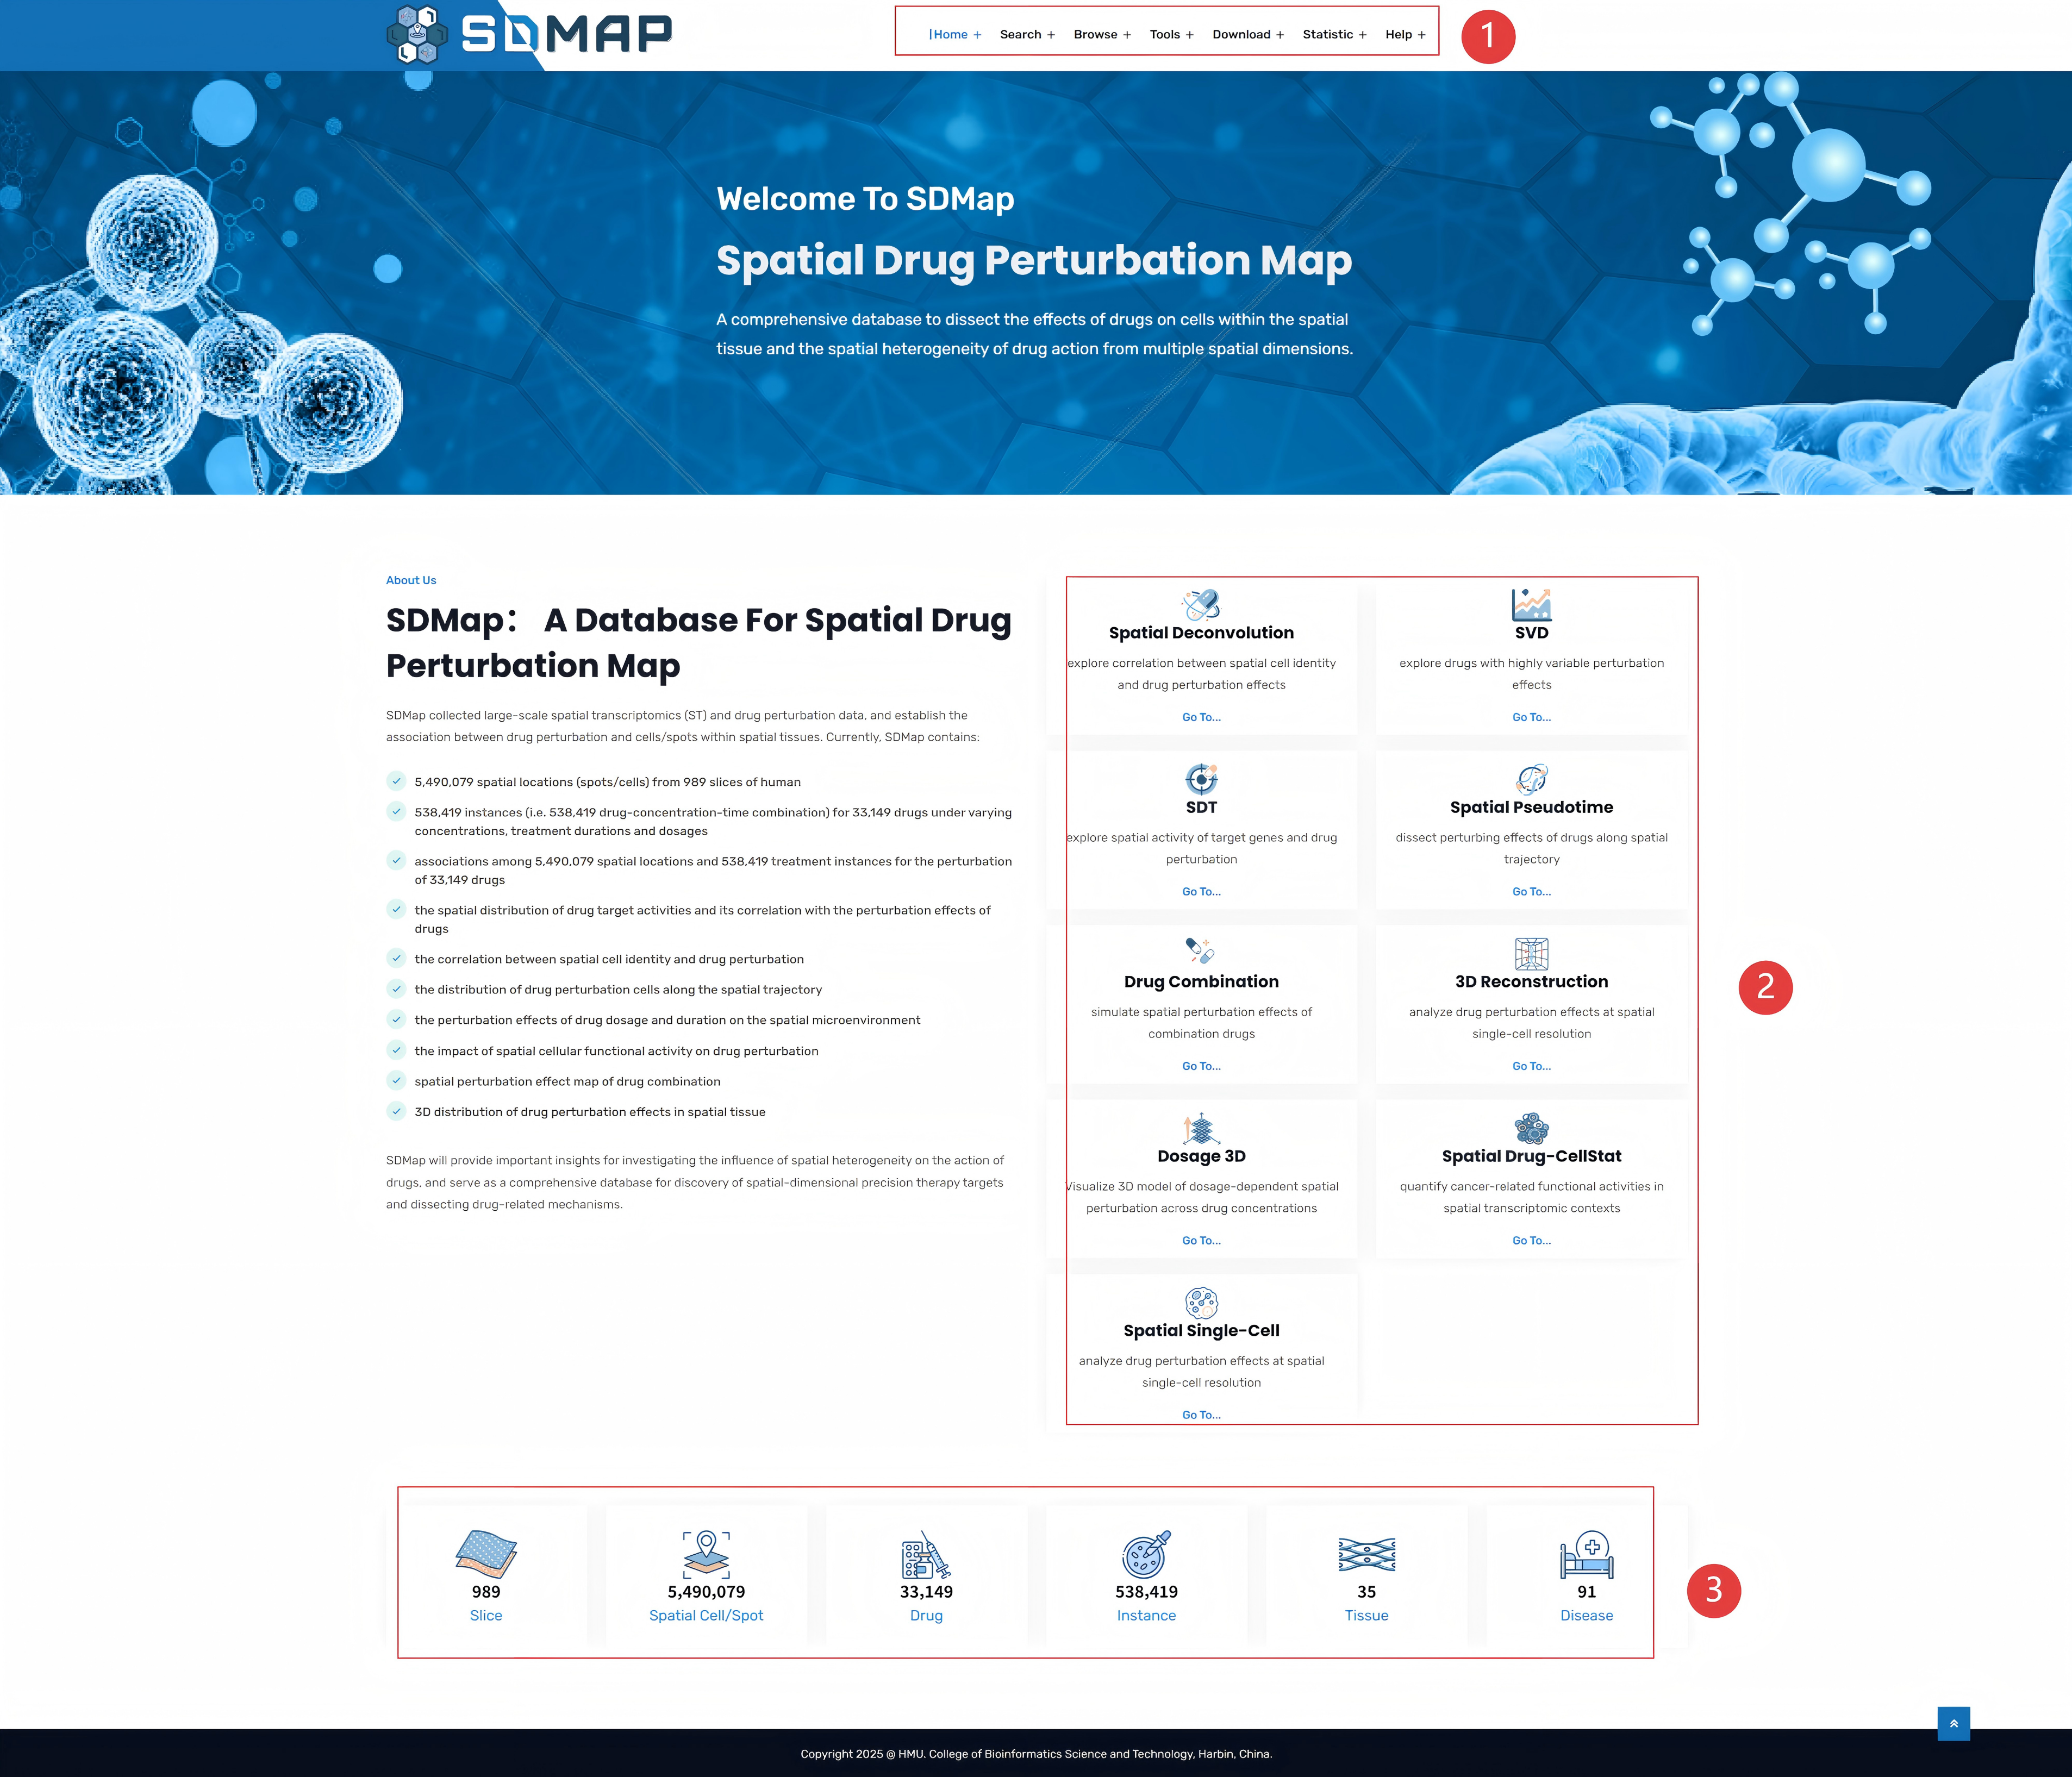
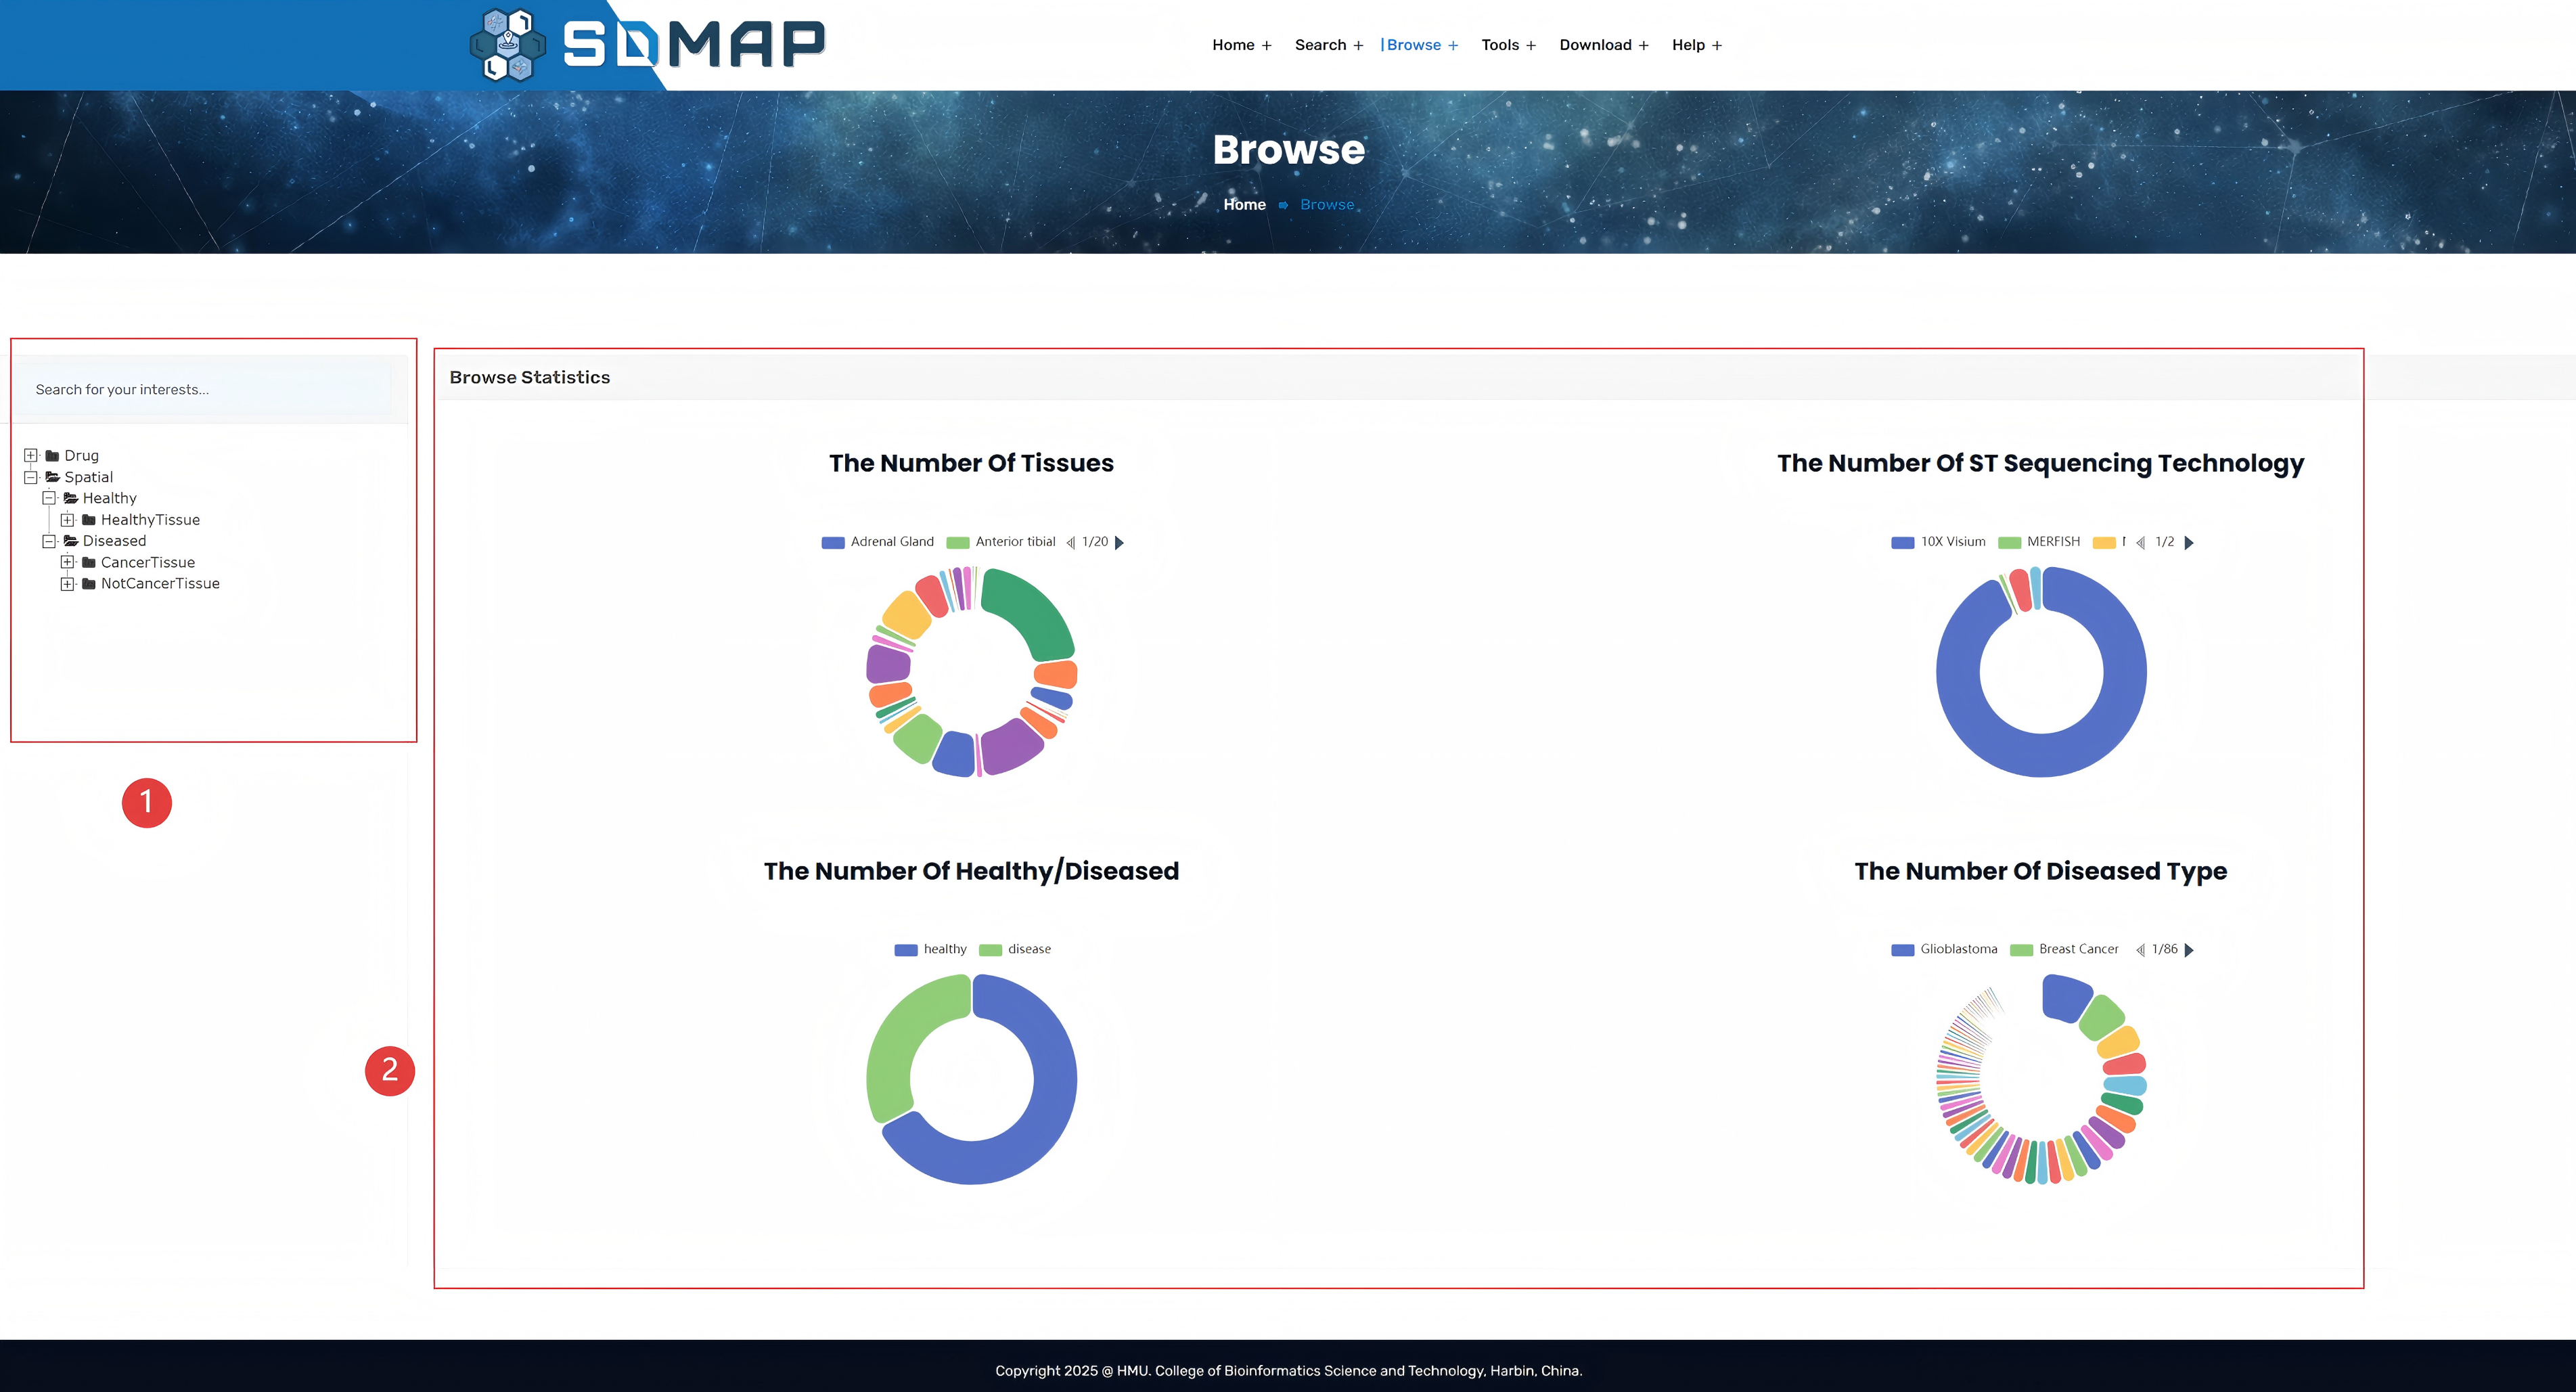
The data system of the SDMap database is composed of three core modules, which provide basic support for spatial drug research through multi-source integration:
1.Spatial transcriptome data: systematically collect raw data from public databases such as GEO, published academic literatures, and 7 professional spatial transcriptome databases such as 10X GENOMICS, SpatialDB, and STOmicsDB, to achieve cross-platform data integration.
2.Single-cell paired data: screen single-cell datasets matching spatial transcriptome samples from the GEO database for spatial deconvolution analysis and establish molecular associations between single cells and spatial locations.
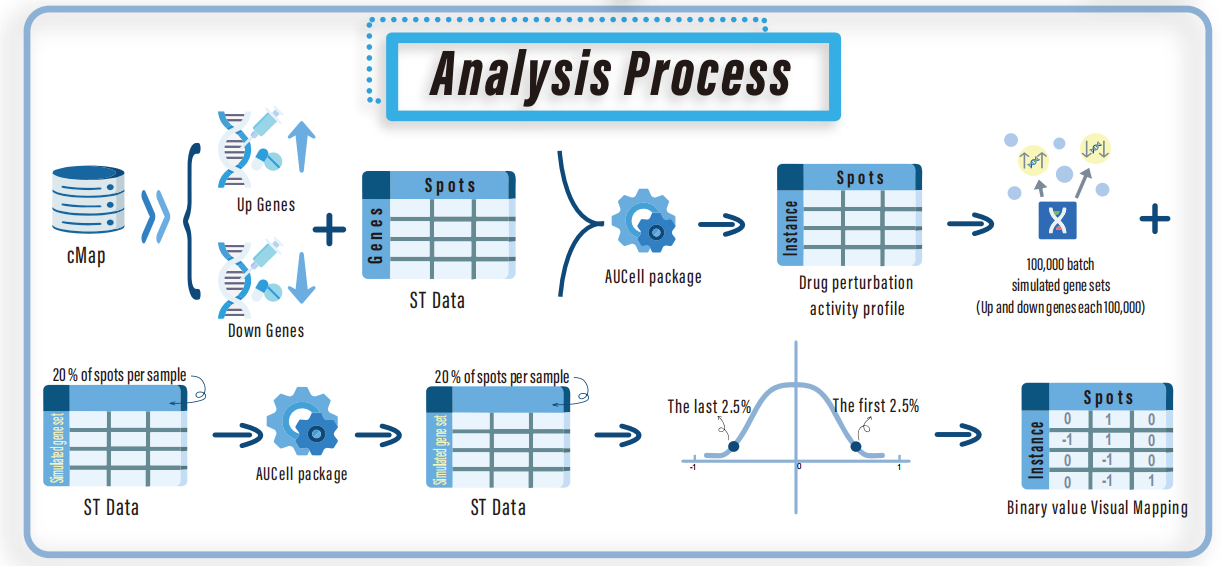
3.Drug perturbation gene set: based on CMap Build02 and CMap LINCS (Level 5) datasets (https://clue.io/data/), systematically organize gene expression change data under drug intervention, and construct a drug-gene perturbation feature library.
 SDMap/Tools/Spatial Deconvolution
-
Users can systematically explore the perturbation effects of drug concentration, action time, and cell line background on the deconvolved spatial locations, and support the following interactive functions:
· Multi-dimensional data linkage query: integrate drug basic information, spatial transcriptome metadata, original slice images, and spatial deconvolution visualization results to form a three-dimensional data view.
· Dynamic display of spatial perturbation: intuitively present the perturbation intensity of drugs at different spatial positions, support switching the display mode through the -1/0/1 score system (-1 = inhibitory effect, 0 = no significant effect, 1 = promoting effect), and can compare the perturbation differences of different cell types.
· In-depth mining of single-cell data: clicking the "single cell" button can retrieve the details of the single-cell dataset used for spatial deconvolution, realizing the traceability analysis from the spatial site to the single-cell level.
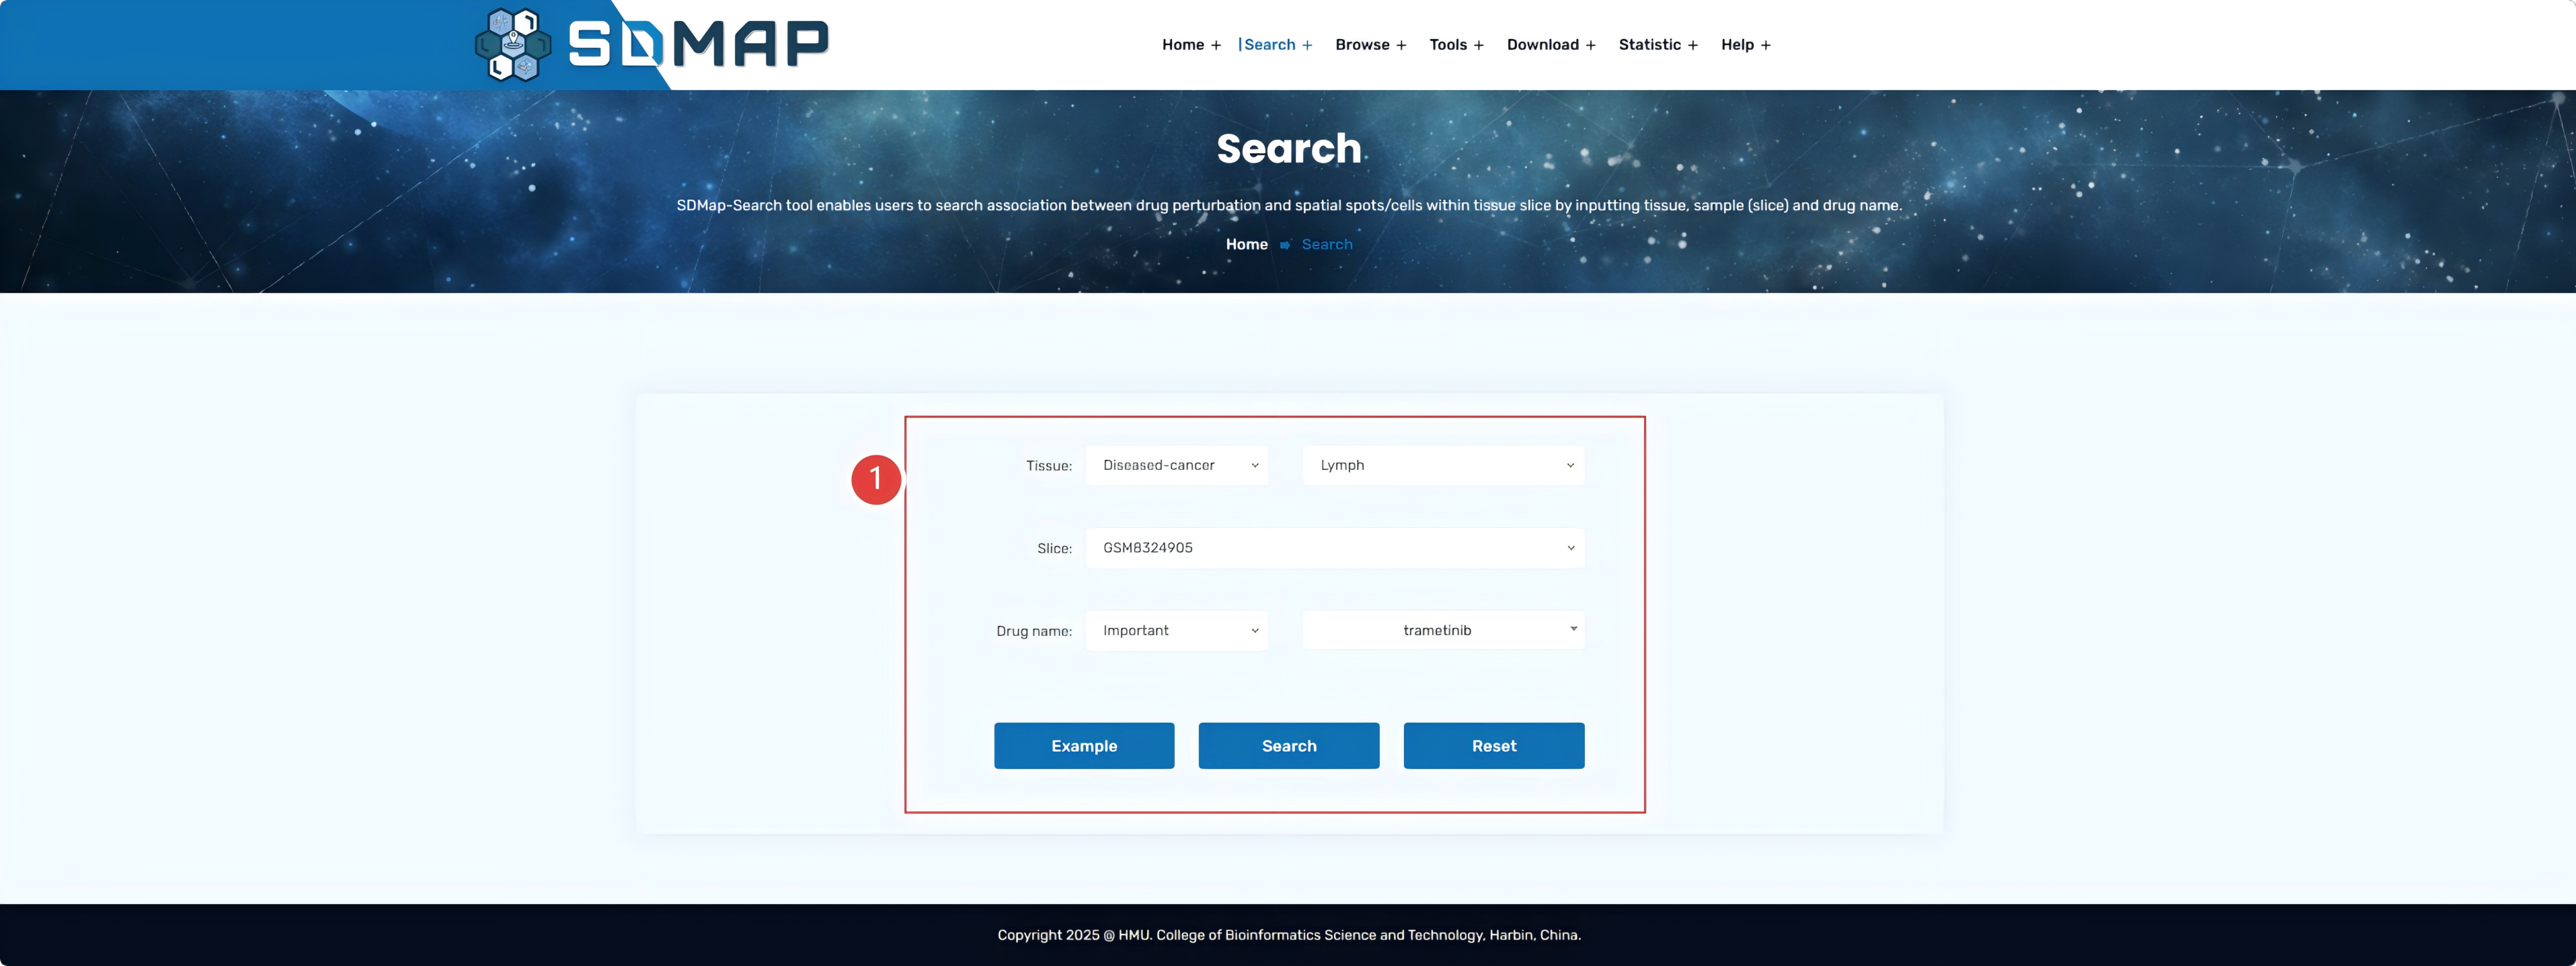
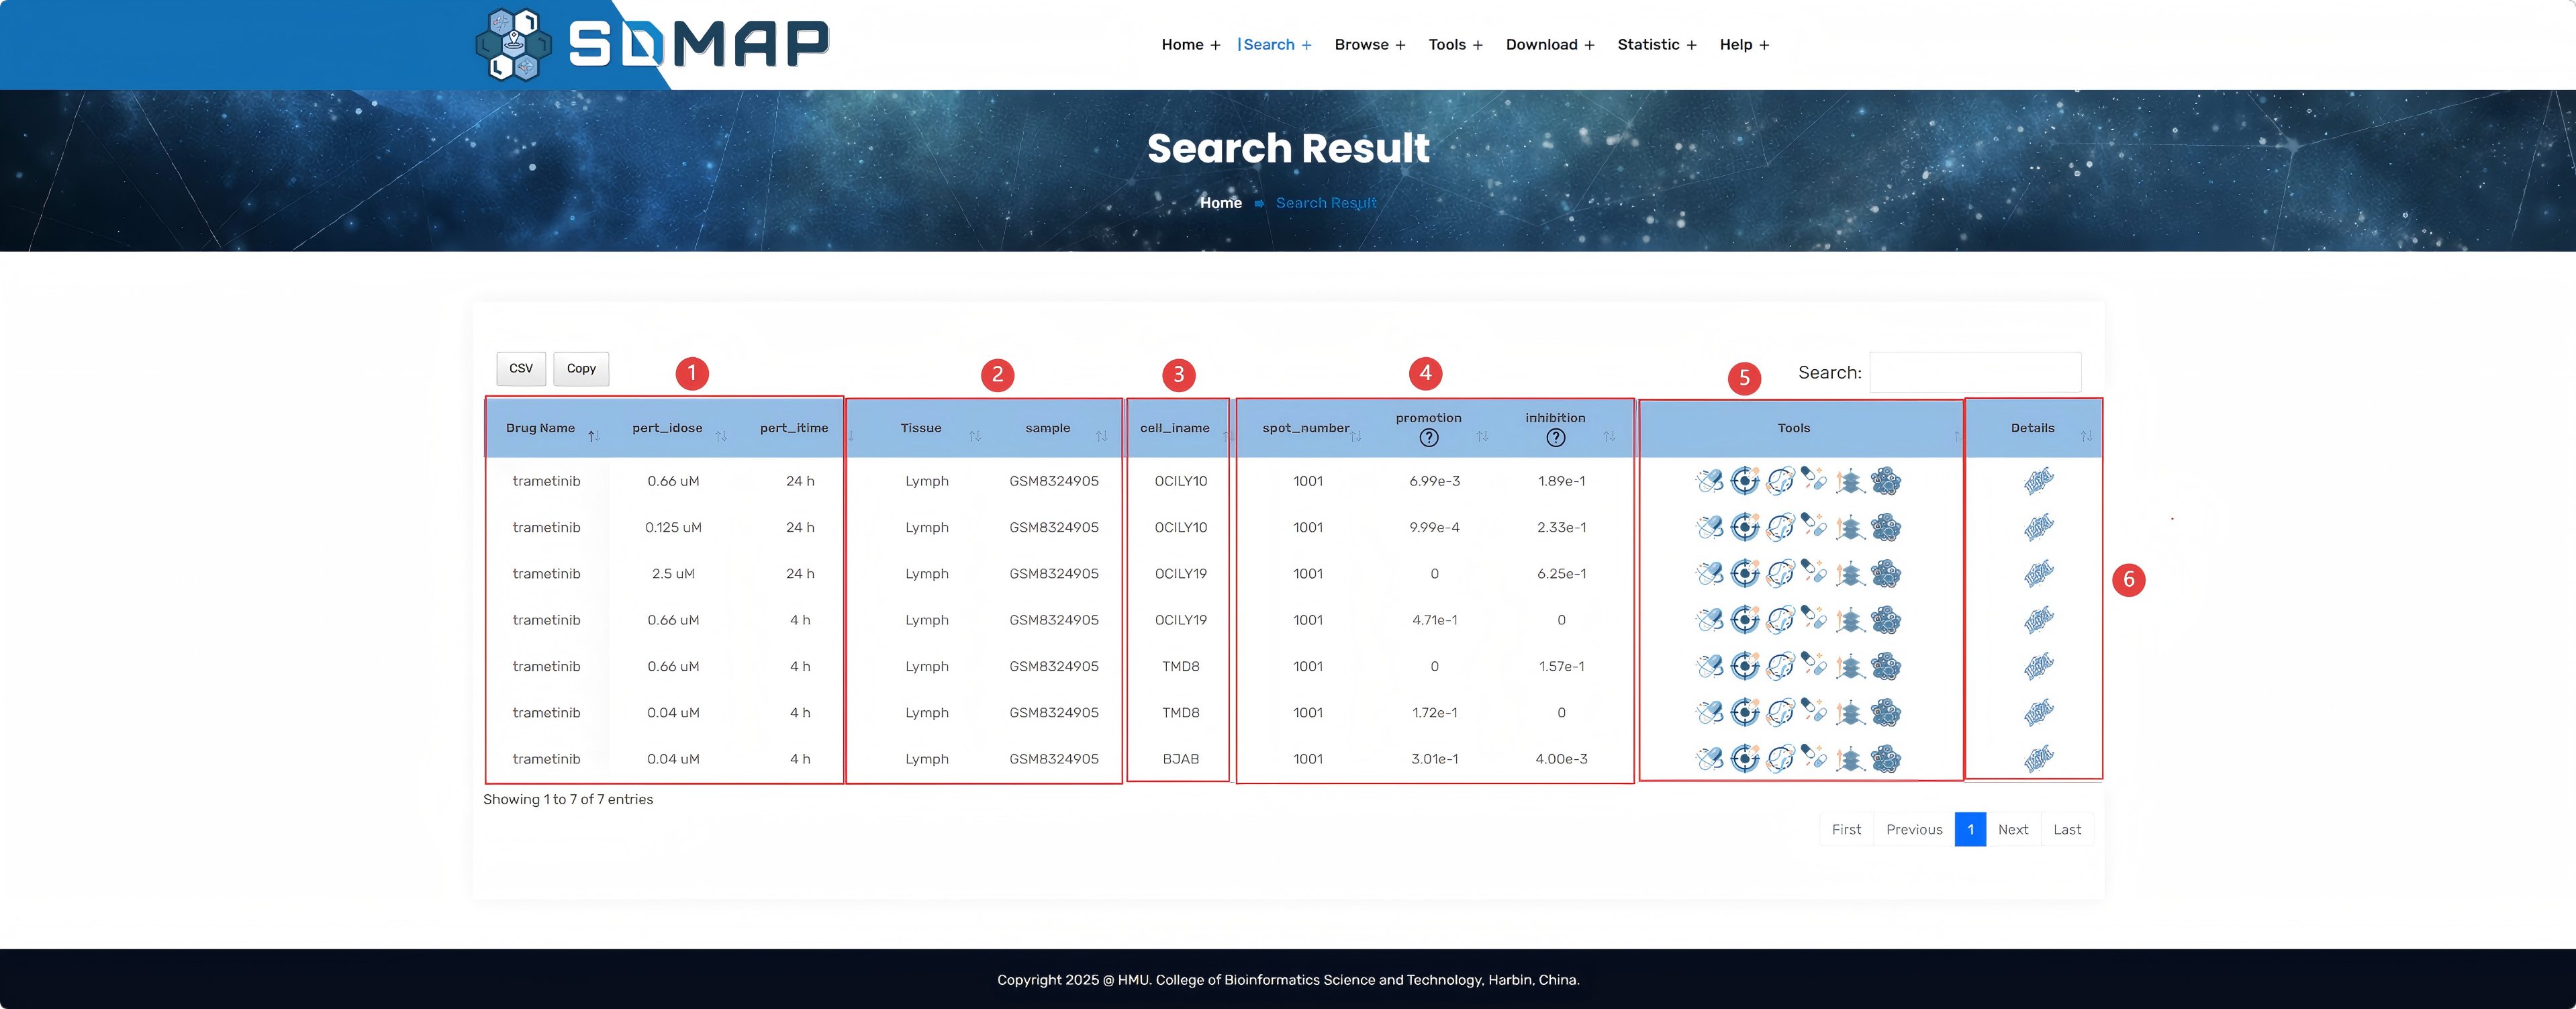
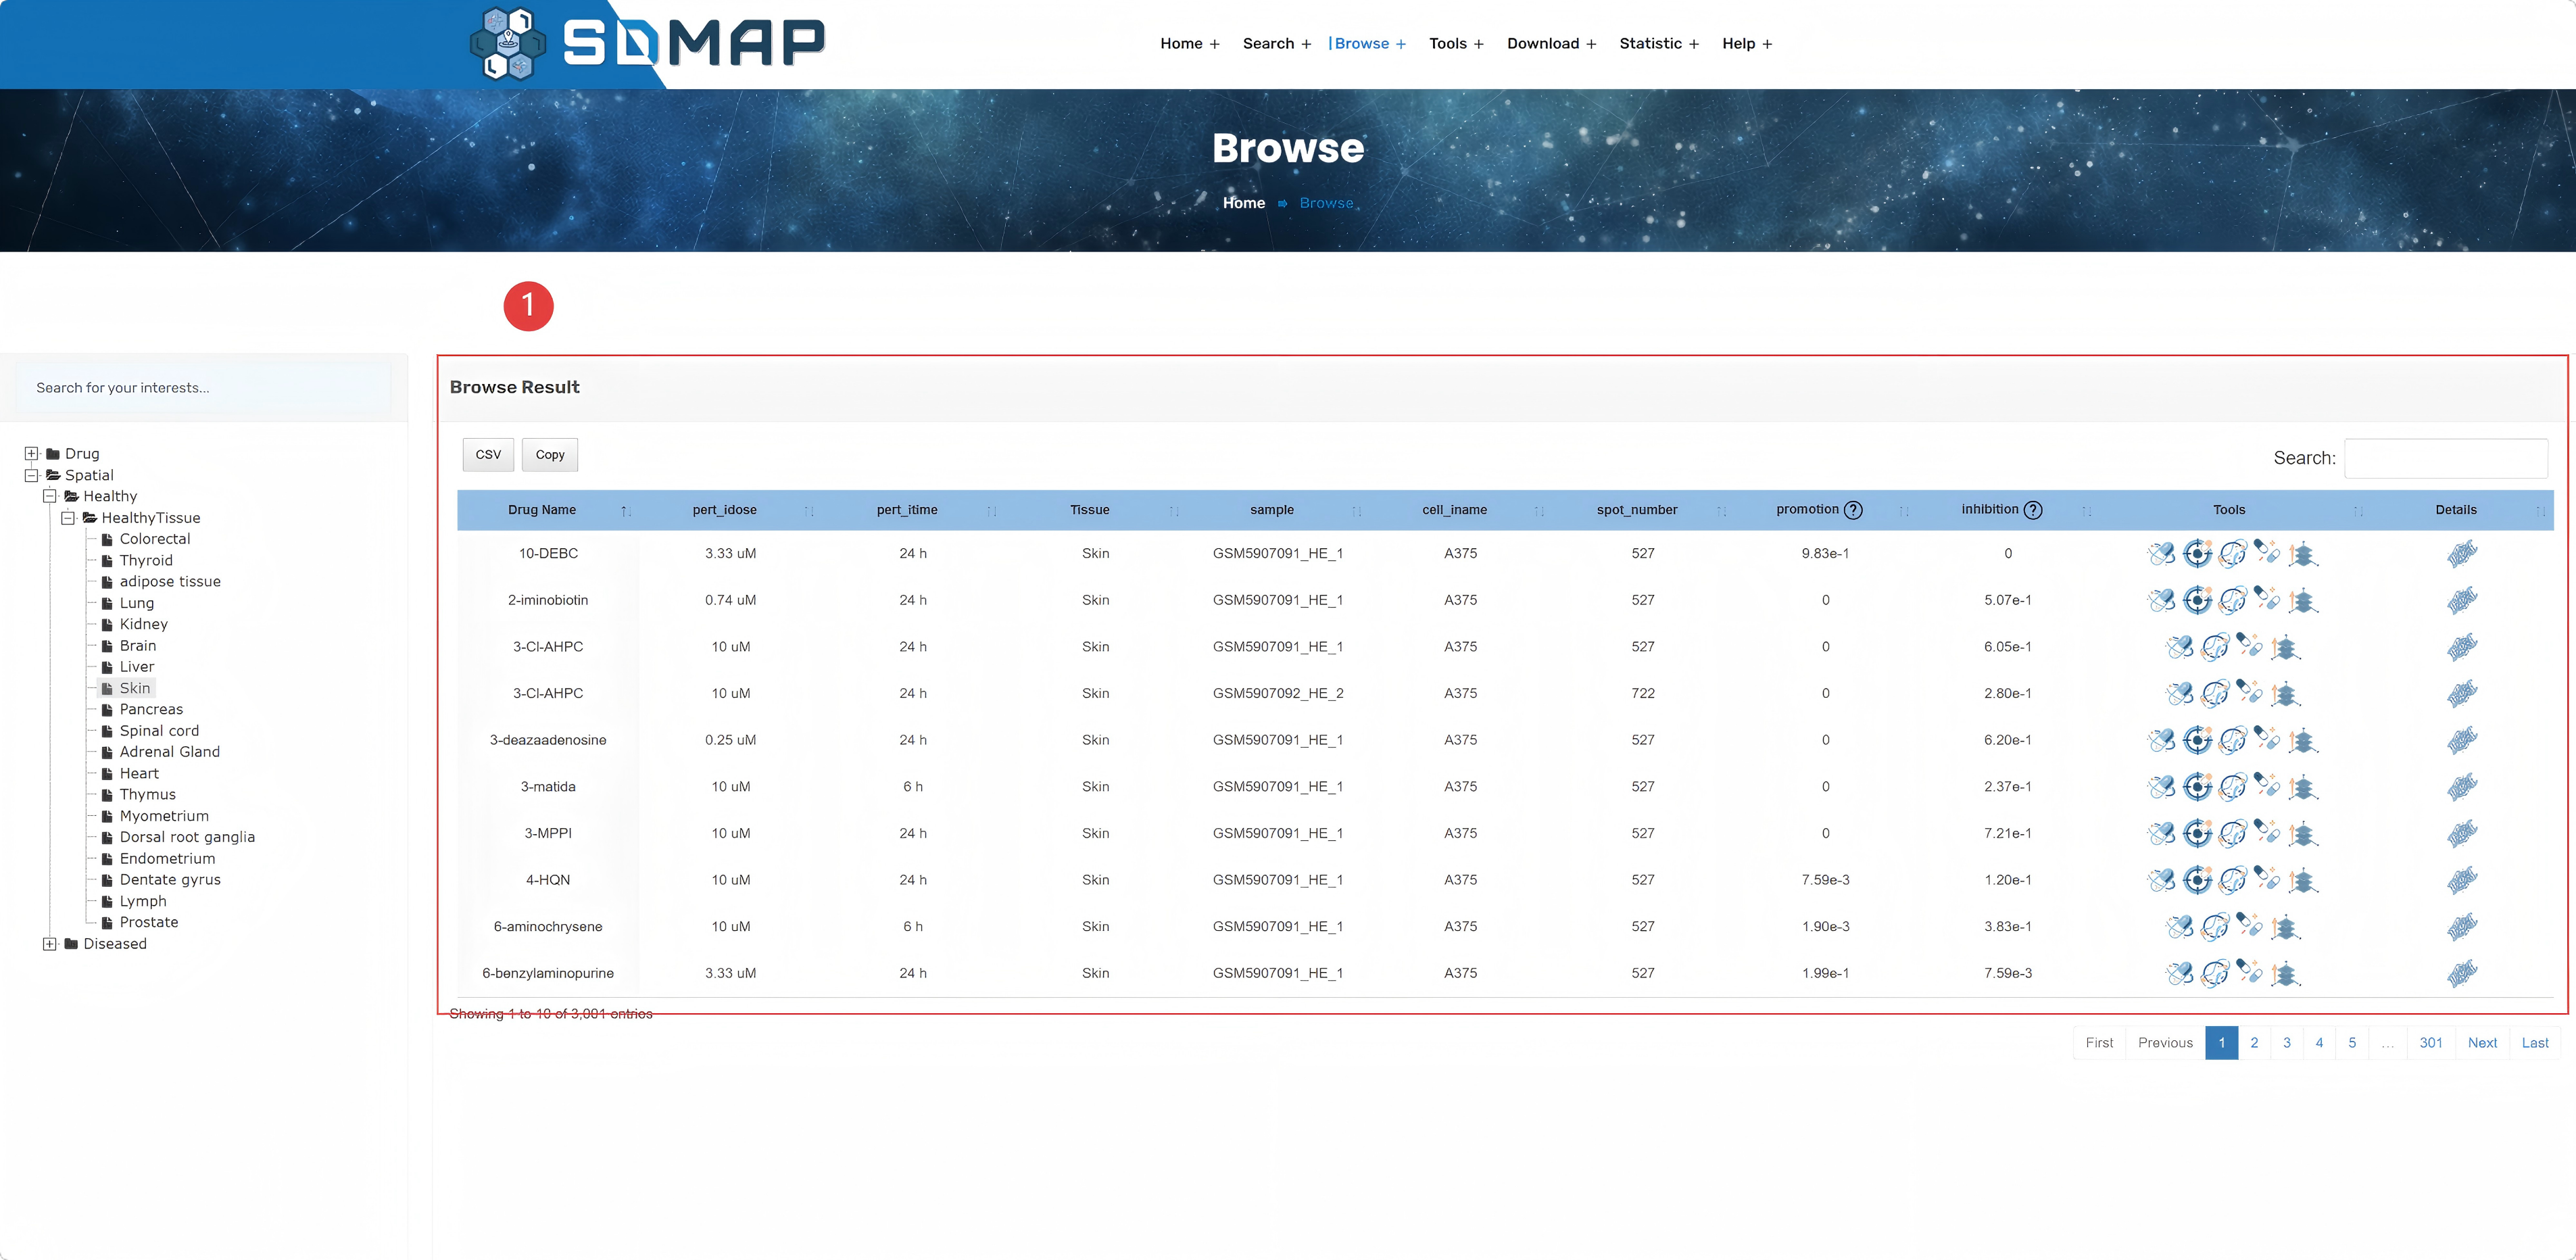
1.Users can select the dataset, samples, sample status, drug concentration, duration of action, as well as the cell line information that interest them, and then click "Search" for visualization.
2.Specific information about the selected drug and sample.
3.Tissue slice of sample.
4.Visualization of spatial transcriptome deconvolution results.
5.The score of drug disturbance can be switched between Continuous values and Binary values by the small tag above. In Binary values, 1 represents a significant promoting effect on the site, -1 represents a significant inhibitory effect, and 0 represents no significant effect.
6.Score of 3D drug perturbation.
7.Scatter plot of cell proportion and drug perturbation score.
8.Deconvolution of Spatial Transcriptome Accompanied by Single-Cell Correlation Visualization
 SDMap/Tools/SVD
-
Users can systematically explore the differences in perturbation scores between different regions of tissues under the combined conditions of drug concentration, action time, and cell lines. The database supports:
· Visual analysis: intuitively present the significant perturbation scores of the top 50 drugs in different conditions in the tissue area, and flexibly switch the -1/0/1 display mode (-1 indicates inhibitory effect, 0 represents no significant effect, 1 indicates promoting effect);
· Spatial classification comparison: visualize the spatial classification of spots based on cell clusters, cell types, and niches, and realize multi-dimensional comparative analysis;
· In-depth exploration tools: deeply analyze the perturbation effects of drugs on different cell types and niches through lollipop charts, helping to explore mechanisms.
1.Users can choose the samples they are interested in.
2.Top 50 instances selected by SVD.
3.Drug and sample specific information.
4.spots_in_niche/celltype:The number of spots in this niche/celltype.
Niche/celltype Neg/Total_Neg:The number of spots with a value of -1 in this niche/celltype / the number of spots with a value of -1 among all spots.
p_negative:The p-value of the hypergeometric test for the inhibition of this niche/celltype by this instance.
Niche/celltype Pos/Total_Pos:The number of spots with a value of 1 in this niche/celltype / the number of spots with a value of 1 among all spots.
p_positive:The p-value of the hypergeometric test for the promotion of this niche/celltype by this instance.
Association:Determine whether this instance is associated with this niche/celltype. The judgment criteria are as follows: if the p-value of the hypergeometric test for inhibition is significant, the p-value of the hypergeometric test for promotion is not significant, and the number of inhibitory spots in this niche/celltype is twice the number of promotional spots, then it is judged as inhibition; otherwise, it is judged as promotion; in other cases, it is judged as no association.
5.Cellular Landscape with slices are displayed with small tabs that allow the user to switch between cell clusters, cell types, and niches.
6.Drug perturbation scores with cell clusters, cell types, niches
7.Drug promotion/inhibition spots in spatial landscape.
 SDMap/Tools/SDT
-
Users can explore the spatial expression characteristics of 892 target genes of 2,352 targeted drugs, and support:
· Spatial visualization of drug target genes: intuitively display the expression distribution of targeted drug target genes in the tissue space.
· Multi-dimensional expression analysis: analyze the expression differences of target genes in different cell types and niches through lollipop charts, helping to explain the spatial dimension of drug target action mechanisms.
1.The user can select the tissue of interest, the drug target, concentration, duration of action, and cell line of action of the targeted drug.
2.Specific information about the selected drug and sample.
3.spots_in_niche/celltype:The number of spots in this niche/celltype.
Niche/celltype Neg/Total_Neg:The number of spots with a value of -1 in this niche/celltype / the number of spots with a value of -1 among all spots.
p_negative:The p-value of the hypergeometric test for the inhibition of this niche/celltype by this instance.
Niche/celltype Pos/Total_Pos:The number of spots with a value of 1 in this niche/celltype / the number of spots with a value of 1 among all spots.
p_positive:The p-value of the hypergeometric test for the promotion of this niche/celltype by this instance.
Association:Determine whether this instance is associated with this niche/celltype. The judgment criteria are as follows: if the p-value of the hypergeometric test for inhibition is significant, the p-value of the hypergeometric test for promotion is not significant, and the number of inhibitory spots in this niche/celltype is twice the number of promotional spots, then it is judged as inhibition; otherwise, it is judged as promotion; in other cases, it is judged as no association.
4.Cellular Landscape and spatial expression of drug target genes, user can switch between cell clusters, cell types, and niches by using the small tabs on top.
5.Expression of drug target genes in three groupings: cell cluster, cell type, and niche.
6.Drug perturbation scores with cell clusters, cell types,niches.
7.Scatterplot of drug target genes versus drug perturbation score, where the color of the points can be switched for grouping by cell clusters, cell types, and niches using the upper labels.
8.Drug promotion/inhibition spots in spatial landscape.
9.Separated by various groupings of cell clusters, cell types, and niches.
 SDMap/Tools/Spatial Pseudotime
-
Users can systematically explore the perturbation effects of drug concentration, action time, and cell line factors on the pseudotime process of tissues. The database supports:
· Dynamic analysis of spatial pseudotime: visualize and color the spatial locations through pseudotime values, and intuitively present the tissue development trajectory and growth dynamics.
· Multi-dimensional visual display: combine the trajectory map and scatter plot to clearly present the correlation characteristics between the perturbation effect and pseudotime under different drug conditions.
· Flexible interactive analysis: support switching the coloring dimension according to cell clusters, cell types, and niches, and deeply analyze the spatiotemporal evolution law of drug perturbation at different biological levels.
1.Users can select the dataset, samples, sample status, drug concentration, duration of action, as well as the cell line information that interest them, and then click "Search" for visualization.
2.Specific information about the selected drug and sample.
3.spots_in_niche/celltype:The number of spots in this niche/celltype.
Niche/celltype Neg/Total_Neg:The number of spots with a value of -1 in this niche/celltype / the number of spots with a value of -1 among all spots.
p_negative:The p-value of the hypergeometric test for the inhibition of this niche/celltype by this instance.
Niche/celltype Pos/Total_Pos:The number of spots with a value of 1 in this niche/celltype / the number of spots with a value of 1 among all spots.
p_positive:The p-value of the hypergeometric test for the promotion of this niche/celltype by this instance.
Association:Determine whether this instance is associated with this niche/celltype. The judgment criteria are as follows: if the p-value of the hypergeometric test for inhibition is significant, the p-value of the hypergeometric test for promotion is not significant, and the number of inhibitory spots in this niche/celltype is twice the number of promotional spots, then it is judged as inhibition; otherwise, it is judged as promotion; in other cases, it is judged as no association.
4.Cellular Landscape and and drug perturbation scores and drug promotion/inhibition spots are displayed spatially, and the user can toggle through the small tabs at the top.
5.The display of pseudotime values in space and on trajectories.
6.The display of cell clusters, cell types, and niches on the trajectory plot.
7.The display of drug perturbation scores and drug promotion/inhibition spots in the spatial landscape on the trajectory plot, which users can switch between via the upper menu.
8.Scatter plot of pseudotime values and drug perturbation scores, where the color of the points can be switched for grouping by cell clusters, cell types, and niches using the upper labels.
9.Display the graph at position 8 by splitting it according to different groups.
 SDMap/Tools/Drug combination
-
Users can simulate the combined drug effect through the drug perturbation score addition model, and support:
· Visualization of combined action: select the action conditions of two drugs, intuitively display the perturbation addition score, and simultaneously display the same-direction synergy or interaction inhibition effect between drugs.
· Dynamic trend analysis: display the score change trajectory under different drug concentrations and action times through a 3D line chart, helping to explore the perturbation law and optimal action conditions of combined drugs.
1.Users can select the samples they are interested in and the two drugs they want to simulate for co-administration.
2.Specific information about the selected two drugs and sample.
3.Cellular Landscape and additive averaging of the two drug perturbation scores, and the user can switch between cell clusters, cell types, and niches using small icons on the graphs.
4.Bar chart showing the situation of combined drug perturbation scores in cell clusters, cell types, and niches.
5.Spatially display whether the two drugs have synergistic or antagonistic effects.1 means that the two drugs have a simultaneous promoting effect on a locus, 0 means that there is a reciprocal inhibition, and -1 means that there is a simultaneous inhibiting effect.
6.Scatter plot showing the perturbation scores of the two drugs, where the color of the points can be switched for grouping by cell clusters, cell types, and niches using the upper labels.
7.3D scatter plot visualization of combined drug perturbation scores, time, and dosage, where the combined drug perturbation score is the average score across all spatial locations.
8.Display the graph at position 6 by splitting it according to different groups.
 SDMap/Tools/3D reconstruction
-
Users can use the SPACEL algorithm to perform spatial registration and 3D reconstruction of tissue sections of the same patient, achieving:
· 3D spatial dynamic visualization: intuitively present the distribution characteristics of drug perturbation scores in three-dimensional space, and support switching the display mode through the -1/0/1 score system (-1 = inhibitory effect, 0 = no significant effect, 1 = promoting effect).
· Multi-dimensional statistical analysis: use box plots to quantitatively analyze the differences in drug perturbation scores of different cell clusters, cell types, and niches in the 3D model, helping to analyze the laws of spatial heterogeneity.

1.Users can select the dataset they are interested in visualizing as well as the drug.
2.Specific information about the selected drug.
3.Cellular Landscape and drug perturbation scores are presented in 3D space, and the user can switch between cell clusters, cell types, and niches via small tabs at the top.
4.Left panel: drug perturbation scores for each subgroup of cell clusters, cell types, and niches, right panel: 1 means significant promotion of the locus, 0 means no significant effect, -1 means significant inhibition.
 SDMap/Tools/Dosage 3D
-
Users can utilize this function to construct a dynamic 3D model of perturbation score data from spatial transcriptomic slices corresponding to different drug dosages under the same action time dimension, arranged in the order of dosages from low to high:
· Dosage 3D spatial dynamic visualization: intuitively present the distribution characteristics of drug perturbation scores in the 3D space where the same action time under the same slice changes with concentration, and support switching the display mode through the -1/0/1 scoring system (-1 = inhibitory effect, 0 = no significant effect, 1 = promoting effect).
1.Users can select the sample they are interested in visualizing as well as the drug at the same time point.
2.Specific information about the selected drug and sample.
3.Cellular Landscape and 3D spatial display of drug perturbation scores at different concentrations under the selected time and for the same sample.
4.Tissue slice and Spatial distribution of drug promotion/inhibition spots at different concentrations under the selected time and for the same sample.
 SDMap/Tools/Spatial Drug-Cellstat
-
Users can score data within the spatial localization framework of spatial transcriptomics using this function, which is based on gene sets related to malignant cell states (including oncogenic pathway functions, cancer hallmark functions, and functional statuses):
· Spatial visualization of malicious pathway score: intuitively display the malicious pathway score in the tissue space.
· Multi-dimensional expression analysis: analyze the malicious pathway score in different cell types and niches through boxplot charts, helping to explain the spatial dimension of malicious pathway mechanisms.
1.Users can choose the cancer samples they are interested in.
2.Specific information about the selected drug and cancer sample.
3.spots_in_niche/celltype:The number of spots in this niche/celltype.
Niche/celltype Neg/Total_Neg:The number of spots with a value of -1 in this niche/celltype / the number of spots with a value of -1 among all spots.
p_negative:The p-value of the hypergeometric test for the inhibition of this niche/celltype by this instance.
Niche/celltype Pos/Total_Pos:The number of spots with a value of 1 in this niche/celltype / the number of spots with a value of 1 among all spots.
p_positive:The p-value of the hypergeometric test for the promotion of this niche/celltype by this instance.
Association:Determine whether this instance is associated with this niche/celltype. The judgment criteria are as follows: if the p-value of the hypergeometric test for inhibition is significant, the p-value of the hypergeometric test for promotion is not significant, and the number of inhibitory spots in this niche/celltype is twice the number of promotional spots, then it is judged as inhibition; otherwise, it is judged as promotion; in other cases, it is judged as no association.
4.Cellular Landscape.
5.Spatial malignant pathway score.
6.Spatial malignant pathway score in three groupings: cell cluster, cell type, and niche.
7.Spatial drug perturbation score.
8.Scatter plot of malignant pathway scores and drug perturbation scores.
9.Spatial distribution of drug promotion/inhibition spots.
10.Display the graph at position 8 by splitting it according to different groups.
 SDMap/Tools/Spatial single-cell
-
Users can perform visualization analysis of drug perturbation scores on single-cell resolution spatial transcriptome data, and support:
· High-resolution local exploration: perform 1000×1000 pixel-level local magnification on single-cell spatial transcriptome data by inputting the start coordinates of the XY axis, and accurately analyze the spatial structure at the single-cell level.
· Multi-dimensional correlation analysis: intuitively present the correlation between the distribution of cell clusters, cell types, and niches at the single-cell level and drug perturbation scores, helping to mine the micro-mechanism of spatial heterogeneity.

1.Users can select the single-cell resolution spatial transcriptome samples as well as drugs they are interested in visualizing, and at the same time can zoom in on local areas via xy.
2.Specific information about the selected drug and sample.
3.UMAP charts and pie charts of cell proportions.
4.Cellular Landscape.
5.Global and zoomed-in images of the sample, with small tabs at the top that allow the user to switch between cell clusters, cell types, and niches.
6.Spatial drug perturbation score.
7.Spatial distribution of drug promotion/inhibition spots.